Edmonton Strathcona
Edmonton Strathcona (formerly known as Edmonton—Strathcona) is a federal electoral district in Alberta, Canada, that has been represented in the House of Commons of Canada since 1953. It spans the south central part of the city of Edmonton. As of the 2019 general election, Edmonton Strathcona is the only federal riding in Alberta not held by the Conservative Party, as was previously the case between 2008 and 2015.
 Edmonton Strathcona (2013 boundaries) | |||
| Federal electoral district | |||
| Legislature | House of Commons | ||
| MP |
New Democratic | ||
| District created | 1952 | ||
| First contested | 1953 | ||
| Last contested | 2019 | ||
| District webpage | profile, map | ||
| Demographics | |||
| Population (2011)[1] | 103,183 | ||
| Electors (2019) | 77,285 | ||
| Area (km²)[2] | 80 | ||
| Pop. density (per km²) | 1,289.8 | ||
| Census division(s) | Division No. 11 | ||
| Census subdivision(s) | Edmonton | ||
Geography
The riding is home to most of Edmonton's francophones. The historic district of Old Strathcona, the University of Alberta, the University of Alberta Campus Saint-Jean and the Mackenzie Health Sciences Centre are all located in the riding.
Edmonton Strathcona encompasses the neighbourhoods of Allendale, Argyll, Avonmore, Belgravia, Bonnie Doon, Capilano, Cloverdale, Empire Park, Forest Heights, Fulton Place, Garneau, Gold Bar, Grandview Heights, Hazeldean, Holyrood, Idylwylde, Kenilworth, King Edward Park, Lansdowne, Lendrum Place, Malmo Plains, McKernan, Ottewell, Parkallen, Pleasantview, Queen Alexandra Park, Ritchie, Riverdale, Strathcona, Strathearn, Terrace Heights, and Windsor Park.
It borders on the federal ridings of Edmonton Centre, Edmonton Griesbach, Sherwood Park—Fort Saskatchewan, Edmonton Mill Woods, and Edmonton Riverbend.
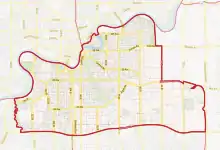
This district is bounded:[3]
- On the north by the North Saskatchewan River (except for a jog that goes around the neighbourhood of Riverdale, which is north of the river).
- On the west by the Whitemud Creek from the North Saskatchewan River to Whitemud Drive.
- On the south by Whitemud Drive, from Whitemud Creek to the City Limits.
- On the east by Edmonton's City Limits.
Political geography
As evidenced by the 2008 and 2011 elections, this riding is heavily polarized between more urban NDP voters concentrated in the northwest of the riding and suburban Conservative voters concentrated in the south and east.
The NDP picked up this seat in 2008 for the first time in its history, when Edmonton lawyer Linda Duncan defeated Tory incumbent Rahim Jaffer, thanks to a consolidation of non-Conservative votes.
Demographics
- According to the Canada 2011 Census; 2013 representation[4][5]
Ethnic groups: 79.2% White, 4.4% Chinese, 4.3% Aboriginal, 2.8% South Asian, 2.1% Filipino, 1.5% Black, 1.2% Latin American, 1.0% Arab
Languages: 77.3% English, 3.8% French, 3.5% Chinese, 2.5% German, 1.5% Ukrainian, 1.3% Spanish, 1.3% Tagalog
Religions: 52.8% Christian (22.1% Catholic, 5.6% United Church, 3.5% Lutheran, 3.5% Anglican, 2.2% Baptist, 2.0% Christian Orthodox, 1.1% Pentecostal, 13.0% Other), 2.5% Muslim, 1.2% Hindu, 1.1% Buddhist, 40.6% No religion
Median income (2010): $35,026
Average income (2010): $46,710
History
The electoral district of Strathcona dates back to Territorial times (see Strathcona (electoral district), and was represented by Liberal MPs, then a Unionist/Conservative MP, and a United Farmer of Alberta MP.
The electoral district of "Edmonton -Strathcona" was created in 1952 from Edmonton East and Edmonton West ridings.
"Edmonton—Strathcona" gained territory from Edmonton East and was renamed "Edmonton Strathcona" during the 2012 electoral redistribution.
Members of Parliament
This riding has elected the following members of the House of Commons:
| Parliament | Years | Member | Party | |
|---|---|---|---|---|
| Edmonton—Strathcona Riding created from Edmonton East and Edmonton West |
||||
| 22nd | 1953–1957 | Richmond Francis Hanna | Liberal | |
| 23rd | 1957–1958 | Sydney Herbert Thompson | Social Credit | |
| 24th | 1958–1962 | Terry Nugent | Progressive Conservative | |
| 25th | 1962–1963 | |||
| 26th | 1963–1965 | |||
| 27th | 1965–1968 | |||
| 28th | 1968–1972 | Hu Harries | Liberal | |
| 29th | 1972–1974 | Douglas Roche | Progressive Conservative | |
| 30th | 1974–1979 | |||
| 31st | 1979–1980 | David Kilgour | ||
| 32nd | 1980–1984 | |||
| 33rd | 1984–1988 | |||
| 34th | 1988–1993 | Scott Thorkelson | ||
| 35th | 1993–1997 | Hugh Hanrahan | Reform | |
| 36th | 1997–2000[nb 1] | Rahim Jaffer | ||
| 2000–2000 | Alliance | |||
| 37th | 2000–2003[nb 2] | |||
| 2003–2004 | Conservative | |||
| 38th | 2004–2006 | |||
| 39th | 2006–2008 | |||
| 40th | 2008–2011 | Linda Duncan | New Democratic | |
| 41st | 2011–2015 | |||
| Edmonton Strathcona | ||||
| 42nd | 2015–2019 | Linda Duncan | New Democratic | |
| 43rd | 2019–present | Heather McPherson | ||
Current Member of Parliament
Its Member of Parliament is Heather McPherson of the New Democratic Party who was elected in the 2019 federal election.
Election results
Edmonton Strathcona (2015–present)
| 2019 Canadian federal election | ||||||||
|---|---|---|---|---|---|---|---|---|
| Party | Candidate | Votes | % | ±% | Expenditures | |||
| New Democratic | Heather McPherson | 26,823 | 47.3% | +3.34 | $91,753.90 | |||
| Conservative | Sam Lilly | 21,035 | 37.1% | +5.82 | $88,211.43 | |||
| Liberal | Eleanor Olszewski | 6,592 | 11.6% | -9.13 | $91,354.39 | |||
| Green | Michael Kalmanovitch | 1,152 | 2.0% | -0.30 | $8,919.41 | |||
| People's | Ian Cameron | 941 | 1.7% | - | none listed | |||
| Communist | Naomi Rankin | 125 | 0.2% | - | none listed | |||
| Marxist–Leninist | Dougal MacDonald | 77 | 0.1% | -0.07 | none listed | |||
| Total valid votes/Expense limit | 56,745 | 100.0 | ||||||
| Total rejected ballots | 250 | |||||||
| Turnout | 56,995 | 73.7 | ||||||
| Eligible voters | 77,285 | |||||||
| New Democratic hold | Swing | -1.24 | ||||||
| Source: Elections Canada[6][7] | ||||||||
| 2015 Canadian federal election | ||||||||
|---|---|---|---|---|---|---|---|---|
| Party | Candidate | Votes | % | ±% | Expenditures | |||
| New Democratic | Linda Duncan | 24,446 | 43.96 | -9.75 | $87,241.42 | |||
| Conservative | Len Thom | 17,395 | 31.28 | -9.04 | $36,812.49 | |||
| Liberal | Eleanor Olszewski | 11,524 | 20.73 | +17.87 | $62,711.39 | |||
| Green | Jacob K. Binnema | 1,278 | 2.30 | -0.04 | $1,924.74 | |||
| Libertarian | Malcolm Stinson | 311 | 0.56 | – | $1,599.80 | |||
| Pirate | Ryan Bromsgrove | 201 | 0.36 | – | $2,183.76 | |||
| Rhinoceros | Donovan Eckstrom | 133 | 0.24 | – | – | |||
| Independent | Chris Jones | 116 | 0.21 | – | – | |||
| Independent | Andrew Schurman | 107 | 0.19 | – | – | |||
| Marxist–Leninist | Dougal MacDonald | 93 | 0.17 | -0.02 | – | |||
| Total valid votes/Expense limit | 55,604 | 100.00 | $208,715.39 | |||||
| Total rejected ballots | 217 | 0.39 | – | |||||
| Turnout | 55,821 | 73.29 | ||||||
| Eligible voters | 76,160 | |||||||
| New Democratic hold | Swing | -0.35 | ||||||
Source(s)
| ||||||||
| 2011 federal election redistributed results[8] | |||
|---|---|---|---|
| Party | Vote | % | |
| New Democratic | 26,753 | 53.71 | |
| Conservative | 20,084 | 40.32 | |
| Liberal | 1,422 | 2.85 | |
| Green | 1,165 | 2.34 | |
| Others | 384 | 0.77 | |
Edmonton—Strathcona (1953-2015)
| 2011 Canadian federal election | ||||||||
|---|---|---|---|---|---|---|---|---|
| Party | Candidate | Votes | % | ±% | Expenditures | |||
| New Democratic | Linda Duncan | 26,093 | 53.55 | +10.97 | $84,389 | |||
| Conservative | Ryan Hastman | 19,762 | 40.55 | −1.05 | $78,272 | |||
| Liberal | Matthew Sinclair | 1,372 | 2.82 | −6.24 | $15,741 | |||
| Green | Andrew Fehr | 1,119 | 2.30 | −4.14 | $43 | |||
| Independent | Kyle Murphy | 206 | 0.42 | – | $2,005 | |||
| Marxist–Leninist | Kevan Hunter | 91 | 0.19 | −0.12 | ||||
| Independent | Christopher White | 87 | 0.18 | – | $880 | |||
| Total valid votes/Expense limit | 48,730 | 100.00 | ||||||
| Total rejected ballots | 124 | 0.25 | +0.04 | |||||
| Turnout | 48,854 | 68.76 | +3.3 | |||||
| 2008 Canadian federal election | ||||||||
|---|---|---|---|---|---|---|---|---|
| Party | Candidate | Votes | % | ±% | Expenditures | |||
| New Democratic | Linda Duncan | 20,103 | 42.58 | +10.07 | $71,669 | |||
| Conservative | Rahim Jaffer | 19,640 | 41.60 | −0.11 | $81,597 | |||
| Liberal | Claudette Roy | 4,279 | 9.06 | −8.74 | $72,953 | |||
| Green | Jane Thrall | 3,040 | 6.44 | +0.49 | $3,801 | |||
| Marxist–Leninist | Kevan Hunter | 147 | 0.31 | +0.11 | ||||
| Total valid votes/Expense limit | 47,209 | 99.79 | $82,492 | |||||
| Total rejected ballots | 99 | 0.21 | −0.07 | |||||
| Turnout | 47,308 | 65.4 | −5.2 | |||||
| 2006 Canadian federal election | ||||||||
|---|---|---|---|---|---|---|---|---|
| Party | Candidate | Votes | % | ±% | Expenditures | |||
| Conservative | Rahim Jaffer | 22,009 | 41.71 | +2.31 | $75,063 | |||
| New Democratic | Linda Duncan | 17,153 | 32.51 | +8.71 | $53,478 | |||
| Liberal | Andy Hladyshevsky | 9,391 | 17.80 | −11.21 | $76,923 | |||
| Green | Cameron Wakefield | 3,139 | 5.95 | −0.54 | $755 | |||
| Progressive Canadian | Michael Fedeyko | 582 | 1.10 | – | $0.0 | |||
| Marijuana | Dave Dowling | 390 | 0.74 | −0.33 | $0.0 | |||
| Marxist–Leninist | Kevan Hunter | 106 | 0.20 | −0.01 | $16 | |||
| Total valid votes | 52,770 | 100.00 | ||||||
| Total rejected ballots | 148 | 0.28 | −0.03 | |||||
| Turnout | 52,918 | 70.6 | +3.9 | |||||
| 2004 Canadian federal election | ||||||||
|---|---|---|---|---|---|---|---|---|
| Party | Candidate | Votes | % | ±% | Expenditures | |||
| Conservative | Rahim Jaffer | 19,089 | 39.40 | −2.60 | $67,449 | |||
| Liberal | Debby Carlson | 14,057 | 29.01 | −2.88 | $67,910 | |||
| New Democratic | Malcolm Azania | 11,535 | 23.80 | +9.02 | $46,100 | |||
| Green | Cameron Wakefield | 3,146 | 6.49 | – | $2,353 | |||
| Marijuana | Dave Dowling | 519 | 1.07 | −0.38 | ||||
| Marxist–Leninist | Kevan Hunter | 103 | 0.21 | −0.08 | $26 | |||
| Total valid votes | 48,449 | 100.00 | ||||||
| Total rejected ballots | 150 | 0.31 | ||||||
| Turnout | 48,599 | 65.66 | ||||||
| 2000 Canadian federal election | ||||||||
|---|---|---|---|---|---|---|---|---|
| Party | Candidate | Votes | % | ±% | Expenditures | |||
| Alliance | Rahim Jaffer | 23,463 | 42.00 | +0.70 | $57,365 | |||
| Liberal | Jonathan Dai | 17,816 | 31.89 | −3.49 | $48,430 | |||
| New Democratic | Hélène Narayana | 8,256 | 14.78 | +0.25 | $25,883 | |||
| Progressive Conservative | Gregory Toogood | 5,047 | 9.03 | +1.79 | $4,252 | |||
| Marijuana | Ken Kirk | 814 | 1.45 | – | $149 | |||
| Canadian Action | Kesa Rose Semenchuk | 299 | 0.53 | +0.35 | $1,485 | |||
| Marxist–Leninist | Kevan Hunter | 164 | 0.29 | – | $275 | |||
| Total valid votes | 55,859 | 100.00 | ||||||
| 1997 Canadian federal election | ||||||||
|---|---|---|---|---|---|---|---|---|
| Party | Candidate | Votes | % | ±% | Expenditures | |||
| Reform | Rahim Jaffer | 20,605 | 41.30 | +1.95 | $58,003 | |||
| Liberal | Ginette Rodger | 17,654 | 35.38 | −3.12 | $58,244 | |||
| New Democratic | Jean McBean | 7,251 | 14.53 | +9.48 | $42,936 | |||
| Progressive Conservative | Edo Nyland | 3,614 | 7.24 | −4.05 | $10,183 | |||
| Green | Karina Gregory | 406 | 0.81 | +0.23 | $520 | |||
| Natural Law | Maury Shapka | 153 | 0.30 | −0.29 | ||||
| Independent | Naomi Rankin | 115 | 0.23 | +0.05 | $1,732 | |||
| Canadian Action | J. Alex Ford | 92 | 0.18 | – | $845 | |||
| Total valid votes | 49,890 | 100.00 | ||||||
| Total rejected ballots | 101 | 0.20 | ||||||
| Turnout | 49,991 | 62.74 | ||||||
| 1993 Canadian federal election | ||||||||
|---|---|---|---|---|---|---|---|---|
| Party | Candidate | Votes | % | ±% | ||||
| Reform | Hugh Hanrahan | 19,531 | 39.35 | +17.10 | ||||
| Liberal | Chris Peirce | 19,113 | 38.50 | +20.61 | ||||
| Progressive Conservative | Scott Thorkelson | 5,604 | 11.29 | −22.17 | ||||
| New Democratic | Rita Egan | 2,508 | 5.05 | −20.27 | ||||
| National | Adrian Greenwood | 2,131 | 4.29 | |||||
| Natural Law | Maury Shapka | 292 | 0.59 | |||||
| Green | Harry Garfinkle | 287 | 0.58 | +0.28 | ||||
| Independent | Naomi Rankin | 90 | 0.18 | |||||
| Canada Party | Oran K. Johnson | 83 | 0.17 | |||||
| Total valid votes | 49,639 | 100.00 | ||||||
| 1988 Canadian federal election | ||||||||
|---|---|---|---|---|---|---|---|---|
| Party | Candidate | Votes | % | ±% | ||||
| Progressive Conservative | Scott Thorkelson | 18,088 | 33.46 | −27.97 | ||||
| New Democratic | Halyna Freeland | 13,686 | 25.32 | +5.10 | ||||
| Reform | Doug Main | 12,024 | 22.24 | – | ||||
| Liberal | Una MacLean Evans | 9,672 | 17.89 | +2.40 | ||||
| Rhinoceros | Marcel Zeeto Kotowich | 199 | 0.37 | – | ||||
| Green | Isabelle Foord | 159 | 0.29 | −0.56 | ||||
| Independent | Kevin Bruce | 86 | 0.16 | – | ||||
| Independent | Daniel P. Hermansen | 56 | 0.10 | – | ||||
| Independent | Mary Joyce | 43 | 0.08 | – | ||||
| Confederation of Regions | Thomas Roger Brown | 40 | 0.07 | −1.29 | ||||
| Total valid votes | 54,053 | 100.00 | ||||||
| 1984 Canadian federal election | ||||||||
|---|---|---|---|---|---|---|---|---|
| Party | Candidate | Votes | % | ±% | ||||
| Progressive Conservative | David Kilgour | 33,712 | 61.43 | +2.05 | ||||
| New Democratic | Doris S. Burghardt | 11,095 | 20.22 | +8.21 | ||||
| Liberal | Sandra Douglas-Tubb | 8,500 | 15.49 | −11.66 | ||||
| Confederation of Regions | Lorne Cass | 749 | 1.36 | |||||
| Green | Russell John Mulvey | 466 | 0.85 | |||||
| Social Credit | Norman Utz | 218 | 0.40 | |||||
| Communist | Anne McGrath | 137 | 0.25 | −0.01 | ||||
| Total valid votes | 54,877 | 100.00 | ||||||
| 1980 Canadian federal election | ||||||||
|---|---|---|---|---|---|---|---|---|
| Party | Candidate | Votes | % | ±% | ||||
| Progressive Conservative | David Kilgour | 23,920 | 59.38 | −0.09 | ||||
| Liberal | John Borger | 10,938 | 27.15 | −0.91 | ||||
| New Democratic | Doug Trace | 4,837 | 12.01 | −0.03 | ||||
| Rhinoceros | Dave Walker | 453 | 1.12 | |||||
| Communist | Joe Hill | 106 | 0.26 | −0.01 | ||||
| Marxist–Leninist | Sandy Mowat | 31 | 0.08 | −0.09 | ||||
| Total valid votes | 40,285 | 100.00 | ||||||
| 1979 Canadian federal election | ||||||||
|---|---|---|---|---|---|---|---|---|
| Party | Candidate | Votes | % | ±% | ||||
| Progressive Conservative | David Kilgour | 26,430 | 59.47 | +4.73 | ||||
| Liberal | Julian Kinisky | 12,471 | 28.06 | −2.35 | ||||
| New Democratic | Robert Davidson | 5,352 | 12.04 | +0.53 | ||||
| Communist | Joe Hill | 120 | 0.27 | −0.01 | ||||
| Marxist–Leninist | Carol Arnold | 73 | 0.16 | −0.00 | ||||
| Total valid votes | 44,446 | 100.00 | ||||||
| 1974 Canadian federal election | ||||||||
|---|---|---|---|---|---|---|---|---|
| Party | Candidate | Votes | % | ±% | ||||
| Progressive Conservative | Doug Roche | 25,808 | 54.73 | +5.01 | ||||
| Liberal | B.C. Tanner | 14,337 | 30.40 | −0.32 | ||||
| New Democratic | Lila Fahlman | 5,426 | 11.51 | −5.30 | ||||
| Social Credit | Leif Oddson | 1,146 | 2.43 | +0.08 | ||||
| Libertarian | Robin Gillespie | 226 | 0.48 | |||||
| Communist | Harry Strynadka | 132 | 0.28 | |||||
| Marxist–Leninist | Peggy Askin | 79 | 0.17 | |||||
| Total valid votes | 47,154 | 100.00 | ||||||
| 1972 Canadian federal election | ||||||||
|---|---|---|---|---|---|---|---|---|
| Party | Candidate | Votes | % | ±% | ||||
| Progressive Conservative | Doug Roche | 26,908 | 49.72 | +11.89 | ||||
| Liberal | Hu Harries | 16,625 | 30.72 | −21.63 | ||||
| New Democratic | Howard Alfred Leeson | 9,098 | 16.81 | +9.99 | ||||
| Social Credit | Bill Pelch | 1,272 | 2.35 | |||||
| Independent | Elizabeth Rowley | 152 | 0.28 | |||||
| Independent | Peggy Morton | 63 | 0.12 | |||||
| Total valid votes | 54,118 | 100.00 | ||||||
| 1968 Canadian federal election | ||||||||
|---|---|---|---|---|---|---|---|---|
| Party | Candidate | Votes | % | ±% | ||||
| Liberal | Hu Harries | 21,074 | 52.35 | +22.59 | ||||
| Progressive Conservative | Terry Nugent | 15,228 | 37.83 | −0.22 | ||||
| New Democratic | Lawrence Radcliffe | 2,745 | 6.82 | −3.28 | ||||
| Independent | John R. Beatty | 1,206 | 3.00 | |||||
| Total valid votes | 40,253 | 100.00 | ||||||
| 1965 Canadian federal election | ||||||||
|---|---|---|---|---|---|---|---|---|
| Party | Candidate | Votes | % | ±% | ||||
| Progressive Conservative | Terry Nugent | 21,004 | 38.05 | +2.68 | ||||
| Liberal | Bill Sinclair | 16,431 | 29.77 | −0.57 | ||||
| Social Credit | Sigurd Sorenson | 11,696 | 21.19 | −4.74 | ||||
| New Democratic | Bill McLean | 5,572 | 10.09 | +1.73 | ||||
| Independent | Bill Stocks | 493 | 0.89 | |||||
| Total valid votes | 55,196 | 100.00 | ||||||
| 1963 Canadian federal election | ||||||||
|---|---|---|---|---|---|---|---|---|
| Party | Candidate | Votes | % | ±% | ||||
| Progressive Conservative | Terry Nugent | 18,880 | 35.37 | +0.98 | ||||
| Liberal | John Decore | 16,195 | 30.34 | +4.60 | ||||
| Social Credit | S.A. Sorenson | 13,841 | 25.93 | −3.22 | ||||
| New Democratic | Ian Sowton | 4,464 | 8.36 | −2.37 | ||||
| Total valid votes | 53,380 | 100.00 | ||||||
| 1962 Canadian federal election | ||||||||
|---|---|---|---|---|---|---|---|---|
| Party | Candidate | Votes | % | ±% | ||||
| Progressive Conservative | Terry Nugent | 16,030 | 34.39 | −26.93 | ||||
| Social Credit | S.A. Sorenson | 13,585 | 29.14 | +11.92 | ||||
| Liberal | Roy C. Marler | 11,996 | 25.74 | +8.64 | ||||
| New Democratic | Bill McLean | 5,001 | 10.73 | +6.37 | ||||
| Total valid votes | 46,612 | 100.00 | ||||||
| 1958 Canadian federal election | ||||||||
|---|---|---|---|---|---|---|---|---|
| Party | Candidate | Votes | % | ±% | ||||
| Progressive Conservative | Terry Nugent | 25,885 | 61.32 | +32.73 | ||||
| Social Credit | Sydney Herbert Thompson | 7,270 | 17.22 | −18.43 | ||||
| Liberal | Richmond Francis Hanna | 7,218 | 17.10 | −12.05 | ||||
| Co-operative Commonwealth | Arnold Holmes | 1,838 | 4.35 | −2.26 | ||||
| Total valid votes | 42,211 | 100.00 | ||||||
| 1957 Canadian federal election | ||||||||
|---|---|---|---|---|---|---|---|---|
| Party | Candidate | Votes | % | ±% | ||||
| Social Credit | Sydney Herbert Thompson | 13,124 | 35.65 | −1.05 | ||||
| Liberal | Richmond Francis Hanna | 10,731 | 29.15 | −8.18 | ||||
| Progressive Conservative | Terry Nugent | 10,525 | 28.59 | +11.76 | ||||
| Co-operative Commonwealth | Floyd Albin Johnson | 2,434 | 6.61 | −2.54 | ||||
| Total valid votes | 36,814 | 100.00 | ||||||
| 1953 Canadian federal election | ||||||||
|---|---|---|---|---|---|---|---|---|
| Party | Candidate | Votes | % | |||||
| Liberal | Richmond Francis Hanna | 8,901 | 37.33 | |||||
| Social Credit | Orvis A. Kennedy | 8,750 | 36.70 | |||||
| Progressive Conservative | Sidney Giffard Main | 4,012 | 16.83 | |||||
| Co-operative Commonwealth | Floyd Albin Johnson | 2,182 | 9.15 | |||||
| Total valid votes | 23,845 | 100.00 | ||||||
See also
Notes
- The Reform Party merged with the Canadian Alliance on 27 March 2000.
- The Canadian Alliance merged with the Progressive Conservatives to form the Conservative Party on 8 December 2003.
References
- "(Code 48018) Census Profile". 2011 census. Statistics Canada. 2012. Retrieved 2011-03-06.
- Statistics Canada: 2011
- Statistics Canada: 2011
- "History of Federal Ridings since 1867". Parliament of Canada. Retrieved 27 March 2011.
- http://www12.statcan.gc.ca/census-recensement/2011/dp-pd/prof/details/page.cfm?Lang=E&Geo1=FED2013&Code1=48019&Geo2=PR&Code2=48&Data=Count&SearchText=Edmonton%20Strathcona&SearchType=Begins&SearchPR=01&B1=All&Custom=&TABID=1
- http://www12.statcan.gc.ca/nhs-enm/2011/dp-pd/prof/details/page.cfm?Lang=E&Geo1=FED2013&Code1=48019&Data=Count&SearchText=Edmonton%20Strathcona&SearchType=Begins&SearchPR=01&A1=All&B1=All&Custom=&TABID=1
- "List of confirmed candidates". Elections Canada. Retrieved October 4, 2019.
- "Election Night Results". Elections Canada. Retrieved November 7, 2019.
- Pundits' Guide to Canadian Elections
External links
- 2006 Election Resource wiki
- Riding history for Edmonton Strathcona from the Library of Parliament
- Expenditures - 2008
- Expenditures - 2004
- Expenditures - 2000
- Expenditures - 1997
- Elections Canada
.png.webp)
.png.webp)