Yorkton—Melville
Yorkton—Melville is a federal electoral district in Saskatchewan, Canada, that has been represented in the House of Commons of Canada since 1968.
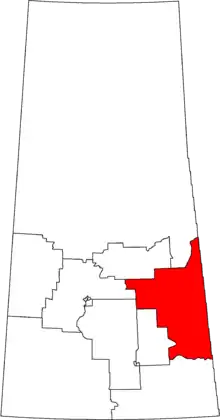 Yorkton—Melville in relation to other Saskatchewan federal electoral districts as of the 2013 Representation Order. | |||
| Coordinates: | 51.929°N 102.751°W | ||
| Federal electoral district | |||
| Legislature | House of Commons | ||
| MP |
Conservative | ||
| District created | 1966 | ||
| First contested | 1968 | ||
| Last contested | 2015 | ||
| District webpage | profile, map | ||
| Demographics | |||
| Population (2011)[1] | 71,270 | ||
| Electors (2015) | 53,446 | ||
| Area (km²)[2] | 43,272 | ||
| Pop. density (per km²) | 1.6 | ||
| Census subdivision(s) | Yorkton, Melville, Esterhazy, Canora, Tisdale, Hudson Bay | ||
Geography
The district is in east-central Saskatchewan.
History
The electoral district was created in 1966 from Yorkton, Melville and Mackenzie ridings.
In 2006, 30.2% of the population of the Yorkton—Melville constituency were of Ukrainian ethnic origin, the highest such percentage in Canada.[3] Also during the 2006 election, the Yorkton—Melville riding had the highest percentage of eligible voters over the age of 65, and highest average age of all the then-308 federal electoral districts.
This riding lost a fraction of territory to Regina—Qu'Appelle and gained territory from Saskatoon—Humboldt and a fraction from Desnethé—Missinippi—Churchill River during the 2012 electoral redistribution.
Members of Parliament
| Parliament | Years | Member | Party | |
|---|---|---|---|---|
| Yorkton—Melville Riding created from Yorkton, Melville and Mackenzie |
||||
| 28th | 1968–1972 | Lorne Nystrom | New Democratic | |
| 29th | 1972–1974 | |||
| 30th | 1974–1979 | |||
| 31st | 1979–1980 | |||
| 32nd | 1980–1984 | |||
| 33rd | 1984–1988 | |||
| 34th | 1988–1993 | |||
| 35th | 1993–1997 | Garry Breitkreuz | Reform | |
| 36th | 1997–2000 | |||
| 2000–2000 | Alliance | |||
| 37th | 2000–2003 | |||
| 2003–2004 | Conservative | |||
| 38th | 2004–2006 | |||
| 39th | 2006–2008 | |||
| 40th | 2008–2011 | |||
| 41st | 2011–2015 | |||
| 42nd | 2015–2019 | Cathay Wagantall | ||
| 43rd | 2019–present | |||
Election results
| 2019 Canadian federal election | ||||||||
|---|---|---|---|---|---|---|---|---|
| Party | Candidate | Votes | % | ±% | Expenditures | |||
| Conservative | Cathay Wagantall | 29,523 | 76.2 | +17.00 | $47,858.75 | |||
| New Democratic | Carter Antoine | 4,747 | 12.2 | -8.00 | $224.73 | |||
| Liberal | Connor Moen | 2,488 | 6.4 | -11.40 | none listed | |||
| Green | Stacey Wiebe | 1,070 | 2.8 | 0.00 | $386.96 | |||
| People's | Ryan Schultz | 941 | 2.4 | – | none listed | |||
| Total valid votes/Expense limit | 38,769 | 100.0 | – | |||||
| Total rejected ballots | 287 | – | – | |||||
| Turnout | 39,056 | 74.0 | – | |||||
| Eligible voters | 52,768 | |||||||
| Conservative hold | Swing | +12.50 | ||||||
| Source: Elections Canada[4][5] | ||||||||
| 2015 Canadian federal election | ||||||||
|---|---|---|---|---|---|---|---|---|
| Party | Candidate | Votes | % | ±% | Expenditures | |||
| Conservative | Cathay Wagantall | 21,683 | 59.22 | -9.66 | $57,632.77 | |||
| New Democratic | Doug Ottenbreit | 7,396 | 20.20 | -1.76 | $21,043.83 | |||
| Liberal | Brooke Taylor Malinoski | 6,504 | 17.76 | +11.15 | $3,627.04 | |||
| Green | Elaine Marie Hughes | 1,030 | 2.81 | +0.43 | $130.31 | |||
| Total valid votes/Expense limit | 36,613 | 100.0 | $229,969.51 | |||||
| Total rejected ballots | 95 | – | – | |||||
| Turnout | 36,708 | 68.36 | +4.96 | |||||
| Eligible voters | 53,694 | |||||||
| Conservative hold | Swing | -3.95 | ||||||
| Source: Elections Canada[6][7] | ||||||||
| 2011 federal election redistributed results[8] | |||
|---|---|---|---|
| Party | Vote | % | |
| Conservative | 23,607 | 68.88 | |
| New Democratic | 7,526 | 21.96 | |
| Liberal | 2,266 | 6.61 | |
| Green | 817 | 2.38 | |
| Independent | 58 | 0.17 | |
| 2011 Canadian federal election | ||||||||
|---|---|---|---|---|---|---|---|---|
| Party | Candidate | Votes | % | ±% | Expenditures | |||
| Conservative | Garry Breitkreuz | 21,906 | 68.9 | +0.9 | $68,801 | |||
| New Democratic | Doug Ottenbreit | 6,931 | 21.8 | +1.0 | $13,345 | |||
| Liberal | Kash Andreychuk | 2,167 | 6.8 | +1.4 | $40,387 | |||
| Green | Elaine Hughes | 774 | 2.4 | -3.3 | $540 | |||
| Total valid votes/Expense limit | 31,778 | 100.0 | $92,190 | |||||
| Total rejected ballots | 90 | 0.3 | -0.1 | |||||
| Turnout | 31,868 | 63.4 | +6 | |||||
| Eligible voters | 50,254 | – | – | |||||
| Conservative hold | Swing | -0.05 | ||||||
| 2008 Canadian federal election | ||||||||
|---|---|---|---|---|---|---|---|---|
| Party | Candidate | Votes | % | ±% | Expenditures | |||
| Conservative | Garry Breitkreuz | 19,824 | 68.0 | +4.6 | $65,139 | |||
| New Democratic | Doug Ottenbreit | 6,076 | 20.8 | +2.0 | $12,454 | |||
| Green | Jen Antony | 1,664 | 5.7 | +2.9 | $3,767 | |||
| Liberal | Bryan H. Bell | 1,578 | 5.4 | -8.5 | – | |||
| Total valid votes/Expense limit | 29,142 | 100.0 | $89,452 | |||||
| Total rejected ballots | 107 | 0.4 | +0.2 | |||||
| Turnout | 29,249 | 57 | -7 | |||||
| Conservative hold | Swing | +1.3 | ||||||
| 2006 Canadian federal election | ||||||||
|---|---|---|---|---|---|---|---|---|
| Party | Candidate | Votes | % | ±% | Expenditures | |||
| Conservative | Garry Breitkreuz | 20,736 | 63.5 | +0.6 | $55,627 | |||
| New Democratic | Jason Dennison | 6,165 | 18.9 | +4.1 | $19,488 | |||
| Liberal | Mervin Cushman | 4,558 | 14.0 | -0.8 | $18,223 | |||
| Green | Keith Neu | 923 | 2.8 | +1.2 | $641 | |||
| Independent | Carl Barabonoff | 287 | 0.9 | – | $739 | |||
| Total valid votes | 32,669 | 100.0 | – | |||||
| Total rejected ballots | 80 | 0.2 | -0.1 | |||||
| Turnout | 32,749 | 64.3 | +4.1 | |||||
| Conservative hold | Swing | -1.75 | ||||||
| 2004 Canadian federal election | ||||||||
|---|---|---|---|---|---|---|---|---|
| Party | Candidate | Votes | % | ±% | Expenditures | |||
| Conservative | Garry Breitkreuz | 19,940 | 62.9 | -5.0 | $61,866 | |||
| New Democratic | Don Olson | 5,890 | 18.6 | +2.8 | $18,736 | |||
| Liberal | Ted Quewezance | 4,697 | 14.8 | -1.4 | $32,905 | |||
| Green | Ralph Pilchner | 630 | 1.98 | +2.0 | – | |||
| Independent | David Sawkiw | 524 | 1.7 | – | $6,330 | |||
| Total valid votes | 31,681 | 100.0 | – | |||||
| Total rejected ballots | 113 | 0.4 | 0.0 | |||||
| Turnout | 31,794 | 60.2 | -3.4 | |||||
| Conservative hold | Swing | -3.9 | ||||||
Note: Conservative vote is compared to the total of the Canadian Alliance vote and Progressive Conservative vote in 2000 election.
| 2000 Canadian federal election | ||||||||
|---|---|---|---|---|---|---|---|---|
| Party | Candidate | Votes | % | ±% | Expenditures | |||
| Alliance | Garry Breitkreuz* | 19,978 | 63.0 | +12.9 | $52,574 | |||
| Liberal | Ken Pilon | 5,153 | 16.2 | -2.6 | $24,027 | |||
| New Democratic | Peter Champagne | 5,007 | 15.8 | -9.2 | $9,235 | |||
| Progressive Conservative | Brent Haas | 1,583 | 5.0 | -1.1 | $543 | |||
| Total valid votes | 31,721 | 100.0 | – | |||||
| Total rejected ballots | 103 | 0.3 | 0.0 | |||||
| Turnout | 31,824 | 63.6 | -3.3 | |||||
| Reform hold | Swing | +7.75 | ||||||
Note: Canadian Alliance vote is compared to the Reform vote in 1997 election.
| 1997 Canadian federal election | ||||||||
|---|---|---|---|---|---|---|---|---|
| Party | Candidate | Votes | % | ±% | Expenditures | |||
| Reform | Garry Breitkreuz* | 17,216 | 50.1 | +17.4 | $53,836 | |||
| New Democratic | Evan Carlson | 8,583 | 25.0 | -4.4 | $43,899 | |||
| Liberal | Lloyd Sandercock | 6,481 | 18.9 | -10.6 | $39,999 | |||
| Progressive Conservative | Ivan Daunt | 2,101 | 6.1 | -2.6 | $6,357 | |||
| Total valid votes | 34,381 | 100.0 | – | |||||
| Total rejected ballots | 116 | 0.3 | ||||||
| Turnout | 34,497 | 66.9 | – | |||||
| Reform hold | Swing | +10.90 | ||||||
| 1993 Canadian federal election | ||||||||
|---|---|---|---|---|---|---|---|---|
| Party | Candidate | Votes | % | ±% | ||||
| Reform | Garry Breitkreuz | 10,605 | 32.7 | -1.9 | ||||
| Liberal | Jim Walters | 9,531 | 29.4 | +15.8 | ||||
| New Democratic | Lorne Nystrom* | 9,487 | 29.2 | -21.9 | ||||
| Progressive Conservative | Bob Reitenbach | 2,825 | 8.7 | -25.9 | ||||
| Total valid votes | 32,448 | 100.0 | ||||||
| Reform gain from New Democratic | Swing | -8.85 | ||||||
* Denotes incumbent.
| 1988 Canadian federal election | ||||||||
|---|---|---|---|---|---|---|---|---|
| Party | Candidate | Votes | % | ±% | ||||
| New Democratic | Lorne Nystrom* | 18,523 | 51.1 | -0.2 | ||||
| Progressive Conservative | Virginia Battiste | 12,543 | 34.6 | +1.2 | ||||
| Liberal | J. Robert Autumn | 5,149 | 14.2 | +0.1 | ||||
| Total valid votes | 36,215 | 100.0 | ||||||
| 1984 Canadian federal election | ||||||||
|---|---|---|---|---|---|---|---|---|
| Party | Candidate | Votes | % | ±% | ||||
| New Democratic | Lorne Nystrom* | 18,116 | 51.3 | +5.6 | ||||
| Progressive Conservative | Ken Wasylysen | 11,800 | 33.4 | -3.9 | ||||
| Liberal | Arliss Dellow | 4,996 | 14.1 | -2.8 | ||||
| Confederation of Regions | Bill Kruczko | 400 | 1.1 | – | ||||
| Total valid votes | 35,312 | 100.0 | ||||||
| 1980 Canadian federal election | ||||||||
|---|---|---|---|---|---|---|---|---|
| Party | Candidate | Votes | % | ±% | ||||
| New Democratic | Lorne Nystrom* | 15,240 | 45.7 | -1.8 | ||||
| Progressive Conservative | Ben Hudye | 12,450 | 37.3 | +4.9 | ||||
| Liberal | Gordon Hollinger | 5,664 | 17.0 | +1.3 | ||||
| Total valid votes | 33,354 | 100.0 | ||||||
| 1979 Canadian federal election | ||||||||
|---|---|---|---|---|---|---|---|---|
| Party | Candidate | Votes | % | ±% | ||||
| New Democratic | Lorne Nystrom | 16,677 | 47.5 | +1.9 | ||||
| Progressive Conservative | John Miller | 11,381 | 32.4 | +10.7 | ||||
| Liberal | Phil Kotyk | 5,501 | 15.7 | -15.4 | ||||
| Independent | Ben Hudye | 1,566 | 4.5 | – | ||||
| Total valid votes | 35,125 | 100.0 | ||||||
| 1974 Canadian federal election | ||||||||
|---|---|---|---|---|---|---|---|---|
| Party | Candidate | Votes | % | ±% | ||||
| New Democratic | Lorne Nystrom | 14,586 | 45.6 | -2.1 | ||||
| Liberal | Stan Kyba | 9,946 | 31.1 | +2.5 | ||||
| Progressive Conservative | Marvin Wentzell | 6,963 | 21.8 | -0.7 | ||||
| Social Credit | Harry Hoedel | 338 | 1.1 | -0.2 | ||||
| Communist | George Shlakoff | 179 | 0.6 | – | ||||
| Total valid votes | 32,012 | 100.0 | ||||||
| 1972 Canadian federal election | ||||||||
|---|---|---|---|---|---|---|---|---|
| Party | Candidate | Votes | % | ±% | ||||
| New Democratic | Lorne Nystrom | 15,998 | 47.7 | +8.8 | ||||
| Liberal | Stephanie Potoski | 9,574 | 28.5 | -1.1 | ||||
| Progressive Conservative | Don Armour | 7,542 | 22.5 | -9.0 | ||||
| Social Credit | Harry Hoedel | 425 | 1.3 | – | ||||
| Total valid votes | 33,539 | 100.0 | ||||||
| 1968 Canadian federal election | ||||||||
|---|---|---|---|---|---|---|---|---|
| Party | Candidate | Votes | % | |||||
| New Democratic | Lorne Nystrom | 13,212 | 38.9 | |||||
| Progressive Conservative | James N. Ormiston | 10,699 | 31.5 | |||||
| Liberal | Peter J. Konkin | 10,068 | 29.6 | |||||
| Total valid votes | 33,979 | 100.0 | ||||||
References
- "(Code 47014) Census Profile". 2011 census. Statistics Canada. 2012. Retrieved 2011-03-03.
- Riding history for Yorkton—Melville (1966– ) from the Library of Parliament
- Expenditures - 2008
- Expenditures - 2004
- Expenditures - 2000
- Expenditures - 1997
Notes
- Statistics Canada: 2012
- Statistics Canada: 2012
- "2Profile of Ethnic Origin and Visible Minorities for Canada, Provinces, Territories and Federal Electoral Districts (2003 Representation Order), 2006 Census". 2.statcan.gc.ca. Retrieved 2012-12-02.
- "List of confirmed candidates". Elections Canada. Retrieved October 4, 2019.
- "Election Night Results". Elections Canada. Retrieved November 8, 2019.
- Elections Canada – Confirmed candidates for Yorkton—Melville, 30 September 2015
- Elections Canada – Preliminary Election Expenses Limits for Candidates
- Pundits' Guide to Canadian Elections
.png.webp)