Champaign County, Ohio
Champaign County is a county located in the U.S. state of Ohio. As of the 2010 census, the population was 40,097.[2] Its county seat is Urbana.[3] The county takes its name from the French word for "open level country".[4] Champaign County comprises the Urbana, OH Micropolitan Statistical Area, which is also included in the Dayton–Springfield–Sidney, OH Combined Statistical Area.
Champaign County | |
|---|---|
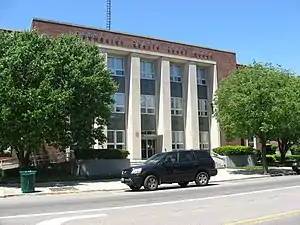 Champaign County Courthouse in Urbana | |
 Seal | |
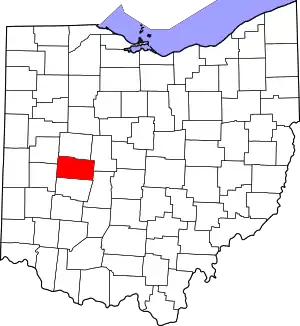 Location within the U.S. state of Ohio | |
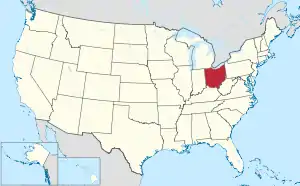 Ohio's location within the U.S. | |
| Coordinates: 40°08′N 83°46′W | |
| Country | |
| State | |
| Founded | March 1, 1805[1] |
| Named for | "plain" in French |
| Seat | Urbana |
| Largest city | Urbana |
| Area | |
| • Total | 430 sq mi (1,100 km2) |
| • Land | 429 sq mi (1,110 km2) |
| • Water | 1.2 sq mi (3 km2) 0.3%% |
| Population | |
| • Estimate (2019) | 38,885 |
| • Density | 94/sq mi (36/km2) |
| Time zone | UTC−5 (Eastern) |
| • Summer (DST) | UTC−4 (EDT) |
| Congressional district | 4th |
| Website | www |
Geography
According to the U.S. Census Bureau, the county has a total area of 430 square miles (1,100 km2), of which 429 square miles (1,110 km2) is land and 1.2 square miles (3.1 km2) (0.3%) is water.[5]
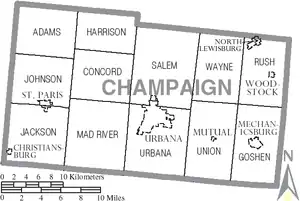
Adjacent counties
- Logan County (north)
- Union County (northeast)
- Madison County (southeast)
- Clark County (south)
- Miami County (southwest)
- Shelby County (northwest)
Demographics
| Historical population | |||
|---|---|---|---|
| Census | Pop. | %± | |
| 1810 | 6,303 | — | |
| 1820 | 8,479 | 34.5% | |
| 1830 | 12,131 | 43.1% | |
| 1840 | 16,721 | 37.8% | |
| 1850 | 19,782 | 18.3% | |
| 1860 | 22,698 | 14.7% | |
| 1870 | 24,188 | 6.6% | |
| 1880 | 27,817 | 15.0% | |
| 1890 | 26,980 | −3.0% | |
| 1900 | 26,642 | −1.3% | |
| 1910 | 26,351 | −1.1% | |
| 1920 | 25,071 | −4.9% | |
| 1930 | 24,103 | −3.9% | |
| 1940 | 25,258 | 4.8% | |
| 1950 | 26,793 | 6.1% | |
| 1960 | 29,714 | 10.9% | |
| 1970 | 30,491 | 2.6% | |
| 1980 | 33,649 | 10.4% | |
| 1990 | 36,019 | 7.0% | |
| 2000 | 38,890 | 8.0% | |
| 2010 | 40,097 | 3.1% | |
| 2019 (est.) | 38,885 | [6] | −3.0% |
| U.S. Decennial Census[7] 1790-1960[8] 1900-1990[9] 1990-2000[10] 2010-2019[2] | |||
2000 census
As of the census[11] of 2000, there were 38,890 people, 14,952 households, and 10,870 families living in the county. The population density was 91 people per square mile (35/km2). There were 15,890 housing units at an average density of 37 per square mile (14/km2). The racial makeup of the county was 95.73% White, 2.30% Black or African American, 0.31% Native American, 0.25% Asian, 0.02% Pacific Islander, 0.31% from other races, and 1.08% from two or more races. 0.69% of the population were Hispanic or Latino of any race.
There were 14,952 households, out of which 34.00% had children under the age of 18 living with them, 59.70% were married couples living together, 9.20% had a female householder with no husband present, and 27.30% were non-families. 23.50% of all households were made up of individuals, and 9.40% had someone living alone who was 65 years of age or older. The average household size was 2.56 and the average family size was 3.01.
In the county, the population was spread out, with 26.20% under the age of 18, 7.90% from 18 to 24, 28.70% from 25 to 44, 24.60% from 45 to 64, and 12.60% who were 65 years of age or older. The median age was 37 years. For every 100 females there were 95.90 males. For every 100 females age 18 and over, there were 92.90 males.
The median income for a household in the county was $43,139, and the median income for a family was $50,430. Males had a median income of $38,265 versus $26,241 for females. The per capita income for the county was $19,542. About 5.10% of families and 7.60% of the population were below the poverty line, including 9.90% of those under age 18 and 7.60% of those age 65 or over.
2010 census
As of the 2010 United States Census, there were 40,097 people, 15,329 households, and 10,925 families living in the county.[12] The population density was 93.5 inhabitants per square mile (36.1/km2). There were 16,755 housing units at an average density of 39.1 per square mile (15.1/km2).[13] The racial makeup of the county was 94.7% white, 2.2% black or African American, 0.4% Asian, 0.4% American Indian, 0.4% from other races, and 1.9% from two or more races. Those of Hispanic or Latino origin made up 1.1% of the population.[12] In terms of ancestry, 27.6% were German, 14.9% were Irish, 14.3% were American, and 11.8% were English.[14]
Of the 15,329 households, 33.7% had children under the age of 18 living with them, 55.9% were married couples living together, 10.2% had a female householder with no husband present, 28.7% were non-families, and 23.9% of all households were made up of individuals. The average household size was 2.56 and the average family size was 3.02. The median age was 39.7 years.[12]
The median income for a household in the county was $49,246 and the median income for a family was $58,433. Males had a median income of $44,920 versus $32,847 for females. The per capita income for the county was $23,438. About 10.0% of families and 12.9% of the population were below the poverty line, including 18.4% of those under age 18 and 6.3% of those age 65 or over.[15]
Politics
Champaign County is a Republican stronghold county in presidential elections, it has only voted Democratic three times since 1856.
| Year | Republican | Democratic | Third parties |
|---|---|---|---|
| 2020 | 72.9% 14,589 | 25.3% 5,062 | 1.8% 352 |
| 2016 | 69.2% 12,631 | 25.2% 4,594 | 5.6% 1,018 |
| 2012 | 59.8% 11,045 | 38.1% 7,044 | 2.1% 379 |
| 2008 | 58.8% 11,141 | 39.0% 7,385 | 2.2% 410 |
| 2004 | 62.4% 11,718 | 37.1% 6,968 | 0.5% 90 |
| 2000 | 58.8% 9,220 | 38.0% 5,955 | 3.2% 505 |
| 1996 | 44.1% 6,568 | 40.2% 5,990 | 15.7% 2,335 |
| 1992 | 43.1% 7,004 | 32.0% 5,201 | 24.9% 4,047 |
| 1988 | 67.3% 8,995 | 32.0% 4,272 | 0.8% 101 |
| 1984 | 73.1% 9,935 | 26.1% 3,544 | 0.9% 121 |
| 1980 | 60.2% 7,356 | 33.6% 4,109 | 6.2% 760 |
| 1976 | 56.7% 6,526 | 41.3% 4,748 | 2.0% 228 |
| 1972 | 69.5% 8,756 | 28.8% 3,626 | 1.8% 221 |
| 1968 | 53.8% 6,863 | 33.4% 4,264 | 12.7% 1,623 |
| 1964 | 43.9% 5,588 | 56.1% 7,138 | |
| 1960 | 66.7% 9,141 | 33.3% 4,560 | |
| 1956 | 69.5% 8,767 | 30.5% 3,851 | |
| 1952 | 66.1% 8,880 | 33.9% 4,563 | |
| 1948 | 58.5% 6,492 | 41.3% 4,585 | 0.2% 23 |
| 1944 | 61.9% 7,795 | 38.1% 4,800 | |
| 1940 | 56.9% 7,841 | 43.1% 5,929 | |
| 1936 | 50.1% 6,872 | 47.3% 6,485 | 2.6% 362 |
| 1932 | 48.7% 6,191 | 50.3% 6,396 | 1.0% 125 |
| 1928 | 69.5% 7,651 | 30.0% 3,296 | 0.5% 59 |
| 1924 | 60.3% 6,181 | 34.9% 3,575 | 4.8% 489 |
| 1920 | 60.1% 7,285 | 39.4% 4,775 | 0.6% 68 |
| 1916 | 51.8% 3,695 | 46.8% 3,338 | 1.4% 100 |
| 1912 | 35.1% 2,392 | 40.5% 2,763 | 24.4% 1,663 |
| 1908 | 55.7% 4,153 | 42.4% 3,160 | 1.9% 144 |
| 1904 | 62.0% 4,192 | 34.5% 2,336 | 3.5% 235 |
| 1900 | 56.3% 4,306 | 41.7% 3,192 | 2.0% 151 |
| 1896 | 55.1% 4,314 | 43.9% 3,432 | 1.0% 79 |
| 1892 | 54.0% 3,708 | 40.6% 2,791 | 5.4% 372 |
| 1888 | 53.6% 3,933 | 41.5% 3,049 | 4.9% 359 |
| 1884 | 56.4% 4,157 | 41.8% 3,078 | 1.8% 134 |
| 1880 | 58.4% 4,100 | 40.8% 2,865 | 0.8% 58 |
| 1876 | 55.0% 3,528 | 44.8% 2,872 | 0.3% 16 |
| 1872 | 58.1% 3,059 | 41.5% 2,185 | 0.4% 23 |
| 1868 | 58.0% 2,954 | 42.0% 2,138 | |
| 1864 | 61.1% 2,766 | 38.9% 1,764 | |
| 1860 | 52.1% 2,325 | 40.6% 1,810 | 7.3% 326 |
| 1856 | 49.6% 1,995 | 42.5% 1,711 | 8.0% 320 |
Communities
City
- Urbana (county seat)
Census-designated place
Notable people
- Lawrence Borst, veterinarian and Indiana state legislator
- John Isaiah Caldwell, lawyer
- Jim Jordan, U.S. Representative for Ohio's 4th congressional district
- Michael Kent, comedian and magician
See also
- Kiser Lake State Park, located in Johnson Township
- National Register of Historic Places listings in Champaign County, Ohio
References
- "Ohio County Profiles: Champaign County" (PDF). Ohio Department of Development. Archived from the original (PDF) on June 21, 2007. Retrieved April 28, 2007.
- "State & County QuickFacts". United States Census Bureau. Retrieved April 19, 2020.
- "Find a County". National Association of Counties. Archived from the original on May 31, 2011. Retrieved June 7, 2011.
- "Agriculture & Natural Resources in Champaign County". Ohio State University Extension. Archived from the original on July 16, 2011. Retrieved September 23, 2010.
- "2010 Census Gazetteer Files". United States Census Bureau. August 22, 2012. Archived from the original on May 4, 2014. Retrieved February 7, 2015.
- "Population and Housing Unit Estimates". Retrieved March 26, 2020.
- "U.S. Decennial Census". United States Census Bureau. Retrieved February 7, 2015.
- "Historical Census Browser". University of Virginia Library. Retrieved February 7, 2015.
- Forstall, Richard L., ed. (March 27, 1995). "Population of Counties by Decennial Census: 1900 to 1990". United States Census Bureau. Retrieved February 7, 2015.
- "Census 2000 PHC-T-4. Ranking Tables for Counties: 1990 and 2000" (PDF). United States Census Bureau. April 2, 2001. Retrieved February 7, 2015.
- "U.S. Census website". United States Census Bureau. Retrieved January 31, 2008.
- "DP-1 Profile of General Population and Housing Characteristics: 2010 Demographic Profile Data". United States Census Bureau. Archived from the original on February 13, 2020. Retrieved December 27, 2015.
- "Population, Housing Units, Area, and Density: 2010 - County". United States Census Bureau. Archived from the original on February 13, 2020. Retrieved December 27, 2015.
- "DP02 SELECTED SOCIAL CHARACTERISTICS IN THE UNITED STATES – 2006-2010 American Community Survey 5-Year Estimates". United States Census Bureau. Archived from the original on February 13, 2020. Retrieved December 27, 2015.
- "DP03 SELECTED ECONOMIC CHARACTERISTICS – 2006-2010 American Community Survey 5-Year Estimates". United States Census Bureau. Archived from the original on February 13, 2020. Retrieved December 27, 2015.
- Leip, David. "Dave Leip's Atlas of U.S. Presidential Elections". uselectionatlas.org. Retrieved May 1, 2018.
External links
Places adjacent to Champaign County, Ohio | ||||||||||
|---|---|---|---|---|---|---|---|---|---|---|
| ||||||||||
Municipalities and communities of Champaign County, Ohio, United States | ||
|---|---|---|
| City | Map of Ohio highlighting Champaign County | |
| Villages | ||
| Townships | ||
| CDP | ||
| Unincorporated communities | ||
| ||
.svg.png.webp)
| Authority control |
|---|