Mahoning County, Ohio
Mahoning County is a county in the U.S. state of Ohio. As of the 2010 census, the population was 238,823.[1] Its county seat is Youngstown.[2] The county is named for a Lenape word meaning "at the licks" or "there is a lick", referring to the salt licks in the area.[3] Mahoning County was formed on March 1, 1846; the 83rd county in Ohio.[4] Until 1846, the area that is now Mahoning County was part of Trumbull and Columbiana counties, when the counties in the area were redefined and Mahoning County emerged as a new county.[5]
Mahoning County | |
|---|---|
 Mahoning County Courthouse | |
.svg.png.webp) Seal | |
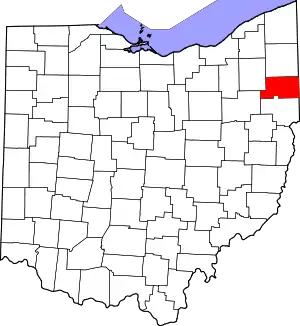 Location within the U.S. state of Ohio | |
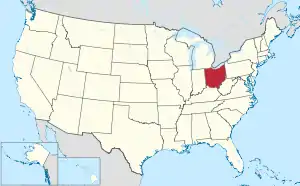 Ohio's location within the U.S. | |
| Coordinates: 41°01′N 80°46′W | |
| Country | |
| State | |
| Founded | 1 March 1846 |
| Named for | A Native American word for salt lick |
| Seat | Youngstown |
| Largest city | Youngstown |
| Area | |
| • Total | 425 sq mi (1,100 km2) |
| • Land | 412 sq mi (1,070 km2) |
| • Water | 14 sq mi (40 km2) 3.2%% |
| Population | |
| • Estimate (2019) | 228,683 |
| • Density | 580/sq mi (220/km2) |
| Time zone | UTC−5 (Eastern) |
| • Summer (DST) | UTC−4 (EDT) |
| Congressional districts | 6th, 13th |
| Website | www |
Mahoning County is part of the Youngstown-Warren-Boardman, OH-PA Metropolitan Statistical Area.
History
Prior to its formation of a county in 1846, Mahoning County was a destination for a family of Huguenot refugees in the early 1800s.[6]
Geography
According to the U.S. Census Bureau, the county has an area of 425 square miles (1,100 km2), of which 412 square miles (1,070 km2) is land and 14 square miles (36 km2) (3.2%) is water.[7]
Adjacent counties
- Trumbull County (north)
- Mercer County, Pennsylvania (northeast)
- Lawrence County, Pennsylvania (east)
- Columbiana County (south)
- Stark County (southwest)
- Portage County (northwest)
Demographics
| Historical population | |||
|---|---|---|---|
| Census | Pop. | %± | |
| 1850 | 23,735 | — | |
| 1860 | 25,894 | 9.1% | |
| 1870 | 31,001 | 19.7% | |
| 1880 | 42,871 | 38.3% | |
| 1890 | 55,979 | 30.6% | |
| 1900 | 70,134 | 25.3% | |
| 1910 | 116,151 | 65.6% | |
| 1920 | 186,310 | 60.4% | |
| 1930 | 236,142 | 26.7% | |
| 1940 | 240,251 | 1.7% | |
| 1950 | 257,629 | 7.2% | |
| 1960 | 300,480 | 16.6% | |
| 1970 | 303,424 | 1.0% | |
| 1980 | 289,487 | −4.6% | |
| 1990 | 264,806 | −8.5% | |
| 2000 | 257,555 | −2.7% | |
| 2010 | 238,823 | −7.3% | |
| 2019 (est.) | 228,683 | [8] | −4.2% |
| U.S. Decennial Census[9] 1790-1960[10] 1900-1990[11] 1990-2000[12] 2010-2019[1] | |||
2000 census
As of the census[13] of 2000, there were 257,555 people, 102,587 households, and 68,835 families living in the county. The population density was 620 people per square mile (239/km2). There were 111,762 housing units at an average density of 269 per square mile (104/km2). The racial makeup of the county was 81.04% White, 15.87% Black or African American, 0.17% Native American, 0.47% Asian, 0.02% Pacific Islander, 1.03% from other races, and 1.38% from two or more races. 2.97% of the population were Hispanic or Latino of any race.
93.1% spoke English, 2.6% Spanish, 1.0% Italian, and 0.5% Greek as their first language.[14]
There were 102,587 households, out of which 28.40% had children under the age of 18 living with them, 49.00% were married couples living together, 14.10% had a female householder with no husband present, and 32.90% were non-families. 29.10% of all households were made up of individuals, and 13.10% had someone living alone who was 65 years of age or older. The average household size was 2.44 and the average family size was 3.02.
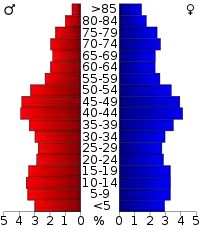
In the county, the population was spread out, with 23.70% under the age of 18, 8.40% from 18 to 24, 26.40% from 25 to 44, 23.70% from 45 to 64, and 17.80% who were 65 years of age or older. The median age was 40 years. For every 100 females there were 91.40 males. For every 100 females age 18 and over, there were 88.00 males.
The median income for a household in the county was $35,248, and the median income for a family was $44,185. Males had a median income of $36,313 versus $23,272 for females. The per capita income for the county was $18,818. About 9.60% of families and 12.50% of the population were below the poverty line, including 19.10% of those under age 18 and 8.70% of those age 65 or over.
2010 census
As of the 2010 census, there were 238,823 people, 98,712 households, and 62,676 families living in the county.[15] The population density was 580.2 inhabitants per square mile (224.0/km2). There were 111,833 housing units at an average density of 271.7 per square mile (104.9/km2).[16] The racial makeup of the county was 79.9% white, 15.7% black or African American, 0.7% Asian, 0.2% American Indian, 1.4% from other races, and 2.1% from two or more races. Those of Hispanic or Latino origin made up 4.7% of the population.[15] In terms of ancestry, 21.4% were German, 18.4% were Italian, 16.6% were Irish, 8.9% were English, and 4.2% were American.[17]
Of the 98,712 households, 27.9% had children under the age of 18 living with them, 43.7% were married couples living together, 15.0% had a female householder with no husband present, 36.5% were non-families, and 31.8% of all households were made up of individuals. The average household size was 2.34 and the average family size was 2.94. The median age was 42.9 years.[15]
The median income for a household in the county was $40,123 and the median income for a family was $52,489. Males had a median income of $44,516 versus $31,969 for females. The per capita income for the county was $22,824. About 12.6% of families and 16.6% of the population were below the poverty line, including 25.9% of those under age 18 and 10.0% of those age 65 or over.[18]
Politics
In contrast with many other counties in northeastern Ohio, Mahoning County is largely Democratic-leaning, voting for the Democratic presidential candidate in every election from 1972 until 2016. Between 1972 and 2012 voted Democratic by at least a margin of 17 percentage points for every election. In 2016, Hillary Clinton won the county over Donald Trump by 3.3 percent, the smallest margin since 1972; in 2012, Barack Obama carried the county over Mitt Romney by a solid 28.3 percent, however in 2020 Donald Trump flipped the county Republican for the first time since Richard Nixon did in his 1972 49 state landslide victory.
At the statewide level, Mahoning County generally votes Democratic as well. Since 1970, the county has only voted Republican twice at the gubernatorial level – in the landslide elections of 1994 and 2014.
| Year | Republican | Democratic | Third parties |
|---|---|---|---|
| 2020 | 50.3% 59,903 | 48.4% 57,641 | 1.3% 1,646 |
| 2016 | 46.2% 53,616 | 49.5% 57,381 | 4.3% 4,974 |
| 2012 | 35.1% 42,641 | 63.4% 77,059 | 1.6% 1,884 |
| 2008 | 35.5% 45,319 | 62.0% 79,173 | 2.5% 3,167 |
| 2004 | 36.7% 48,761 | 62.6% 83,194 | 0.7% 949 |
| 2000 | 35.5% 40,460 | 60.7% 69,212 | 3.9% 4,447 |
| 1996 | 26.6% 31,397 | 61.5% 72,716 | 11.9% 14,065 |
| 1992 | 24.8% 31,191 | 51.5% 64,731 | 23.7% 29,728 |
| 1988 | 36.4% 43,722 | 62.9% 75,524 | 0.7% 880 |
| 1984 | 40.7% 53,424 | 58.2% 76,514 | 1.1% 1,500 |
| 1980 | 40.1% 50,153 | 50.9% 63,677 | 9.1% 11,331 |
| 1976 | 37.0% 46,314 | 60.5% 75,837 | 2.5% 3,143 |
| 1972 | 49.7% 64,144 | 48.4% 62,428 | 2.0% 2,516 |
| 1968 | 34.8% 42,948 | 55.4% 68,433 | 9.9% 12,197 |
| 1964 | 27.1% 33,775 | 72.9% 90,934 | |
| 1960 | 38.7% 51,927 | 61.3% 82,143 | |
| 1956 | 52.0% 63,992 | 48.0% 59,126 | |
| 1952 | 44.0% 53,164 | 56.0% 67,722 | |
| 1948 | 36.9% 37,365 | 61.8% 62,468 | 1.3% 1,313 |
| 1944 | 33.4% 35,184 | 66.6% 70,102 | |
| 1940 | 32.9% 37,496 | 67.1% 76,441 | |
| 1936 | 27.3% 24,825 | 71.4% 64,886 | 1.3% 1,147 |
| 1932 | 52.4% 39,713 | 43.7% 33,139 | 4.0% 3,009 |
| 1928 | 63.8% 48,341 | 35.6% 26,928 | 0.6% 479 |
| 1924 | 68.1% 37,647 | 16.9% 9,335 | 15.0% 8,282 |
| 1920 | 63.9% 29,736 | 32.1% 14,941 | 4.1% 1,893 |
| 1916 | 44.6% 11,256 | 51.6% 13,013 | 3.8% 956 |
| 1912 | 28.2% 5,839 | 33.0% 6,838 | 38.8% 8,026[21] |
| 1908 | 51.2% 10,760 | 44.3% 9,312 | 4.5% 951 |
| 1904 | 60.0% 10,404 | 25.6% 4,436 | 14.5% 2,510 |
| 1900 | 53.6% 8,939 | 44.4% 7,402 | 2.1% 345 |
| 1896 | 55.3% 8,529 | 43.9% 6,772 | 0.9% 131 |
| 1892 | 45.5% 5,806 | 49.9% 6,358 | 4.6% 586 |
| 1888 | 51.3% 6,162 | 44.4% 5,337 | 4.3% 511 |
| 1884 | 55.6% 6,007 | 41.0% 4,432 | 3.4% 367 |
| 1880 | 53.3% 4,943 | 43.6% 4,044 | 3.0% 282 |
| 1876 | 48.5% 3,921 | 45.6% 3,691 | 5.9% 478 |
| 1872 | 59.1% 3,757 | 39.6% 2,518 | 1.2% 79 |
| 1868 | 55.1% 3,387 | 44.9% 2,757 | |
| 1864 | 55.7% 3,044 | 44.3% 2,420 | |
| 1860 | 57.5% 2,907 | 39.4% 1,990 | 3.1% 158 |
| 1856 | 54.2% 2,323 | 45.2% 1,937 | 0.6% 29 |
Education
Colleges and universities
Community, junior, and technical colleges
- Choffin Career and Technical Center
- Eastern Gateway Community College
- Mahoning County Career and Technical Center
Public school districts
- Alliance City School District
- Austintown Local School District
- Boardman Local School District
- Campbell City School District
- Canfield Local School District
- Columbiana Exempted Village School District
- Hubbard Exempted Village School District
- Jackson-Milton Local School District
- Leetonia Exempted Village School District
- Liberty Local School District
- Lowellville Local School District
- Poland Local School District
- Sebring Local School District
- South Range Local School District
- Springfield Local School District
- Struthers City School District
- Weathersfield Local School District
- West Branch Local School District
- Western Reserve Local School District
- Youngstown City School District
High schools
- Austintown Fitch High School
- Boardman High School
- Campbell Memorial High School
- Canfield High School
- Cardinal Mooney High School
- Chaney High School
- East High School
- Jackson-Milton High School
- Lowellville High School
- Mahoning County High School
- McKinley High School
- Poland Seminary High School
- South Range High School
- Springfield High School
- Struthers High School
- Ursuline High School
- Valley Christian School
- Valley STEM + ME2 Academy
- West Branch High School
- Western Reserve High School
Communities
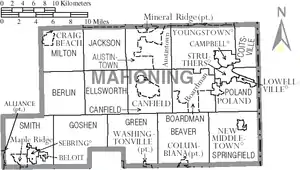
Cities
Census-designated places
Unincorporated communities
- Berlin Center
- Blanco
- Calla
- Coitsville Center
- East Lewistown
- Ellsworth
- Fredericksburg
- Garfield
- Greenford
- Hickory Corners
- Knaufville
- Locust Grove
- New Albany
- New Buffalo
- New Springfield
- North Benton
- North Jackson
- North Lima
- Ohltown
- Paradise
- Patmos
- Petersburg
- Poland Center
- Rosemont
- Snodes
- West Austintown
- Woodworth
Population ranking
The population ranking of the following table is based on the 2010 census of Mahoning County.[22]
* majority of municipality in Mahoning County
** minority of municipality in Mahoning County
† county seat
| Rank | City/Town/etc. | Population (2010 Census) | Municipal type |
|---|---|---|---|
| 1 | † Youngstown* | 66,982 | City |
| 2 | Boardman | 35,376 | CDP |
| 3 | Austintown | 29,677 | CDP |
| 4 | Alliance** | 22,322 | City |
| 5 | Salem** | 12,303 | City |
| 6 | Struthers | 10,713 | City |
| 7 | Campbell | 8,235 | City |
| 8 | Canfield | 7,515 | City |
| 9 | Columbiana** | 6,384 | City |
| 10 | Sebring | 4,420 | Village |
| 11 | Mineral Ridge** | 3,892 | CDP |
| 12 | Poland | 2,555 | Village |
| 13 | Lake Milton | 2,493 | CDP |
| 14 | New Middletown | 1,621 | Village |
| 15 | Craig Beach | 1,180 | Village |
| 16 | Lowellville | 1,155 | Village |
| 17 | Beloit | 978 | Village |
| 18 | Washingtonville** | 801 | Village |
| 19 | Maple Ridge | 761 | CDP |
| 20 | Damascus* | 443 | CDP |
References
- "State & County QuickFacts". United States Census Bureau. Archived from the original on June 6, 2011. Retrieved February 9, 2015.
- "Find a County". National Association of Counties. Retrieved June 7, 2011.
- Gannett, Henry (1905). The Origin of Certain Place Names in the United States. U.S. Government Printing Office. p. 196.
- "Ohio County Profiles: Mahoning County" (PDF). Ohio Department of Development. Archived from the original (PDF) on June 21, 2007. Retrieved April 28, 2007.
- History of Mahoning County Archived February 22, 2015, at the Wayback Machine, Official county website.
- Calvin, Claude (1945). The Calvin Families. University of Wisconsin. pp. 69–71.
- "2010 Census Gazetteer Files". United States Census Bureau. August 22, 2012. Archived from the original on May 4, 2014. Retrieved February 9, 2015.
- "Population and Housing Unit Estimates". Retrieved March 26, 2020.
- "U.S. Decennial Census". United States Census Bureau. Retrieved February 9, 2015.
- "Historical Census Browser". University of Virginia Library. Retrieved February 9, 2015.
- Forstall, Richard L., ed. (March 27, 1995). "Population of Counties by Decennial Census: 1900 to 1990". United States Census Bureau. Retrieved February 9, 2015.
- "Census 2000 PHC-T-4. Ranking Tables for Counties: 1990 and 2000" (PDF). United States Census Bureau. April 2, 2001. Retrieved February 9, 2015.
- "U.S. Census website". United States Census Bureau. Retrieved January 31, 2008.
- "Archived copy". Archived from the original on June 19, 2006. Retrieved August 10, 2013.CS1 maint: archived copy as title (link)
- "DP-1 Profile of General Population and Housing Characteristics: 2010 Demographic Profile Data". United States Census Bureau. Archived from the original on February 13, 2020. Retrieved December 27, 2015.
- "Population, Housing Units, Area, and Density: 2010 - County". United States Census Bureau. Archived from the original on February 13, 2020. Retrieved December 27, 2015.
- "DP02 SELECTED SOCIAL CHARACTERISTICS IN THE UNITED STATES – 2006-2010 American Community Survey 5-Year Estimates". United States Census Bureau. Archived from the original on February 13, 2020. Retrieved December 27, 2015.
- "DP03 SELECTED ECONOMIC CHARACTERISTICS – 2006-2010 American Community Survey 5-Year Estimates". United States Census Bureau. Archived from the original on February 13, 2020. Retrieved December 27, 2015.
- Leip, David. "Dave Leip's Atlas of U.S. Presidential Elections". uselectionatlas.org. Retrieved May 2, 2018.
- "Ohio Historical Election Results". Retrieved January 21, 2021.
- The leading "other" candidate, Progressive Theodore Roosevelt, received 5,226 votes, while Socialist candidate Eugene Debs received 2,422 votes, Prohibition candidate Eugene Chafin received 321 votes, and Socialist Labor candidate Arthur Reimer received 57 votes.
- "2010 U.S. Census website". United States Census Bureau. Retrieved February 13, 2016.
External links
| Wikimedia Commons has media related to Mahoning County, Ohio. |
Places adjacent to Mahoning County, Ohio | |
|---|---|
Municipalities and communities of Mahoning County, Ohio, United States | ||
|---|---|---|
| Cities | Map of Ohio highlighting Mahoning County | |
| Villages | ||
| Townships | ||
| CDPs | ||
| Unincorporated communities |
| |
| Footnotes | ‡This populated place also has portions in an adjacent county or counties | |
| ||
.svg.png.webp)
| Authority control |
|---|