Van Wert County, Ohio
Van Wert County is a county located in the U.S. state of Ohio. As of the 2010 census, the population was 28,744.[1] Its county seat is Van Wert.[2] The county was created in 1820 and later organized in 1837.[3] It is named for Isaac Van Wart, one of the captors of John André in the American Revolutionary War.[4]
Van Wert County | |
|---|---|
 Courthouse in Van Wert | |
 Seal | |
 Location within the U.S. state of Ohio | |
 Ohio's location within the U.S. | |
| Coordinates: 40°52′N 84°35′W | |
| Country | |
| State | |
| Founded | March 18, 1837 |
| Named for | Isaac Van Wart |
| Seat | Van Wert |
| Largest city | Van Wert |
| Area | |
| • Total | 410 sq mi (1,100 km2) |
| • Land | 409 sq mi (1,060 km2) |
| • Water | 1.3 sq mi (3 km2) 0.3%% |
| Population | |
| • Estimate (2019) | 28,275 |
| • Density | 70/sq mi (30/km2) |
| Time zone | UTC−5 (Eastern) |
| • Summer (DST) | UTC−4 (EDT) |
| Congressional district | 5th |
| Website | www |
Van Wert County comprises the Van Wert, OH Micropolitan Statistical Area, which is included within the Lima-Van Wert-Celina, OH Combined Statistical Area.
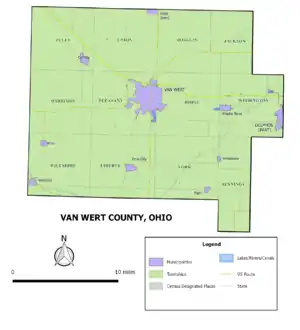
Geography
According to the U.S. Census Bureau, the county has a total area of 410 square miles (1,100 km2), of which 409 square miles (1,060 km2) is land and 1.3 square miles (3.4 km2) (0.3%) is water.[5]
Adjacent counties
- Paulding County (north)
- Putnam County (northeast)
- Allen County, Ohio (east)
- Auglaize County (southeast)
- Mercer County (south)
- Adams County, Indiana (southwest)
- Allen County, Indiana (northwest)
Demographics
| Historical population | |||
|---|---|---|---|
| Census | Pop. | %± | |
| 1830 | 49 | — | |
| 1840 | 1,577 | 3,118.4% | |
| 1850 | 4,793 | 203.9% | |
| 1860 | 10,238 | 113.6% | |
| 1870 | 15,823 | 54.6% | |
| 1880 | 23,028 | 45.5% | |
| 1890 | 29,671 | 28.8% | |
| 1900 | 30,394 | 2.4% | |
| 1910 | 29,119 | −4.2% | |
| 1920 | 28,210 | −3.1% | |
| 1930 | 26,273 | −6.9% | |
| 1940 | 26,759 | 1.8% | |
| 1950 | 26,971 | 0.8% | |
| 1960 | 28,840 | 6.9% | |
| 1970 | 29,194 | 1.2% | |
| 1980 | 30,458 | 4.3% | |
| 1990 | 30,464 | 0.0% | |
| 2000 | 29,659 | −2.6% | |
| 2010 | 28,744 | −3.1% | |
| 2019 (est.) | 28,275 | [6] | −1.6% |
| U.S. Decennial Census[7] 1790-1960[8] 1900-1990[9] 1990-2000[10] 2010-2019[1] | |||
2000 census
As of the census[11] of 2000, there were 29,659 people, 11,587 households, and 8,354 families living in the county. The population density was 72 people per square mile (28/km2). There were 12,363 housing units at an average density of 30 per square mile (12/km2). The racial makeup of the county was 97.43% White, 0.75% Black or African American, 0.11% Native American, 0.19% Asian, 0.75% from other races, and 0.77% from two or more races. 1.56% of the population were Hispanic or Latino of any race.
There were 11,587 households, out of which 32.90% had children under the age of 18 living with them, 60.20% were married couples living together, 8.50% had a female householder with no husband present, and 27.90% were non-families. 24.70% of all households were made up of individuals, and 11.40% had someone living alone who was 65 years of age or older. The average household size was 2.52 and the average family size was 3.00.
In the county, the population was spread out, with 26.00% under the age of 18, 8.30% from 18 to 24, 27.30% from 25 to 44, 22.90% from 45 to 64, and 15.50% who were 65 years of age or older. The median age was 38 years. For every 100 females there were 95.50 males. For every 100 females age 18 and over, there were 92.40 males.
The median income for a household in the county was $39,497, and the median income for a family was $46,503. Males had a median income of $32,377 versus $23,859 for females. The per capita income for the county was $18,293. About 4.20% of families and 5.50% of the population were below the poverty line, including 5.80% of those under age 18 and 4.00% of those age 65 or over.
2010 census
As of the 2010 United States Census, there were 28,744 people, 11,439 households, and 7,921 families living in the county.[12] The population density was 70.3 inhabitants per square mile (27.1/km2). There were 12,615 housing units at an average density of 30.8 per square mile (11.9/km2).[13] The racial makeup of the county was 96.6% white, 0.9% black or African American, 0.2% Asian, 0.1% American Indian, 0.8% from other races, and 1.4% from two or more races. Those of Hispanic or Latino origin made up 2.6% of the population.[12] In terms of ancestry, 43.6% were German, 12.4% were Irish, 11.5% were English, and 11.0% were American.[14]
Of the 11,439 households, 31.4% had children under the age of 18 living with them, 55.6% were married couples living together, 9.2% had a female householder with no husband present, 30.8% were non-families, and 26.6% of all households were made up of individuals. The average household size was 2.48 and the average family size was 2.98. The median age was 40.3 years.[12]
The median income for a household in the county was $44,415 and the median income for a family was $51,215. Males had a median income of $37,408 versus $28,692 for females. The per capita income for the county was $20,772. About 6.1% of families and 8.8% of the population were below the poverty line, including 12.7% of those under age 18 and 6.6% of those age 65 or over.[15]
Politics
Van Wert County is a stronghold Republican county in presidential elections. In 2020, Donald Trump nearly won 80% of the votes cast in the county.[16]
| Year | Republican | Democratic | Third parties |
|---|---|---|---|
| 2020 | 77.7% 11,650 | 20.5% 3,067 | 1.8% 277 |
| 2016 | 76.0% 10,469 | 19.6% 2,697 | 4.4% 604 |
| 2012 | 69.0% 9,585 | 29.0% 4,029 | 2.0% 284 |
| 2008 | 62.4% 9,168 | 35.2% 5,178 | 2.4% 355 |
| 2004 | 72.0% 10,678 | 27.6% 4,095 | 0.4% 54 |
| 2000 | 65.7% 8,679 | 31.8% 4,209 | 2.5% 331 |
| 1996 | 53.7% 6,999 | 34.2% 4,453 | 12.2% 1,589 |
| 1992 | 50.8% 7,227 | 26.9% 3,822 | 22.3% 3,168 |
| 1988 | 70.6% 9,410 | 28.9% 3,848 | 0.6% 78 |
| 1984 | 73.7% 9,570 | 25.7% 3,338 | 0.6% 80 |
| 1980 | 61.1% 7,866 | 31.6% 4,070 | 7.3% 936 |
| 1976 | 58.4% 8,344 | 39.8% 5,689 | 1.8% 251 |
| 1972 | 71.3% 9,545 | 27.2% 3,644 | 1.5% 202 |
| 1968 | 57.9% 7,835 | 32.2% 4,360 | 9.9% 1,332 |
| 1964 | 44.6% 6,194 | 55.4% 7,695 | |
| 1960 | 65.7% 9,666 | 34.3% 5,050 | |
| 1956 | 70.0% 9,834 | 30.0% 4,208 | |
| 1952 | 64.7% 9,355 | 35.3% 5,108 | |
| 1948 | 56.8% 6,785 | 43.0% 5,127 | 0.2% 24 |
| 1944 | 62.8% 8,529 | 37.2% 5,046 | |
| 1940 | 58.1% 8,656 | 42.0% 6,254 | |
| 1936 | 42.6% 6,275 | 52.6% 7,744 | 4.9% 714 |
| 1932 | 42.0% 5,918 | 56.7% 7,977 | 1.3% 183 |
| 1928 | 59.4% 7,540 | 40.1% 5,089 | 0.5% 67 |
| 1924 | 53.1% 6,206 | 37.0% 4,318 | 9.9% 1,154 |
| 1920 | 60.0% 7,495 | 39.2% 4,899 | 0.8% 99 |
| 1916 | 49.2% 3,802 | 48.6% 3,753 | 2.3% 174 |
| 1912 | 35.0% 2,490 | 46.3% 3,287 | 18.7% 1,329 |
| 1908 | 49.3% 3,809 | 49.0% 3,783 | 1.8% 137 |
| 1904 | 54.1% 4,120 | 43.7% 3,325 | 2.3% 173 |
| 1900 | 52.2% 4,006 | 46.7% 3,582 | 1.2% 90 |
| 1896 | 49.3% 3,957 | 49.6% 3,984 | 1.2% 92 |
| 1892 | 46.5% 3,373 | 50.1% 3,629 | 3.4% 248 |
| 1888 | 48.2% 3,411 | 48.0% 3,398 | 3.8% 270 |
| 1884 | 50.4% 3,052 | 48.6% 2,940 | 1.0% 60 |
| 1880 | 50.5% 2,634 | 49.3% 2,571 | 0.2% 10 |
| 1876 | 48.6% 2,290 | 51.2% 2,410 | 0.2% 8 |
| 1872 | 51.6% 1,805 | 48.2% 1,686 | 0.2% 6 |
| 1868 | 52.0% 1,547 | 48.0% 1,431 | |
| 1864 | 50.4% 1,214 | 49.6% 1,193 | |
| 1860 | 50.9% 1,015 | 48.1% 959 | 1.0% 19 |
| 1856 | 48.0% 758 | 50.0% 789 | 2.0% 32 |
Government
Van Wert County has a 3-member Board of County Commissioners that administer and oversee the various County departments, similar to all but 2 of the 88 Ohio counties. The elected commissioners serve four-year terms. Van Wert County's elected commissioners are: Thad Lichtensteiger, Stan Owens, and Todd Wolfrum.[19]
Communities
Unincorporated communities
- Abanaka
- Cavett
- Converse
- Dixon‡
- Dull
- Glenmore
- Hoaglin
- Jonestown
- Middlebury
- Monticello
- Richey
- Schumm
- Seamersville
- Wetsel
- Wolfcale
References
- "State & County QuickFacts". United States Census Bureau. Archived from the original on September 5, 2015. Retrieved February 11, 2015.
- "Find a County". National Association of Counties. Archived from the original on 2011-05-31. Retrieved 2011-06-07.
- "Ohio: Individual County Chronologies". Ohio Atlas of Historical County Boundaries. The Newberry Library. 2007. Retrieved February 14, 2015.
- "Van Wert County data". Ohio State University Extension Data Center. Retrieved 2007-04-28.
- "2010 Census Gazetteer Files". United States Census Bureau. August 22, 2012. Archived from the original on May 4, 2014. Retrieved February 11, 2015.
- "Population and Housing Unit Estimates". Retrieved March 26, 2020.
- "U.S. Decennial Census". United States Census Bureau. Retrieved February 11, 2015.
- "Historical Census Browser". University of Virginia Library. Retrieved February 11, 2015.
- Forstall, Richard L., ed. (March 27, 1995). "Population of Counties by Decennial Census: 1900 to 1990". United States Census Bureau. Retrieved February 11, 2015.
- "Census 2000 PHC-T-4. Ranking Tables for Counties: 1990 and 2000" (PDF). United States Census Bureau. April 2, 2001. Retrieved February 11, 2015.
- "U.S. Census website". United States Census Bureau. Retrieved 2008-01-31.
- "DP-1 Profile of General Population and Housing Characteristics: 2010 Demographic Profile Data". United States Census Bureau. Archived from the original on 2020-02-13. Retrieved 2015-12-27.
- "Population, Housing Units, Area, and Density: 2010 - County". United States Census Bureau. Archived from the original on 2020-02-13. Retrieved 2015-12-27.
- "DP02 SELECTED SOCIAL CHARACTERISTICS IN THE UNITED STATES – 2006-2010 American Community Survey 5-Year Estimates". United States Census Bureau. Archived from the original on 2020-02-13. Retrieved 2015-12-27.
- "DP03 SELECTED ECONOMIC CHARACTERISTICS – 2006-2010 American Community Survey 5-Year Estimates". United States Census Bureau. Archived from the original on 2020-02-13. Retrieved 2015-12-27.
- Cramer, Philissa (April 19, 2017). "Four things to know about Van Wert, the tiny Ohio school district where DeVos and Weingarten will form an uneasy duo". Chalkbeat. Retrieved December 19, 2019.
- Leip, David. "Dave Leip's Atlas of U.S. Presidential Elections". uselectionatlas.org. Retrieved 7 April 2018.
- "Ohio Historical Election Results". Retrieved January 21, 2021.
- "Meet the Van Wert County Commissioners". Van Wert County Ohio Homepage. Archived from the original on March 12, 2014. Retrieved March 12, 2014.
External links
Places adjacent to Van Wert County, Ohio | ||||||||||
|---|---|---|---|---|---|---|---|---|---|---|
| ||||||||||
Municipalities and communities of Van Wert County, Ohio, United States | ||
|---|---|---|
| Cities | Map of Ohio highlighting Van Wert County | |
| Villages | ||
| Townships | ||
| Unincorporated communities | ||
| Footnotes | ‡This populated place also has portions in an adjacent county or counties | |
| ||
.svg.png.webp)
| Authority control |
|---|