Montgomery County, Ohio
Montgomery County is located in the southwestern portion of the U.S. state of Ohio. As of the 2010 census, the population was 535,153,[2] making it the fifth-most populous county in Ohio.[3] The county seat is Dayton.[4] The county was named in honor of Richard Montgomery, an American Revolutionary War general killed in 1775 while attempting to capture Quebec City, Canada.[5]
Montgomery County | |
|---|---|
 Current Montgomery County Courthouse | |
 Seal | |
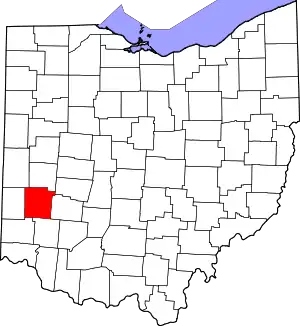 Location within the U.S. state of Ohio | |
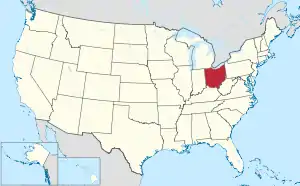 Ohio's location within the U.S. | |
| Coordinates: 39°45′N 84°17′W | |
| Country | |
| State | |
| Founded | May 1, 1803[1] |
| Named for | Richard Montgomery |
| Seat | Dayton |
| Largest city | Dayton |
| Area | |
| • Total | 464 sq mi (1,200 km2) |
| • Land | 462 sq mi (1,200 km2) |
| • Water | 2.8 sq mi (7 km2) 0.6%% |
| Population | |
| • Estimate (2019) | 531,687 |
| • Density | 1,159/sq mi (447/km2) |
| Time zone | UTC−5 (Eastern) |
| • Summer (DST) | UTC−4 (EDT) |
| Congressional district | 10th |
| Website | www |
Montgomery County is part of the Dayton, Ohio Metropolitan Statistical Area.
Geography
According to the U.S. Census Bureau, the county has a total area of 464 square miles (1,200 km2), of which 462 square miles (1,200 km2) is land and 2.8 square miles (7.3 km2) (0.6%) is water.[6]
Adjacent counties
- Miami County (north)
- Clark County (northeast)
- Greene County (east)
- Warren County (south)
- Butler County (southwest)
- Preble County (west)
- Darke County (northwest)
Major highways
National protected area
Demographics
| Historical population | |||
|---|---|---|---|
| Census | Pop. | %± | |
| 1810 | 7,722 | — | |
| 1820 | 15,999 | 107.2% | |
| 1830 | 24,362 | 52.3% | |
| 1840 | 31,938 | 31.1% | |
| 1850 | 38,218 | 19.7% | |
| 1860 | 52,230 | 36.7% | |
| 1870 | 64,006 | 22.5% | |
| 1880 | 78,550 | 22.7% | |
| 1890 | 100,552 | 28.0% | |
| 1900 | 130,146 | 29.4% | |
| 1910 | 163,763 | 25.8% | |
| 1920 | 209,532 | 27.9% | |
| 1930 | 273,481 | 30.5% | |
| 1940 | 295,480 | 8.0% | |
| 1950 | 398,441 | 34.8% | |
| 1960 | 527,080 | 32.3% | |
| 1970 | 606,148 | 15.0% | |
| 1980 | 571,697 | −5.7% | |
| 1990 | 573,809 | 0.4% | |
| 2000 | 559,062 | −2.6% | |
| 2010 | 535,153 | −4.3% | |
| 2019 (est.) | 531,687 | [7] | −0.6% |
| U.S. Decennial Census[8] 1790-1960[9] 1900-1990[10] 1990-2000[11] 2010-2019[2] | |||
2000 census
As of the census of 2000, there were 559,062 people, 229,229 households, and 146,935 families living in the county. The population density was 1,211 people per square mile (468/km2). There were 248,443 housing units at an average density of 538 per square mile (208/km2). The racial makeup of the county was 76.57% White, 19.86% Black or African American, 0.23% Native American, 1.31% Asian, 0.04% Pacific Islander, 0.49% from other races, and 1.51% from two or more races. 1.27% of the population were Hispanic or Latino of any race.
There were 229,229 households, out of which 29.60% had children under the age of 18 living with them, 46.30% were married couples living together, 13.80% had a female householder with no husband present, and 35.90% were non-families. 30.40% of all households were made up of individuals, and 10.10% had someone living alone who was 65 years of age or older. The average household size was 2.37, and the average family size was 2.96.
In the county, the population was spread out, with 24.70% under the age of 18, 9.70% from 18 to 24, 29.00% from 25 to 44, 22.90% from 45 to 64, and 13.70% who were 65 years of age or older. The median age was 36 years. For every 100 females, there were 92.30 males. For every 100 females age 18 and over, there were 88.60 males.
The median income for a household in the county was $40,156, and the median income for a family was $50,071. Males had a median income of $38,710 versus $27,297 for females. The per capita income for the county was $21,743. About 8.30% of families and 11.30% of the population were below the poverty line, including 15.60% of those under age 18 and 8.20% of those age 65 or over.
2010 census
As of the 2010 Census, there were 535,153 people, 223,943 households, and 138,060 families living in the county.[12] The population density was 1,159.5 inhabitants per square mile (447.7/km2). There were 254,775 housing units at an average density of 552.0 per square mile (213.1/km2).[13] The racial makeup of the county was 73.9% white, 20.9% black or African American, 1.7% Asian, 0.2% American Indian, 0.8% from other races, and 2.4% from two or more races. Those of Hispanic or Latino origin made up 2.3% of the population.[12] In terms of ancestry, 24.9% were German, 12.8% were Irish, 9.7% were American, and 8.8% were English.[14]
Of the 223,943 households, 29.7% had children under the age of 18 living with them, 41.6% were married couples living together, 15.3% had a female householder with no husband present, 38.4% were non-families, and 32.2% of all households were made up of individuals. The average household size was 2.33, and the average family size was 2.94. The median age was 39.2 years.[12]
The median income for a household in the county was $43,965, and the median income for a family was $56,559. Males had a median income of $45,680 versus $34,991 for females. The per capita income for the county was $24,828. About 11.7% of families and 15.7% of the population were below the poverty line, including 22.7% of those under age 18 and 8.7% of those age 65 or over.[15]
Government
Current officials
- Board of Commissioners:
- Judy Dodge (D)
- Debbie Lieberman (D)
- Carolyn Rice (D)
- County Auditor: Karl L. Keith (D)
- Clerk of Courts: Mike Foley (R)
- County Coroner: Dr. Kent Harshbarger
- County Engineer: Paul Gruner (D)
- County Prosecutor: Mathias H. Heck Jr. (D)
- County Recorder: Brandon McClain (D)
- Sheriff: Rob Streck (R)
- County Treasurer: John McManus (R)
See also:
Politics
In the six presidential elections until 2016, Montgomery County has favored the Democratic candidate, but not by large margins. However, in 2016, Republican Donald Trump narrowly defeated Democrat Hillary Clinton. Montgomery County was also the most populated county in Ohio to go for Trump in 2016 and it was the only county in Ohio to flip for Joe Biden in 2020.
| Year | Republican | Democratic | Third parties |
|---|---|---|---|
| 2020 | 47.9% 129,034 | 50.2% 135,064 | 1.9% 5,066 |
| 2016 | 47.7% 123,909 | 47.0% 122,016 | 5.4% 13,951 |
| 2012 | 46.8% 124,841 | 51.4% 137,139 | 1.8% 4,727 |
| 2008 | 46.1% 128,679 | 52.3% 145,997 | 1.6% 4,355 |
| 2004 | 49.0% 138,371 | 50.6% 142,997 | 0.4% 1,216 |
| 2000 | 47.5% 109,792 | 49.6% 114,597 | 2.9% 6,598 |
| 1996 | 41.3% 95,391 | 50.0% 115,469 | 8.7% 20,097 |
| 1992 | 40.0% 104,751 | 41.3% 108,017 | 18.7% 48,952 |
| 1988 | 57.5% 131,596 | 41.8% 95,737 | 0.7% 1,610 |
| 1984 | 59.0% 137,053 | 40.5% 94,016 | 0.6% 1,333 |
| 1980 | 45.5% 101,443 | 47.1% 105,110 | 7.4% 16,456 |
| 1976 | 47.4% 100,223 | 50.4% 106,468 | 2.2% 4,745 |
| 1972 | 58.0% 120,998 | 39.4% 82,231 | 2.6% 5,323 |
| 1968 | 40.9% 84,766 | 46.4% 96,082 | 12.7% 26,272 |
| 1964 | 36.2% 71,979 | 63.8% 126,633 | |
| 1960 | 52.7% 109,602 | 47.3% 98,325 | |
| 1956 | 58.5% 107,278 | 41.6% 76,270 | |
| 1952 | 53.5% 91,905 | 46.5% 79,860 | |
| 1948 | 43.5% 60,048 | 55.7% 76,879 | 0.9% 1,187 |
| 1944 | 43.5% 63,336 | 56.5% 82,367 | |
| 1940 | 40.2% 57,866 | 59.8% 86,084 | |
| 1936 | 35.0% 44,742 | 59.8% 76,430 | 5.2% 6,606 |
| 1932 | 46.6% 49,267 | 48.5% 51,270 | 4.9% 5,180 |
| 1928 | 64.5% 71,279 | 34.9% 38,517 | 0.6% 665 |
| 1924 | 62.6% 50,845 | 26.9% 21,860 | 10.5% 8,505 |
| 1920 | 51.7% 46,493 | 42.7% 38,433 | 5.6% 5,049 |
| 1916 | 42.0% 19,683 | 51.9% 24,339 | 6.1% 2,853 |
| 1912 | 26.2% 10,341 | 39.3% 15,544 | 34.5% 13,653 |
| 1908 | 47.1% 20,069 | 48.3% 20,566 | 4.7% 1,980 |
| 1904 | 58.7% 22,144 | 36.9% 13,933 | 4.4% 1,648 |
| 1900 | 53.5% 19,606 | 44.3% 16,236 | 2.1% 772 |
| 1896 | 53.6% 18,333 | 45.4% 15,540 | 1.1% 359 |
| 1892 | 46.9% 13,197 | 50.0% 14,067 | 3.2% 888 |
| 1888 | 47.9% 12,491 | 50.4% 13,142 | 1.7% 451 |
| 1884 | 50.1% 11,524 | 49.3% 11,326 | 0.6% 143 |
| 1880 | 48.3% 9,726 | 51.3% 10,332 | 0.4% 89 |
| 1876 | 46.8% 7,921 | 53.0% 8,971 | 0.2% 27 |
| 1872 | 49.2% 6,998 | 50.5% 7,183 | 0.4% 50 |
| 1868 | 51.5% 6,502 | 48.5% 6,113 | |
| 1864 | 51.2% 5,554 | 48.8% 5,291 | |
| 1860 | 50.1% 4,974 | 47.4% 4,710 | 2.5% 251 |
| 1856 | 46.3% 4,038 | 49.2% 4,285 | 4.5% 391 |
Education
Public
- Air Force Institute of Technology (actually located in Wright-Patterson AFB, Ohio).
- Sinclair Community College
- Wright State University (actually located in neighboring Greene County, Ohio, but uses a Dayton address).
Public schools
The following public school districts are located partially or entirely in Montgomery County:
- Local School Districts
- Brookville Local Schools
- Brookville High School, Brookville (the Blue Devils)
- Brookville Local Schools
- The Dayton Regional STEM School
- New Lebanon Local Schools
- Dixie High School, Dixie (the Greyhounds)
- Jefferson Township Local Schools
- Jefferson Township High School, Dayton (the Broncos)
- Northridge Local School District
- Northridge High School (the Polar Bears)
- Mad River Local Schools
- Walter E. Stebbins High School, Riverside (the Indians)
- Valley View Local Schools
- Valley View High School, Germantown (the Spartans)
- New Lebanon Local Schools
- City School Districts
- Centerville City Schools
- Centerville High School, Centerville (the Elks)
- Dayton Public Schools
- Belmont High School for Computer Technology/Engineering, Dayton (the Bison)
- Thurgood Marshall High School for the Arts, Dayton (the Cougars)
- Dayton Early College Academy, Dayton
- Dunbar High School for Professional Studies, Dayton (the Wolverines)
- Meadowdale High School for Cultural Studies/International Baccalaureate, Dayton (the Lions)
- Stivers School for the Arts, Dayton (Tigers)
- Huber Heights City Schools
- Wayne High School, Huber Heights (the Warriors)
- Kettering City School District
- Fairmont High School, Kettering (the Firebirds)
- (merger of the former Fairmont East and Fairmont West high schools (the East Falcons and the West Dragons)
- Fairmont High School, Kettering (the Firebirds)
- Miamisburg City Schools
- Miamisburg High School, Miamisburg (the Vikings)
- Northmont City Schools
- Northmont High School, Clayton (the Thunderbolts)
- Oakwood City School District
- Oakwood High School, Oakwood (the Lumberjacks)
- Trotwood-Madison City Schools
- Trotwood-Madison High School, Trotwood (the Rams)
- Vandalia Butler City Schools
- Butler High School, Vandalia (the Aviators)
- West Carrollton Schools
- West Carrollton Senior High School, West Carrollton (the Pirates)
- Centerville City Schools
- Carlisle High School, Carlisle (the Indians)
Private schools
The following private high schools are located in Montgomery County:
- Archbishop Alter High School, Kettering (the Knights) (Roman Catholic)
- Carroll High School, Dayton (the Patriots) (Roman Catholic)
- Chaminade Julienne High School, Dayton (Eagles) (Roman Catholic/Marianist)
- Dayton Christian High School, Dayton (the Warriors) (nondenominational Christian)
- Miami Valley School, Dayton (the Rams) (nonsectarian)
- Spring Valley Academy, Centerville (Seventh-day Adventist)
Communities
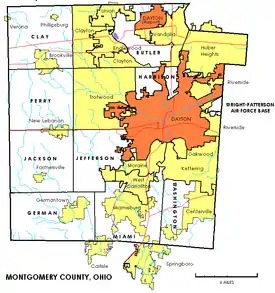
Cities
- Brookville
- Centerville (partly in Greene County)
- Clayton
- Dayton (county seat)
- Englewood
- Germantown
- Huber Heights (partly in Miami County)
- Kettering (partly in Greene County)
- Miamisburg
- Moraine
- Oakwood
- Riverside
- Springboro (mostly in Warren County)
- Trotwood
- Union (mostly in Montgomery County)
- Vandalia
- West Carrollton
Villages
- Carlisle (mostly in Warren County)
- Farmersville
- New Lebanon
- Phillipsburg
- Verona (mostly in Preble County)
Defunct townships
- Dayton
- Mad River (remnant merged with the Village of Riverside in 1994)
- Madison (remnant merged with the Village of Trotwood in 1996)
- Randolph (remnant merged with the Village of Clayton in 1998)
- Van Buren (partitioned between the municipalities of Kettering and Moraine in 1952-1953)[18]
- Wayne (incorporated as Huber Heights in 1981)
Census-designated place
Other unincorporated communities
References
- "Ohio County Profiles: Montgomery County" (PDF). Ohio Department of Development. Archived from the original (PDF) on May 8, 2007. Retrieved April 28, 2007.
- "State & County QuickFacts". United States Census Bureau. Archived from the original on June 29, 2011. Retrieved February 9, 2015.
- "Ohio 2010 Census Population For Counties" (PDF). Archived from the original (PDF) on 2012-05-30. Retrieved 2011-10-18.
- "Find a County". National Association of Counties. Retrieved 2011-06-07.
- "Montgomery County data". Ohio State University Extension Data Center. Archived from the original on 2008-03-27. Retrieved 2007-04-28.
- "2010 Census Gazetteer Files". United States Census Bureau. August 22, 2012. Archived from the original on May 4, 2014. Retrieved February 9, 2015.
- "Population and Housing Unit Estimates". Retrieved March 26, 2020.
- "U.S. Decennial Census". United States Census Bureau. Retrieved February 9, 2015.
- "Historical Census Browser". University of Virginia Library. Retrieved February 9, 2015.
- Forstall, Richard L., ed. (March 27, 1995). "Population of Counties by Decennial Census: 1900 to 1990". United States Census Bureau. Retrieved February 9, 2015.
- "Census 2000 PHC-T-4. Ranking Tables for Counties: 1990 and 2000" (PDF). United States Census Bureau. April 2, 2001. Retrieved February 9, 2015.
- "DP-1 Profile of General Population and Housing Characteristics: 2010 Demographic Profile Data". United States Census Bureau. Archived from the original on 2020-02-13. Retrieved 2015-12-27.
- "Population, Housing Units, Area, and Density: 2010 - County". United States Census Bureau. Archived from the original on 2020-02-13. Retrieved 2015-12-27.
- "DP02 SELECTED SOCIAL CHARACTERISTICS IN THE UNITED STATES – 2006-2010 American Community Survey 5-Year Estimates". United States Census Bureau. Archived from the original on 2020-02-13. Retrieved 2015-12-27.
- "DP03 SELECTED ECONOMIC CHARACTERISTICS – 2006-2010 American Community Survey 5-Year Estimates". United States Census Bureau. Archived from the original on 2020-02-13. Retrieved 2015-12-27.
- Leip, David. "Dave Leip's Atlas of U.S. Presidential Elections". uselectionatlas.org. Retrieved 3 April 2018.
- "Ohio Historical Election Results". Retrieved January 21, 2021.
- "The City of Moraine -". The City of Moraine. Retrieved 3 April 2018.
External links
Places adjacent to Montgomery County, Ohio | ||||||||||
|---|---|---|---|---|---|---|---|---|---|---|
| ||||||||||
Municipalities and communities of Montgomery County, Ohio, United States | ||
|---|---|---|
| Cities | Map of Ohio highlighting Montgomery County | |
| Villages | ||
| Townships | ||
| CDPs | ||
| Unincorporated communities | ||
| Ghost towns | ||
| Footnotes | ‡This populated place also has portions in an adjacent county or counties | |
| ||
.svg.png.webp)
| Authority control |
|---|