Stark County, Ohio
Stark County is a county located in the U.S. state of Ohio. As of the 2010 census, the population was 375,586.[1] Its county seat is Canton.[2] The county was created in 1808 and organized the next year.[3] It is named for John Stark, an officer in the American Revolutionary War.[4]
Stark County | |
|---|---|
_edit.JPG.webp) | |
 Seal | |
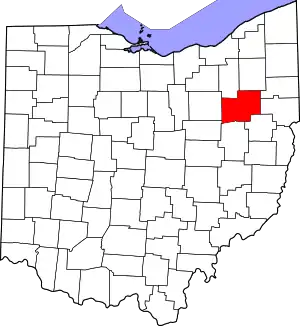 Location within the U.S. state of Ohio | |
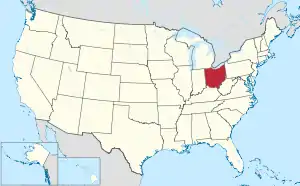 Ohio's location within the U.S. | |
| Coordinates: 40°49′N 81°22′W | |
| Country | |
| State | |
| Founded | January 1, 1809 |
| Named for | John Stark |
| Seat | Canton |
| Largest city | Canton |
| Area | |
| • Total | 581 sq mi (1,500 km2) |
| • Land | 575 sq mi (1,490 km2) |
| • Water | 5.3 sq mi (14 km2) 0.9%% |
| Population | |
| • Estimate (2019) | 370,606 |
| • Density | 653/sq mi (252/km2) |
| Time zone | UTC−5 (Eastern) |
| • Summer (DST) | UTC−4 (EDT) |
| Congressional districts | 7th, 13th, 16th |
| Website | www |
Stark County is included in the Canton-Massillon, OH Metropolitan Statistical Area, which is also included in the Cleveland-Akron-Canton, OH Combined Statistical Area.
History
Stark County was named in honor of American Revolutionary War General John Stark. John Stark (August 28, 1728 – May 8, 1822) was a general who served in the American Continental Army during the American Revolutionary War. He became widely known as the "Hero of Bennington" for his exemplary service at the Battle of Bennington in 1777.
In the 1760s Moravian missionaries from Pennsylvania attempted to establish missions aimed at converting the native people. The earliest of these were Christian Frederick Post and John Heckewelder.
The first permanent settlements were established in 1805, beginning with Canton. Possibly 80% of the early settlers were German-speakers from Pennsylvania, although others came from Virginia, New York, and New England. Lumbering and sawmills were important early industries, to cater to the enormous demand for lumber from the incoming settlers. Stark County was originally part of Columbiana County, but was split off in 1807.
At the start of the Civil War the men of Stark County were quick to volunteer to preserve the Union. As of 1862 over 1,100 had enlisted.[5]
During the early 20th century, Stark County was an important location in the early development of professional football. The rivalry between the Massillon Tigers and Canton Bulldogs helped bring the Ohio League to prominence in the mid-1900s (decade) and again in the late 1910s. The Bulldogs ended up a charter member of the National Football League, where it played for several years. (The role Stark County had in developing the game is part of the reason the Pro Football Hall of Fame is located in Canton.) Two relatively large football stadiums, Tom Benson Hall of Fame Stadium in Canton and Paul Brown Tiger Stadium in Massillon, are still in use (albeit now mostly for high school football), with Tom Benson Hall of Fame Stadium hosting the NFL's annual Pro Football Hall of Fame Game each year.
In the later 20th century, Stark County's voting record swung from one party to another, closely tracking the winner of the U.S. Presidential election. Even within the swing state of Ohio, Stark County is regarded as a quintessential bellwether, and thus presidential candidates have typically made multiple visits to the region. Major media outlets typically pay close attention to the election results in the county. The New York Times in particular has covered the county's citizens and their voting concerns in a series of features each election cycle for over a decade.
Geography
According to the U.S. Census Bureau, the county has a total area of 581 square miles (1,500 km2), of which 575 square miles (1,490 km2) is land and 5.3 square miles (14 km2) (0.9%) is water.[6]
Adjacent counties
- Portage County (north)
- Mahoning County (northeast)
- Columbiana County (east)
- Carroll County (southeast)
- Tuscarawas County (south)
- Holmes County (southwest)
- Wayne County (west)
- Summit County (northwest)
Major Highways
National protected area
Demographics
| Historical population | |||
|---|---|---|---|
| Census | Pop. | %± | |
| 1810 | 2,734 | — | |
| 1820 | 12,406 | 353.8% | |
| 1830 | 26,588 | 114.3% | |
| 1840 | 34,603 | 30.1% | |
| 1850 | 39,878 | 15.2% | |
| 1860 | 42,978 | 7.8% | |
| 1870 | 52,508 | 22.2% | |
| 1880 | 64,031 | 21.9% | |
| 1890 | 84,170 | 31.5% | |
| 1900 | 94,747 | 12.6% | |
| 1910 | 122,987 | 29.8% | |
| 1920 | 177,218 | 44.1% | |
| 1930 | 221,784 | 25.1% | |
| 1940 | 234,887 | 5.9% | |
| 1950 | 283,194 | 20.6% | |
| 1960 | 340,345 | 20.2% | |
| 1970 | 372,210 | 9.4% | |
| 1980 | 378,823 | 1.8% | |
| 1990 | 367,585 | −3.0% | |
| 2000 | 378,098 | 2.9% | |
| 2010 | 375,586 | −0.7% | |
| 2019 (est.) | 370,606 | [7] | −1.3% |
| U.S. decennial census[8] 1790-1960[9] 1900-1990[10] 1990–2000[11] 2010–2019[1] | |||
2000 census
As of the census[12] of 2000, there were 378,098 people, 148,316 households, and 102,782 families living in the county. The population density was 656 people per square mile (253/km2). There were 157,024 housing units at an average density of 272 per square mile (105/km2). The racial makeup of the county was 90.28% white, 7.20% black or African American, 0.24% Native American, 0.54% Asian, 0.02% Pacific Islander, 0.29% from other races, and 1.43% from two or more races. 0.92% of the population were Hispanic or Latino of any race.
There were 148,316 households, out of which 31.00% had children under the age of 18 living with them, 54.20% were married couples living together, 11.50% had a female householder with no husband present, and 30.70% were non-families. 26.10% of all households were made up of individuals, and 10.90% had someone living alone who was 65 years of age or older. The average household size was 2.49 and the average family size was 3.00.
In the county, the population was spread out, with 24.80% under the age of 18, 8.30% from 18 to 24, 27.80% from 25 to 44, 24.00% from 45 to 64, and 15.10% who were 65 years of age or older. The median age was 38 years. For every 100 females there were 92.40 males. For every 100 females age 18 and over, there were 88.40 males.
The median income for a household in the county was $39,824, and the median income for a family was $47,747. Males had a median income of $37,065 versus $23,875 for females. The per capita income for the county was $20,417. About 6.80% of families and 9.20% of the population were below the poverty line, including 12.90% of those under age 18 and 6.60% of those age 65 or over.
2010 census
As of the 2010 census, there were 375,586 people, 151,089 households, and 100,417 families living in the county.[13] The population density was 652.9 inhabitants per square mile (252.1/km2). There were 165,215 housing units at an average density of 287.2 per square mile (110.9/km2).[14] The racial makeup of the county was 88.7% white, 7.6% black or African American, 0.7% Asian, 0.3% American Indian, 0.5% from other races, and 2.2% from two or more races. Those of Hispanic or Latino origin made up 1.6% of the population.[13] In terms of ancestry, 33.6% were German, 15.5% were Irish, 10.1% were English, 10.1% were Italian, and 7.7% were American.[15]
Of the 151,089 households, 30.2% had children under the age of 18 living with them, 49.2% were married couples living together, 12.7% had a female householder with no husband present, 33.5% were non-families, and 28.1% of all households were made up of individuals. The average household size was 2.42 and the average family size was 2.96. The median age was 41.1 years.[13]
The median income for a household in the county was $44,941 and the median income for a family was $55,976. Males had a median income of $44,238 versus $31,896 for females. The per capita income for the county was $24,015. About 9.5% of families and 12.7% of the population were below the poverty line, including 19.5% of those under age 18 and 6.7% of those age 65 or over.[16]
Politics
Stark County has often been described as "the swing county, in the swing state" when it comes to presidential elections. Locally, it has generally been a strong republican area, but that changed in the 1990s and into 2000s, where it remained highly competitive for both parties. In 1992 it became a swing county that tilted Democratic, and over the next 15-20 years more local office holders were Democrats. That has changed, however, in the last 10 years or so, beginning in 2010. Republicans now hold most of the local elected positions.
| Year | Republican | Democratic | Third parties |
|---|---|---|---|
| 2020 | 58.4% 111,097 | 39.9% 75,904 | 1.7% 3,092 |
| 2016 | 55.9% 98,388 | 38.7% 68,146 | 5.5% 9,631 |
| 2012 | 48.7% 88,581 | 49.2% 89,432 | 2.1% 3,733 |
| 2008 | 46.1% 86,743 | 51.6% 96,990 | 2.3% 4,277 |
| 2004 | 48.9% 92,215 | 50.6% 95,337 | 0.5% 907 |
| 2000 | 48.9% 78,153 | 47.1% 75,308 | 4.0% 6,383 |
| 1996 | 38.0% 60,212 | 46.4% 73,437 | 15.6% 24,697 |
| 1992 | 35.3% 61,863 | 40.0% 70,064 | 24.7% 43,165 |
| 1988 | 55.1% 87,087 | 44.1% 69,639 | 0.9% 1,370 |
| 1984 | 59.7% 98,434 | 39.5% 65,157 | 0.8% 1,325 |
| 1980 | 55.9% 87,769 | 37.6% 59,005 | 6.6% 10,332 |
| 1976 | 49.8% 72,607 | 48.1% 70,012 | 2.1% 3,090 |
| 1972 | 62.7% 92,110 | 35.1% 51,565 | 2.1% 3,135 |
| 1968 | 47.9% 68,414 | 40.4% 57,675 | 11.8% 16,799 |
| 1964 | 37.7% 53,632 | 62.3% 88,704 | |
| 1960 | 55.2% 82,881 | 44.8% 67,205 | |
| 1956 | 62.9% 83,667 | 37.2% 49,445 | |
| 1952 | 57.7% 74,929 | 42.3% 55,031 | |
| 1948 | 51.4% 51,482 | 47.5% 47,533 | 1.1% 1,135 |
| 1944 | 47.3% 51,506 | 52.7% 57,393 | |
| 1940 | 43.8% 46,384 | 56.2% 59,496 | |
| 1936 | 35.9% 34,693 | 60.0% 57,931 | 4.1% 3,988 |
| 1932 | 51.1% 40,672 | 44.9% 35,757 | 4.1% 3,225 |
| 1928 | 70.9% 59,564 | 28.4% 23,840 | 0.8% 671 |
| 1924 | 64.3% 40,858 | 19.7% 12,544 | 16.0% 10,160 |
| 1920 | 62.9% 37,483 | 30.9% 18,437 | 6.2% 3,688 |
| 1916 | 45.2% 14,159 | 48.9% 15,316 | 5.8% 1,828 |
| 1912 | 22.6% 6,033 | 37.1% 9,908 | 40.4% 10,788[19] |
| 1908 | 50.5% 14,112 | 44.0% 12,286 | 5.6% 1,559 |
| 1904 | 65.5% 15,695 | 28.9% 6,919 | 5.7% 1,361 |
| 1900 | 54.1% 13,165 | 43.8% 10,651 | 2.1% 509 |
| 1896 | 51.1% 12,111 | 47.9% 11,339 | 1.0% 235 |
| 1892 | 44.8% 9,231 | 49.6% 10,227 | 5.6% 1,150 |
| 1888 | 47.3% 8,763 | 49.1% 9,094 | 3.6% 674 |
| 1884 | 49.6% 8,315 | 47.5% 7,955 | 2.9% 487 |
| 1880 | 50.2% 7,264 | 48.1% 6,965 | 1.7% 238 |
| 1876 | 48.2% 6,410 | 50.9% 6,772 | 1.0% 128 |
| 1872 | 52.3% 5,817 | 47.2% 5,250 | 0.5% 55 |
| 1868 | 53.1% 5,601 | 46.9% 4,948 | |
| 1864 | 52.8% 4,797 | 47.2% 4,282 | |
| 1860 | 53.0% 4,064 | 36.8% 2,820 | 10.3% 787 |
| 1856 | 50.7% 3,770 | 48.9% 3,633 | 0.4% 28 |
Government
Elected officials[20]
- Commissioners: Janet Weir Creighton (R), Bill Smith (R), Richard Regula (R)
- Auditor: Alan Harold (R)
- Clerk of Courts: Lynn Todaro (R)
- Judges of the Court of Common Pleas: Hon. Kristin Farmer (R), Hon. Natalie Haupt (D), Hon. Taryn L. Heath (D), Hon. Francis G. Forchione (D), Hon Chryssa Hartnett (D)
- Coroner: Ron Rusnak M.D. (R)
- Engineer: Keith Bennett (D)
- Family Court: Hon. Rosemarie Hall (R), Hon Jim D. James (R), Hon David R. Nist (R)
- Probate Court: Hon. Dixie Park (R)
- Prosecutor: Kyle Stone (R)
- Recorder: Jamie Walters (R)
- Sheriff: George Maier (D)
- Treasurer: Alex Zumbar (R)
Education
Colleges and universities
Community, junior, and technical colleges
- R. G. Drage Career Technical Center
Public school districts
- Alliance City School District
- Canton City School District
- Canton Local School District
- Fairless Local School District
- Jackson Local School District
- Lake Local School District
- Louisville City School District
- Marlington Local School District
- Massilon City School District
- Minerva Local School District
- North Canton City School District
- Northwest Local School District
- Osnaburg Local School District
- Perry Local School District
- Plain Local School District
- Sandy Valley Local School District
- Tuslaw Local School District
High schools
- Alliance High School
- Canton McKinley High School
- Canton South High School
- Central Catholic High School
- East Canton High School
- Fairless High School
- GlenOak High School
- Heritage Christian School
- Hoover High School
- Indian River High School
- Jackson High School
- Jackson School for the Arts
- Lake Center Christian School
- Lake High School
- Louisville High School
- Marlington High School
- Massillon Christian School
- Minerva High School
- Northwest High School
- Perry High School
- St. Thomas Aquinas High School
- Washington High School
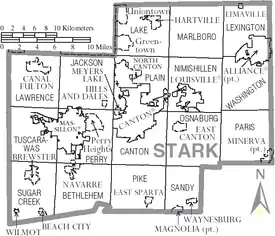
Communities
Cities
- Alliance
- Canal Fulton
- Canton (county seat)
- Louisville
- Massillon
- North Canton
Villages
Townships
Prior to 1815, Stark County consisted of only eight large townships.[21] After a number of partitions and a few transfers between counties, the townships are:
https://web.archive.org/web/20160715023447/http://www.ohiotownships.org/township-websites
Census-designated places
Other unincorporated communities
References
- "State & County QuickFacts". United States Census Bureau. Archived from the original on July 20, 2011. Retrieved February 11, 2015.
- "Find a County". National Association of Counties. Archived from the original on 2011-05-31. Retrieved 2011-06-07.
- "Ohio: Individual County Chronologies". Ohio Atlas of Historical County Boundaries. The Newberry Library. 2007. Retrieved February 14, 2015.
- "Stark County data". Ohio State University Extension Data Center. Retrieved 2007-04-28.
- Perrin, William Henry (1881). History of Stark County, with an outline sketch of Ohio. Chicago: Baskin & Battey. Retrieved June 26, 2019.
- "2010 Census Gazetteer Files". United States Census Bureau. August 22, 2012. Archived from the original on May 4, 2014. Retrieved February 11, 2015.
- "Population and Housing Unit Estimates". Retrieved March 26, 2020.
- "U.S. Decennial Census". United States Census Bureau. Retrieved February 11, 2015.
- "Historical Census Browser". University of Virginia Library. Retrieved February 11, 2015.
- Forstall, Richard L., ed. (March 27, 1995). "Population of Counties by Decennial Census: 1900 to 1990". United States Census Bureau. Retrieved February 11, 2015.
- "Census 2000 PHC-T-4. Ranking Tables for Counties: 1990 and 2000" (PDF). United States Census Bureau. April 2, 2001. Retrieved February 11, 2015.
- "U.S. Census website". United States Census Bureau. Retrieved 2008-01-31.
- "DP-1 Profile of General Population and Housing Characteristics: 2010 Demographic Profile Data". United States Census Bureau. Archived from the original on 2020-02-13. Retrieved 2015-12-27.
- "Population, Housing Units, Area, and Density: 2010 - County". United States Census Bureau. Archived from the original on 2020-02-13. Retrieved 2015-12-27.
- "DP02 SELECTED SOCIAL CHARACTERISTICS IN THE UNITED STATES – 2006-2010 American Community Survey 5-Year Estimates". United States Census Bureau. Archived from the original on 2020-02-13. Retrieved 2015-12-27.
- "DP03 SELECTED ECONOMIC CHARACTERISTICS – 2006-2010 American Community Survey 5-Year Estimates". United States Census Bureau. Archived from the original on 2020-02-13. Retrieved 2015-12-27.
- Leip, David. "Dave Leip's Atlas of U.S. Presidential Elections". uselectionatlas.org. Retrieved 2018-05-03.
- "Ohio Historical Election Results". Retrieved January 21, 2021.
- The leading "other" candidate, Progressive Theodore Roosevelt, received 6,802 votes, while Socialist candidate Eugene Debs received 3,606 votes, Prohibition candidate Eugene Chafin received 309 votes, and Socialist Labor candidate Arthur Reimer received 71 votes.
- Stark County Elected Officials Archived September 27, 2006, at the Wayback Machine
- U.S. GenWeb: Ohio, Stark County, accessed February 2018.
External links
- Stark County official website
- Stark County Commissioners Office official website
- Stark County Recorder's Office official website
- Stark County Sheriff's Office official website
- Canton Stark County Convention & Visitors Bureau official website
- Lehman, John H. (ed.) (1916). A standard history of Stark County, Ohio (3 vol). Chicago: Lewis Publishing. Retrieved June 26, 2019.CS1 maint: extra text: authors list (link)
- Canton, Ohio and the surrounding communities in Stark County
- Ohio and Erie Canal National Heritage Corridor, a National Park Service Discover Our Shared Heritage Travel Itinerary
- Stark County Weather and Weather News
- Stark County Employment Classifieds
Places adjacent to Stark County, Ohio | |
|---|---|
Municipalities and communities of Stark County, Ohio, United States | ||
|---|---|---|
| Cities | Map of Ohio highlighting Stark County | |
| Villages | ||
| Townships | ||
| CDPs | ||
| Unincorporated communities | ||
| Footnotes | ‡This populated place also has portions in an adjacent county or counties | |
| ||
.svg.png.webp)
| Authority control |
|---|