Economy of England
The economy of England is the largest economy of the four countries of the United Kingdom.
 | |
| Currency | 1 pound (£1) = 100 pence[1] |
|---|---|
| 6 April – 5 April | |
| Statistics | |
| GDP | |
GDP growth | |
GDP per capita | |
All values, unless otherwise stated, are in US dollars. | |
England is a highly industrialised country. It is an important producer of textiles and chemical products. Although automobiles, locomotives, and aircraft are among England's other important industrial products, a significant proportion of the country's income comes from the City of London. Since the 1990s, the financial services sector has played an increasingly significant role in the English economy and the City of London is one of the world's largest financial centres. Banks, insurance companies, commodity and futures exchanges are heavily concentrated in the City. The British pound sterling is the official currency of England and the central bank of the United Kingdom, the Bank of England, is located in London.
The service sector of the economy as a whole is now the largest in England, with manufacturing and primary industries in decline. The only major secondary industry that is growing is the construction industry, fueled by economic growth provided mainly by the growing services, administrative and financial sector.
GDP
Gross Domestic Product (GDP) figures are estimated (using a variety of means) for independent nations, and used to measure and compare aggregate (total) wealth between countries. Since England is not an independent state, but comprises one of the four major nations of the UK (along with Scotland, Wales, and Northern Ireland), there are fewer internationally-comparable figures available.
| Region | GDP (trillion $) | GDP (trillion €) | GDP (trillion £)[3][4] |
|---|---|---|---|
| Total UK GDP: | 2.8 | 2.3 | 2.1 |
| England (including London): | 2.4 | 2.0 | 1.8 |
| England (excluding London): | 1.7 | 1.5 | 1.4 |
| London: | 0.7 | 0.5 | 0.4 |
| Scotland: | 0.2 | 0.18 | 0.16 |
| Wales: | 0.1 | 0.08 | 0.07 |
| Northern Ireland: | 0.06 | 0.05 | 0.05 |
This would make the economy of England taken alone (£1.8tn / €2.0tn) approximately the world's 8th largest economy (just behind France, and ahead of Italy) as opposed to the 5th largest for the UK as a whole (between Germany (4th), and India, 6th) by the usual criteria. Scotland's economy, for comparison, would be roughly the size of Greece's (50th).
History
In medieval times (c. 11th–15th century), the wool trade was the major industry of England and the country exported wool to Europe. Many market towns and ports grew up on the industry. Starting in 1555 with John Lok, England entered into the slave trade. John Hawkins is often considered to be the pioneer of the British slave trade, because he was the first to run the Triangular trade, making a profit at every stop. Poor infrastructure hampered the development of large scale industry. This changed when the canals and railways began to be built, in the late 18th century and early 19th century. England became the world's first industrialised nation, with the Industrial Revolution taking place in the late 18th century. This was also the age of British overseas expansion, where England relied upon colonies (such as India, America, Canada, or Australia) to bring in resources such as cotton and tobacco. English factories then processed goods and sold them on in both the quickly growing domestic market or abroad. Cities grew and large industrial centres were established, especially in the Midlands and North England.
Sectors
Agriculture and fishing
Agriculture is intensive, highly mechanised, and efficient by European standards, producing about 60% of food needs with only 2% of the labour force. It contributes around 2% of GDP. Around two thirds of production is devoted to livestock, and one third to arable crops. Agriculture is subsidised by the European Union's Common Agricultural Policy.
The main crops that are grown are wheat, barley, oats, potatoes, sugar beets.
The United Kingdom fishing industry contributed £446 million in 2019 in terms of Gross Value Added (GVA); this represents 0.02% of the UK's total GVA.[5] Scotland accounted for 61% of this output. The largest English region was the South West, contributing 10% of overall output in the sector. Kingston upon Hull, Grimsby, Fleetwood, Great Yarmouth, and Lowestoft are among the coastal towns that have large fishing industries.
Finance
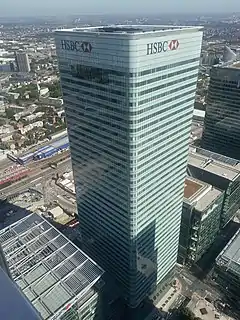
England's capital is London. The City of London is England's major financial district, and one of the world's leading financial centres. The city is where the London Stock Exchange, as well as many other exchanges, are based.
Service industries, particularly banking, insurance, and business services, account by far for the largest proportion of GDP and employ around 80% of the working population.
Leeds is England's second largest financial centre,[6] with over 30 national and international banks based in the city.[7] Over 124,000 people are employed in banking and financial services in Leeds, and over in the wider Leeds City Region.[8][9]
Manchester is the largest financial and professional services sector outside London and is the mid tier private equity capital of Europe.[10]
Manufacturing
Manufacturing continues to decline in importance. In the 1960s and 1970s manufacturing was a significant part of England's economic output. However, a lot of the heavy manufacturing industry was government-run and had failed to respond to world markets. State industries were sold off and over the 20th century many closed as they were unable to compete; a situation largely reflected in other Western industrialised countries. In June 2010, manufacturing in the United Kingdom accounted for 8.2% of the workforce and 12% of the country's national output. England remains a key player in the aerospace, defence, pharmaceutical and chemical industries, and British companies worldwide continue to have a role in the sector through foreign investment.
Tourism
Tourism accounted for £96 billion of GDP (8.6% of the economy) in 2009. It employs over 2 million people – around 4% of the working population.[11]
The largest centre for tourism is London, which attracted close to 20 million tourists in 2016 alone. The British Museum (featuring over 8 million objects in its vast collection) has served as a major tourist attraction with over 5,906,716 visitors in 2017 alone.[12]
Tourists are drawn to England due to a diverse range of reasons such as the existence of one of the world's few surviving monarchies that features the oldest monarch alive. The historical importance of the British Empire as a world super power has also led to a rich history in areas such as architecture, tradition and art. Over time, the British Empire amassed an impressive collection of historically important artifacts, many of which are on display in the British Museum.
Regional Disparity / North-South Divide
UK
According to Eurostat figures there are huge regional disparities in the UK with GDP per capita ranging from €15,000 in West Wales to €179,800 in Inner-London West. There are 26 areas in the UK where the GDP per person is under €20,000.[13]
Regional variation
.png.webp)
The strength of the English economy varies between regions. The following table shows the total GVA (gross value added) of each of the nine English region in addition to the GVA per capita. These figures are for 2016.
| Rank | Place | GVA Per Capita (£) | GVA (£) | % of English GVA |
|---|---|---|---|---|
| England | £27,100 | £1,498 billion | ||
| 1. | London | £46,500 | £408 billion | 27.24% |
| 2. | South East | £28,700 | £259 billion | 17.29% |
| 3. | North West | £23,100 | £167 billion | 11.15% |
| 4. | East of England | £24,000 | £147 billion | 9.81% |
| 5. | South West | £23,100 | £127 billion | 8.48% |
| 6. | West Midlands | £21,800 | £127 billion | 8.48% |
| 7. | Yorkshire and the Humber | £20,700 | £112 billion | 7.48% |
| 8. | East Midlands | £21,200 | £100 billion | 6.68% |
| 9. | North East | £19,200 | £51 billion | 3.4% |
Two of the 10 economically strongest areas in the European Union are in England. Inner London is number 1 with a €71 338 GDP per capita (303% above EU average); Berkshire, Buckinghamshire & Oxfordshire is number 7 with a €40 937 GDP per capita (174% above EU average).
Although being in South West England, which is the 4th strongest region in England, Cornwall and the Isles of Scilly (combined into a NUTS:3 region for statistical purposes) is the weakest area in England, with a GDP per capita of €18 645 per capita, or 79% of the EU average of €21 503.
The British Chambers of Commerce Quarterly Economic Survey has information on how the economy of each region has performed since 1989.[15]
See also
- Economy of Northern Ireland
- Economy of Scotland
- Economy of Wales
- Economy of the United Kingdom
- Economy of Europe
- List of country subdivisions by GDP over USD 100 billions
References
- Archived 3 February 2009 at the Wayback Machine
- "Regional economic activity by gross domestic product". Office for National Statistics. Retrieved 19 December 2019.
- https://www.ons.gov.uk/economy/grossdomesticproductgdp/bulletins/regionaleconomicactivitybygrossdomesticproductuk/1998to2018/pdf
- "World Economic Outlook Database, October 2019". IMF.org. International Monetary Fund. Retrieved 15 October 2019.
- UK Fisheries Statistics
- Archived 21 February 2012 at the Wayback Machine
- "Archived copy". Archived from the original on 13 October 2009. Retrieved 20 May 2009.CS1 maint: archived copy as title (link)
- "Leeds Financial Facts and Figures". leedsfinancialservices.org.uk. Archived from the original on 30 January 2009. Retrieved 25 January 2009.
- "Kualo Web Hosting - Resource Overload". Leedsfinancialservices.org.uk. Archived from the original on 8 June 2009. Retrieved 5 March 2014.
- Shelina Begum (2 December 2010). "A capital way to strengthen links". Manchester Evening News. Retrieved 5 March 2014.
- "The economic contribution of the visitor economy: UK and the nations" (PDF).
- "British Museum Tourist Numbers in 2017". ALVA.
- "Archived copy". Archived from the original on 6 October 2014. Retrieved 6 October 2014.CS1 maint: archived copy as title (link)
- "Office for National Statistics". Office for National Statistics.
- British Chambers of Commerce Quarterly Economic Survey Archived 7 June 2014 at the Wayback Machine. BCC. 2014. Retrieved on 16 June 2014.
External links
England articles | |||||||||
|---|---|---|---|---|---|---|---|---|---|
| History |
|  | |||||||
| Geography | |||||||||
| Politics | |||||||||
| Culture |
| ||||||||
| |||||||||
