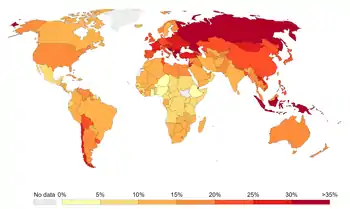
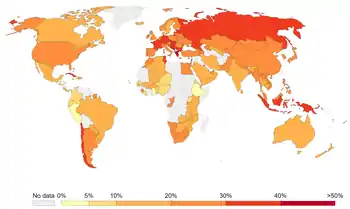
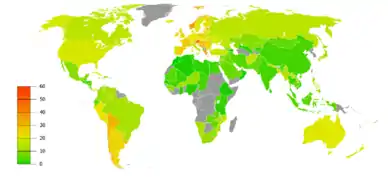
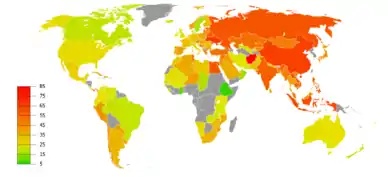
Prevalence of tobacco use
Prevalence of tobacco use is reported by the World Health Organization (WHO), which focuses on cigarette smoking due to reported data limitations.[1] Smoking has therefore been studied more extensively than any other form of consumption.[2]
| Part of a series on |
| Tobacco |
|---|
 |
| History |
| Chemistry |
| Biology |
| Personal and social impact |
| Production |
Smoking is generally five times more prevalent among men than women;[3][4] however, the gender gap differs across countries and is smaller in younger age groups.[5][6] In developed countries smoking rates for men have peaked and have begun to decline, and also started to stall or decline for women.[7] Smoking prevalence has changed little since the mid-1990s, before which time it declined in English-speaking countries due to the implementation of tobacco control. However, the number of smokers worldwide has increased from 721 million in 1980 to 967 million in 2012 and the number of cigarettes smoked increased from 4.96 trillion to 6.25 trillion due to population growth.[8]
In Western countries, smoking is more prevalent among populations with mental health problems, with alcohol and drug problems, among criminals, and among the homeless.[9] In 2002, about 20% of young teens (aged 13–15) smoked worldwide. 80,000 to 100,000 children begin smoking every day. Half of those who begin smoking in adolescent years are projected to go on to smoke for 15 to 20 years.[10]
One of the targets of the Sustainable Development Goal 3 of the United Nations (to be achieved by 2030) is to "Strengthen the implementation of the World Health Organization Framework Convention on Tobacco Control in all countries, as appropriate." The indicator that is used to measure progress is the prevalence of tobacco use.[11]
Background
WHO states that "Much of the disease burden and premature mortality attributable to tobacco use disproportionately affect the poor". Of the 1.22 billion smokers, 1 billion of them live in developing or transitional economies. Rates of smoking have leveled off or declined in the developed world.[12] In the developing world, tobacco consumption is rising by 3.4% per year as of 2002.[10]
The WHO in 2004 projected 58.8 million deaths to occur globally, from which 5.4 million are tobacco-attributed, and 4.9 million as of 2007.[13] As of 2002, 70% of the deaths are in developing countries.[13]
One of the targets of the Sustainable Development Goal 3 of the United Nations (to be achieved by 2030) is to "Strengthen the implementation of the World Health Organization Framework Convention on Tobacco Control in all countries, as appropriate." The indicator that is used to measure progress is the "age-standardized prevalence of current tobacco use among persons aged 15 years and older".[14]
Countries


Australia
In the 20th century, smoking was common. There were social events like the smoke night which promoted the habit. In Australia the incidence of smoking is in decline, with figures from the 2011-12 Australian Health Survey showing 18% of the population to be current smokers,[19] a decline from 28% in 1989–90.[20]
Among the indigenous population, the rate was much higher: 50% of men and 44% of women reported being current smokers in 2007–08.[21]
People aged 25 to 34 were the most likely to smoke (24%), with a marked decline in smoking rates as age increased past 45 years in 2011–12.[19]
In 2007–08, the prevalence of smoking was strongly associated with socioeconomic disadvantage: a greater proportion of men (33%) and women (26%) who live in the most disadvantaged 20% of areas were current smokers than those who live in the least disadvantaged 20% of areas (12% and 11% respectively).[20]
In 2016 the daily smoking rate was less than 13%.[22]
Canada
In December 2002, Statistics Canada published a report on smoking prevalence from 1985–2001. In that report they found from 1985 to 1991, prevalence of "current smoking" (which they defined as daily smokers and occasional smokers) declined overall, for both sexes and all age groups except for those aged 15 to 24. Even larger declines occurred from 1991 to 2001. While current smoking prevalence for youths did not significantly change from 1985 to 1994–1995, there was a significant decrease of 6 percentage points from 1994-1995 to 2001 (from 28.5% to 22.5%). Provincially, Newfoundland and Labrador, Nova Scotia, Quebec, Ontario, Saskatchewan, Alberta and British Columbia, experienced most of their declines in current smoking prevalence from 1994-1995 onwards. All of the provinces experienced some level of declines over the entire 1985 to 2001 period. Declines in daily smoking prevalence occurred for both sexes and all age groups over the entire 17-year time span, although youth smoking did not start significantly declining until the mid-1990s. Overall, for daily cigarette consumption, smokers by 2001 had a significantly lower proportion of smoking 26 or more cigarettes daily compared with 1985 (14.0% to 5.8%). Most of the declines in the different sex or age groups occurred after 1991. At the same time however, smokers in 2001 had a significantly higher proportion of smoking 1 to 10 cigarettes daily compared with 1985 (18.6% to 31.1%). Most of the decline occurred after 1991.[23] As of 2008 the rate was estimated to be 18%, and declining.[24] A 2011 survey estimates that 17% of Canadians smoke.[25]
Germany
In 2005, 27% of the population admitted to being current smokers. 23% were regular smokers (28% of men and 19% of women,) while 4% smoked irregularly. The highest ratio of regular smokers was in the 20-24 age group: 38% of men and 30% of women.[26] According to a 2010 study by University of Bielefeld, 9.9% of all 15-year-old males and 10.8% of 15-year-old females smoked daily, which showed a strong decline during the previous decade.[27]
Like in the most industrial countries the smoking rate in Germany decreases with increasing education level.
A 2006 comparative study found that 25.1% of male and 20.6% of female medical students in Göttingen smoke, while in London the ratios were only 10.9% and 9.1%.[28]
Germany has the largest number of cigarette vending machines per capita in the world: 800,000 per 82 million people.[29]
Israel
In Israel,[30] smoking prevalence among males had remained relatively constant at 30% in the years 1994–2004.[31] Among females the prevalence has declined slightly from 25% in 1998 to 18% in 2003.[31] For the youth, 14% smoked at least once per week, according to a 2001 publication.[32]
In 2005, research has shown that Israeli youths have begun to use bidis and hookah, as alternative methods of tobacco use.[31] In 1990, smoking was the cause of about 1,800 male deaths in Israel which was around 12% of all male deaths.[33] Smoking has not been found to be significant cause of death among Israeli women.[33] The average number of cigarettes smoked per Israeli stands at 2162 (6).[31]
There are several anti-tobacco use legislations in effect. For instance, advertising is prohibited in youth publications and is forbidden on television and radio,[33] in addition to substantial increases in tobacco taxes, although the prices are still among the lowest compared to all of the European countries.[33] In addition, until 2004, there was no minimum age requirement for buying tobacco products in Israel;[34] however, an amendment to the tobacco marketing and advertisement law that became effective at 2004 has limited the sale of tobacco to people above the age of 18.[35]
According to Israel Central Bureau of Statistics, the smoking rate in the Israeli adult population in 2009 was 20.9%, down from 34% in 2000.[36] A Ministry of Health nationwide survey conducted in 2011 found that 20.6% of the population aged 21 and older were smokers.[37] The highest percentage of smokers was among Arab males, 44% percent of whom smoked, though this figure is down from 50% in 1996.
New Zealand
Tobacco consumption in New Zealand peaked in the mid-1970s when 60% of the population were smokers. By 2011 that number had fallen to 20% of the population, thanks to stringent tobacco control laws which are amongst the world's strictest. However, despite these laws, the number of smokers appears to be increasing as the global economy worsens and a recent spate of natural disasters have seen an increase in tobacco sales and although more males smoke than females, this gap is slowly narrowing. Tobacco consumption by Maori remains disproportionately high despite having decreased over recent years thanks to television, internet, radio and print media anti-smoking advertising aimed at Maori. The high rate of Maori tobacco consumption has been described by many Maori health advocates and academics as a "cultural genocide".
Romania
According to the Romanian Ministry of Health, the smoking rate among the general population declined from 36% in 2004 to 26% in 2011.[38] A report commissioned in 2012 revealed that 34.9% of men smoked daily, compared to 14.5% of women, and in the preceding 12 months, 37.8% of regular smokers had attempted to quit at least once.[39] Despite a general decline in smoking prevalence, the rate among women nearly doubled from 1991–2011, with 55% of women smokers belonging to the 15–34 age group.[40]
Spain
According to the 2017 National Health Survey [41] 22.1% of the population above the age of 15 reports smoking daily, 2.3% declares smoking occasionally, 24.9% reports being ex-smokers and 50,7% never smoked. The survey also revealed that 25,6% of men smoked, compared to 18.8% women. The historical data series shows the rate in Spain has fallen more than 10 points from 1993 to 2017, from 44% to 25.6% for men and from 20.8% to 18.8% for women. However, since 2014, the trend has slowed, with just less than 1 point improvement, from 23% to 22,1%.
Sweden

The first research of smoking habits in Sweden was performed in 1946; it showed that 50% of men, and 9% of women were smokers. In 1977 41% of men and 32% of women were smokers.[43] By 2011, the use of smoking tobacco on a daily basis had decreased to only 12.5% and 14.3% among women. The use of snus, on a daily basis among men older than 15 years, was approximately 19.4% and only 3.0% for women.[42]
United Kingdom
The Health Survey for England in 2002 found a smoking rate of 26%. By 2007 the proportion of adult smokers in England had declined four percentage points to 22%.[44] In 2015, it was reported smoking rates in England had fallen to 16.9%, a record low.[45] The rate in England had fallen to 14.4% in 2018.[46]
Overall, the numbers of smokers in the UK in 2007 was estimated at 13.7 million.[47] In 2007 the rate of smoking amongst the most socioeconomically affluent patients was 14%, compared to 34% for the most deprived.[47] Figures from 2013 show that proportion of the British population (UK excluding Northern Ireland) who smoke has fallen to 19%.[48]
United States
According to the CDC, as of 2015, a total of 15.1% of U.S. adults (16.7% of men and 13.6% of women) smoke, which is down from 20.9% a decade earlier.[49] Of U.S. smokers in 2005, 80.8% (or 36.5 million) smoked every day, and 19.2% (or 8.7 million) smoked some days. The prevalence of current cigarette smoking also varied substantially across population groups. For instance, current smoking was higher among men at 23.9% than women at 18.1%. This is consistent with other countries (see table). Among racial and ethnic groups, Native Americans and Alaska Natives had the highest prevalence at 32.0%, followed by non-Hispanic whites at 21.9%, and non-Hispanic blacks at 21.5%. Hispanics at 16.2%, and Asians at 13.3% had the lowest rates.[50]
Smoking prevalence also based on education level, with the highest among adults who had earned a General Educational Development (GED) diploma at 43.2% and those with 9–11 years of education at 32.6%. Prevalence generally decreased with increasing education. Adults aged 18–24 years were at 24.4% and 25–44 years were at 24.1% had the highest prevalences. The prevalence of current smoking was higher among adults living below the poverty line at 29.9% than among those at or above the poverty line at 20.6%.[50]
In 2005, the CDC set a 2010 target of 12% for current cigarette smoking prevalence. Certain populations had already surpassed these when it was set. This included Hispanic (11.1%) and Asian (6.1%) women, women with undergraduate (9.6%) or graduate (7.4%) degrees, men with undergraduate (11.9%) or graduate (6.9%) degrees, men aged over 65 years (8.9%), and women aged over 65 years (8.3%).[50]
In 2013, the national smoking average in the United States was 19.6% of the adult population. The following have some of the lowest percentages of smokers with their states:
- Utah, 10.6%, lowest percentage of smokers.
- California, 11.7% 2nd lowest.[51]
- Hawaii, 14.6%, 3rd lowest.
- Connecticut, 16%, 4th lowest.
- Massachusetts, 16.4%, 7th lowest.
- Vermont, 16.5%, 9th lowest.[52]
Among cigarette smokers in 2005, an estimated 42.5% had stopped smoking for at least 1 day during the preceding 12 months because they were trying to quit. Among the estimated 42.5% (or 91.8 million) of people who had smoked at least 100 cigarettes during their lifetimes (the question the CDC asked to measure if they were ever smokers or not), 50.8% (or 46.5 million) did not smoke currently. In 2005, prevalence of current cigar smoking was 2.2% and current smokeless tobacco use was 2.3%. Prevalence of cigar smoking and use of smokeless tobacco were higher among men (4.3% and 4.5%, respectively) than women (0.3% and 0.2%).[50]
There are large regional differences in smoking rates, with Kentucky, West Virginia, Oklahoma and Mississippi topping the list, and Idaho, California and Utah at significantly lower rates.[53]
Persons with mental illness, making up about 20% of the population, consume about 33% of the tobacco used. Persons with serious mental illness die 25 years earlier than average, often from smoking related illnesses.[54]
In November 2015, the Centers for Disease Control (CDC) and Prevention noted in their report, “The percentage of U.S. adults who smoke cigarettes declined from 20.9 percent in 2005 to 16.8 percent in 2014. Cigarette smoking was significantly lower in 2014 (16.8 percent) than in 2013 (17.8 percent).” The CDC concluded this from data obtained by a survey of Americans. However, researchers said that they are not sure if products like e-cigarettes are in any way helpful to reduce smokers in the country. Around 4,000 minors start smoking in the US every day.[55]


By year
2015
The following is a list of countries by the percentage of age-standardized prevalence of tobacco smoking among persons 15 years and older in 2015 as published by the World Health Organization in 2016.[57]
| Rank | Country | Smoking rate | Relative smoking rate |
|---|---|---|---|
| 1 | 52.2 | ||
| 2 | 47.5 | ||
| 3 | 42.4 | ||
| 4 | 41.6 | ||
| 5 | 41.0 | ||
| 6 | 39.8 | ||
| 7 | 39.1 | ||
| 8 | 38.3 | ||
| 9 | 38.3 | ||
| 10 | 38.0 | ||
| 11 | 36.4 | ||
| 12 | 35.3 | ||
| 13 | 35.0 | ||
| 14 | 34.3 | ||
| 15 | 33.1 | ||
| 16 | 32.5 | ||
| 17 | 32.5 | ||
| 18 | 32.3 | ||
| 19 | 30.3 | ||
| 20 | 30.3 | ||
| 21 | 30.1 | ||
| 22 | 30.0 | ||
| 23 | 29.9 | ||
| 24 | 29.6 | ||
| 25 | 29.5 | ||
| 26 | 29.4 | ||
| 27 | 29.1 | ||
| 28 | 29.1 | ||
| 29 | 28.2 | ||
| 30 | 28.2 | ||
| 31 | 27.9 | ||
| 32 | 27.6 | ||
| 33 | 26.9 | ||
| 34 | 26.8 | ||
| 35 | 26.7 | ||
| 36 | 26.3 | ||
| 37 | 26.1 | ||
| 38 | 25.7 | ||
| 39 | 25.6 | ||
| 40 | 25.5 | ||
| 41 | 25.5 | ||
| 42 | 25.3 | ||
| 43 | 25.0 | ||
| 44 | 25.0 | ||
| 45 | 24.8 | ||
| 46 | 24.2 | ||
| 47 | 23.8 | ||
| 48 | 23.6 | ||
| 49 | 23.6 | ||
| 50 | 23.2 | ||
| 51 | 23.2 | ||
| 52 | 23.1 | ||
| 53 | 22.9 | ||
| 54 | 22.8 | ||
| 55 | 22.8 | ||
| 56 | 22.5 | ||
| 57 | 22.2 | ||
| 58 | 22.2 | ||
| 59 | 22.1 | ||
| 60 | 21.7 | ||
| 61 | 21.5 | ||
| 62 | 21.3 | ||
| 63 | 20.8 | ||
| 64 | 20.6 | ||
| 65 | 20.3 | ||
| 66 | 20.2 | ||
| 67 | 19.2 | ||
| 68 | 18.5 | ||
| 69 | 18.0 | ||
| 70 | 17.2 | ||
| 71 | 17.0 | ||
| 72 | 16.3 | ||
| 73 | 16.3 | ||
| 74 | 16.3 | ||
| 75 | 16.1 | ||
| 76 | 15.8 | ||
| 77 | 14.9 | ||
| 78 | 14.9 | ||
| 79 | 14.9 | ||
| 80 | 13.9 | ||
| 81 | 13.4 | ||
| 82 | 12.9 | ||
| 83 | 11.4 | ||
| 84 | 11.1 | ||
| 85 | 6.2 |
2008
- ! Data were not validated by country focal point in time for publication of this report
- * Current smoking prevalence not validated
- In gray, data is not available
The following is from the table b of WHO Report on the Global Tobacco Epidemic (2008).[59] From the initial survey the data is adjusted making it comparable between countries.[60] Because of this, however, it is not for inferring the prevalence within those countries (table a provides for this).[61] It contains 135 "Countries with recent internationally comparable adjusted data", 18 "Countries with national data that are neither recent nor comparable internationally", and 41 "Countries with no data".[62] The data represents smoking any tobacco product at the time of the survey including daily and non-daily smoking; the error is with a 95% confidence interval (CI).[63]
| Country | Male [%] | Error [±%] | Female [%] | Error [±%] |
|---|---|---|---|---|
| 40.5 | 13.3 | 4 | 3.3 | |
| no data | no data | no data | no data | |
| 29.9 | 2.5 | 0.3 | 0.2 | |
| 36.5 | 5.7 | 29.2 | 5.2 | |
| no data | no data | no data | no data | |
| no data | no data | no data | no data | |
| 34.6 | 3.55 | 25.4 | 3.05 | |
| 55.1 | 7.95 | 3.7 | 2.35 | |
| 27.7 | 3.4 | 21.8 | 3.25 | |
| 46.4 | 2.15 | 40.1 | 1.95 | |
| no data | no data | 0.9 | 0.55 | |
| no data | no data | no data | no data | |
| 26.1 | 3.75 | 2.9 | 1.7 | |
| 47 | 8.9 | 3.8 | 1.45 | |
| 18.4 | 8.4 | 3 | 1.65 | |
| 63.7 | 10.35 | 21.1 | 6.2 | |
| 30.1 | 3.1 | 24.1 | 2.1 | |
| no data | no data | no data | no data | |
| no data | no data | no data | no data | |
| no data | no data | no data | no data | |
| 34.1 | 7.6 | 29.2 | 3.5 | |
| 49.3 | 6.55 | 35.1 | 6.15 | |
| no data | no data | no data | no data | |
| no data | no data | no data | no data | |
| no data | no data | no data | no data | |
| 47.5 | 8.25 | 27.8 | 8.1 | |
| 22 | 1.95 | 11.2 | 1.4 | |
| no data | no data | no data | no data | |
| 40.5 | 5.05 | 6.5 | 0.65 | |
| 12.6 | 4.15 | 2.2 | 1.8 | |
| no data | no data | no data | no data | |
| no data | no data | no data | no data | |
| no data | no data | no data | no data | |
| 16 | 5.05 | 2.6 | 2.1 | |
| 42.1 | 8.45 | 33.6 | 5.35 | |
| 59.5 | 11.8 | 3.7 | 0.65 | |
| no data | no data | no data | no data | |
| 27.7 | 4 | 13.5 | 3.85 | |
| 13.5 | 4.75 | 2.6 | 2.2 | |
| 12.1 | 4.2 | 1 | 1 | |
| 36.1 | 9.15 | 20 | 6.15 | |
| 26.1 | 4.15 | 7.3 | 1.55 | |
| 15.4 | 1.7 | 2.4 | 0.6 | |
| 38.9 | 1.8 | 29.1 | 1.15 | |
| 43.4 | 17.1 | 28.3 | 6.75 | |
| no data | no data | no data | no data | |
| 36.6 | 6.6 | 25.4 | 7.45 | |
| 36.1 | 2 | 30.6 | 1.9 | |
| no data | no data | no data | no data | |
| no data | no data | no data | no data | |
| 17.5 | 7.25 | 13.3 | 3.65 | |
| 23.9 | 3.15 | 5.8 | 1.15 | |
| 28.7 | 2.25 | 1.3 | 0.5 | |
| no data | no data | no data | no data | |
| no data | no data | no data | no data | |
| 16.9 | 2.6 | 1.2 | 0.65 | |
| 49.9 | 2.7 | 27.5 | 2.15 | |
| 14.6 | 2.65 | 3.2 | 1.05 | |
| 7.6 | 1.3 | 0.9 | 0.45 | |
| 23.6 | 4.9 | 5.1 | 1.25 | |
| 31.8 | 2.35 | 24.4 | 2 | |
| 36.6 | 0.8 | 26.7 | 0.7 | |
| no data | no data | no data | no data | |
| 29.3 | 2.25 | 2.9 | 0.6 | |
| 57.1 | 8.7 | 6.3 | 3.85 | |
| 37.4 | 2.55 | 25.8 | 1.55 | |
| 10.2 | 1.5 | 0.8 | 0.4 | |
| 63.6 | 7.55 | 39.8 | 5.15 | |
| no data | no data | no data | no data | |
| 24.5 | 3.95 | 4.1 | 0.95 | |
| no data | no data | no data | no data | |
| no data | no data | no data | no data | |
| no data | no data | no data | no data | |
| no data | no data | no data | no data | |
| no data | no data | 3.4 | 1.5 | |
| 45.7 | 7.35 | 33.9 | 9.35 | |
| 26.1 | 2.45 | 26.6 | 2.4 | |
| 33.1 | 6.4 | 3.8 | 1.2 | |
| 65.9 | 8 | 4.5 | 0.5 | |
| 29.6 | 5.45 | 5.5 | 1.75 | |
| 25.8 | 4.2 | 2.5 | 1.65 | |
| 26.5 | 5.15 | 26 | 3.35 | |
| 31.1 | 4.85 | 17.9 | 10.65 | |
| 32.8 | 2.4 | 19.2 | 1.45 | |
| 20.8 | 9 | 9.2 | 2.9 | |
| 44.3 | 8.9 | 14.3 | 2.25 | |
| 62.7 | 9.15 | 9.8 | 5.8 | |
| 43.2 | 8.25 | 9.7 | 3.35 | |
| 27.1 | 3.15 | 2.2 | 0.8 | |
| no data | no data | no data | no data | |
| 58.6 | 2.5 | no data | no data | |
| 53.3 | 15.8 | 5.7 | 1.1 | |
| no data | no data | no data | no data | |
| 46.9 | 8.45 | 2.2 | 0.85 | |
| 65 | 8.05 | 15.6 | 1.2 | |
| 54.4 | 8.75 | 24.1 | 3.2 | |
| 29.1 | 4.9 | 7 | 4.25 | |
| no data | no data | no data | no data | |
| no data | no data | no data | no data | |
| no data | no data | no data | no data | |
| 45.1 | 7.2 | 20.8 | 2.85 | |
| 39.1 | 3.7 | 30.3 | 2.95 | |
| no data | no data | no data | no data | |
| 23.7 | 2.75 | 6.2 | 1.7 | |
| 54.4 | 7.2 | 2.8 | 0.85 | |
| 44.5 | 8.4 | 11.6 | 3.75 | |
| 19.5 | 1.9 | 2.8 | 0.85 | |
| 32.8 | 4.45 | 24.5 | 3.45 | |
| no data | no data | no data | no data | |
| 22.3 | 2.4 | 3.7 | 0.8 | |
| 35.7 | 3.8 | 1.1 | 0.5 | |
| 36.9 | 7.25 | 12.4 | 3.5 | |
| no data | no data | no data | no data | |
| 45.8 | 7.35 | 5.8 | 1.65 | |
| no data | no data | no data | no data | |
| 45.8 | 13.7 | 6.5 | 1.75 | |
| no data | no data | no data | no data | |
| 29.5 | 2.25 | 0.3 | 0.2 | |
| 22 | 2.25 | 3.4 | 0.9 | |
| 46.5 | 5.9 | 13.6 | 1.3 | |
| 38.6 | 3.9 | 10.9 | 1.5 | |
| 46.1 | 9.45 | 52.4 | 11.3 | |
| 34.8 | 6.55 | 26.4 | 8.4 | |
| 38.3 | 0.95 | 30.3 | 0.85 | |
| 29.7 | 4.1 | 27.5 | 4.35 | |
| no data | no data | no data | no data | |
| no data | no data | no data | no data | |
| 13 | 1.75 | 1.2 | 0.45 | |
| no data | no data | no data | no data | |
| no data | no data | no data | no data | |
| 33.6 | 4.55 | 30.4 | 4.05 | |
| 24.7 | 3.8 | 1.3 | 0.9 | |
| 35.4 | 6.75 | 6.6 | 2.3 | |
| 38.1 | 10.05 | 9.7 | 4.6 | |
| no data | no data | no data | no data | |
| no data | no data | no data | no data | |
| 33 | 3.85 | 14.8 | 2.15 | |
| no data | no data | no data | no data | |
| 42 | 5.25 | 9.8 | 0.9 | |
| 43.9 | 8.7 | 27.2 | 9.05 | |
| 40.6 | 5.5 | 31 | 4.15 | |
| no data | no data | no data | no data | |
| 40.6 | 6.8 | 24.5 | 7.15 | |
| 70.1 | 11.05 | 26.5 | 7.4 | |
| no data | no data | no data | no data | |
| no data | no data | no data | no data | |
| 28.9 | 12.1 | 12.1 | 3.9 | |
| no data | no data | no data | no data | |
| 58.3 | 12.8 | 23.4 | 6.85 | |
| no data | no data | no data | no data | |
| 23.2 | 12.8 | 10.6 | 11.9 | |
| 25.6 | 3.75 | 3.6 | 2.15 | |
| 19.8 | 2.35 | 1.5 | 0.7 | |
| 42.3 | 4.9 | 42.3 | 4.9 | |
| 35.2 | 5 | 7 | 2.65 | |
| no data | no data | no data | no data | |
| no data | no data | no data | no data | |
| 41.6 | 7 | 20.1 | 5.75 | |
| 31.8 | 6.1 | 21.1 | 4.95 | |
| no data | no data | no data | no data | |
| no data | no data | no data | no data | |
| 27.5 | 3.5 | 9.1 | 1.8 | |
| 36.4 | 4.2 | 30.9 | 3.7 | |
| 30.2 | 5.8 | 2.6 | 0.95 | |
| no data | no data | no data | no data | |
| no data | no data | no data | no data | |
| 19.6 | 1.05 | 24.5 | 1.1 | |
| 30.7 | 2.55 | 22.2 | 1.8 | |
| 44 | 26.35 | no data | no data | |
| 24.8 | 2.6 | 4.3 | 1.15 | |
| no data | no data | no data | no data | |
| 39.8 | 4.75 | 3.4 | 0.15 | |
| no data | no data | no data | no data | |
| no data | no data | no data | no data | |
| 61.8 | 12.9 | 15.8 | 4.45 | |
| 36.4 | 14.6 | 7.6 | 2.4 | |
| 51 | 2.8 | 1.9 | 0.65 | |
| 51.6 | 7.55 | 19.2 | 11.35 | |
| no data | no data | no data | no data | |
| no data | no data | no data | no data | |
| 20.9 | 2.55 | 3.2 | 0.85 | |
| 63.8 | 10.2 | 22.7 | 6.2 | |
| 26.1 | 5.15 | 2.6 | 2.05 | |
| 36.7 | 1.15 | 34.7 | 1.05 | |
| 26.3 | 3.15 | 21.5 | 3.5 | |
| 37.1 | 4.45 | 28 | 4 | |
| 24.2 | 4.55 | 1.2 | 0.5 | |
| 49.1 | 10.2 | 8.1 | 2.55 | |
| 32.5 | 5.85 | 27 | 5.9 | |
| 45.7 | 6.05 | 2.5 | 0.75 | |
| West Bank and Gaza Strip | no data | no data | no data | no data |
| no data | no data | no data | no data | |
| 21.7 | 2.75 | 5 | 1.5 | |
| 25.5 | 3.2 | 4.4 | 1.35 |
References
- "Prevalence of current tobacco use among adults aged ≥ 15 years (percentage)". World Health Organization. Archived from the original on December 11, 2008. Retrieved 2009-01-02.
- "Mayo report on addressing the worldwide tobacco epidemic through effective, evidence-based treatment". World Health Organization. p. 2. Retrieved 2009-01-02.
- Guindon, G. Emmanuel; Boisclair, David (2003). Past, current and future trends in tobacco use (PDF). Washington DC: The International Bank for Reconstruction and Development / The World Bank. pp. 13–16. Archived from the original (PDF) on March 18, 2009. Retrieved 2009-03-22.
- "Gender empowerment and female-to-male smoking prevalence ratios". World Health Organization. Retrieved 10 Sep 2020.
- The World Health Organization, and the Institute for Global Tobacco Control, Johns Hopkins School of Public Health (2001). "Women and the Tobacco Epidemic: Challenges for the 21st Century" (PDF). World Health Organization. pp. 5–6. Retrieved 2009-01-02.CS1 maint: multiple names: authors list (link)
- "Surgeon General's Report—Women and Smoking". Centers for Disease Control and Prevention. 2001. p. 47. Archived from the original on December 4, 2008. Retrieved 2009-01-03.
- Peto, Richard; Lopez, Alan D; Boreham, Jillian; Thun, Michael (2006). Mortality from Smoking in Developed Countries 1950-2000: indirect estimates from national vital statistics (PDF). Oxford University Press. p. 9. Archived from the original (PDF) on 2005-02-24. Retrieved 2009-03-22.
- Ng, Marie (Jan 8, 2014). "Smoking Prevalence and Cigarette Consumption in 187 Countries, 1980-2012". Journal of the American Medical Association. 311 (2): 183–192. doi:10.1001/jama.2013.284692. PMID 24399557.
- West, Robert & Shiffman, Saul (2007). Fast Facts: Smoking Cessation. Health Press Ltd. pp. 20, 26. ISBN 978-1-903734-98-8.
- "WHO/WPRO-Smoking Statistics". World Health Organization Regional Office for the Western Pacific. 2002-05-28. Archived from the original on November 8, 2009. Retrieved 2009-01-01.
- United Nations (2017) Resolution adopted by the General Assembly on 6 July 2017, Work of the Statistical Commission pertaining to the 2030 Agenda for Sustainable Development (A/RES/71/313)
- Centers for Disease Control and Prevention (CDC) (2009). "Cigarette smoking among adults and trends in smoking cessation - United States, 2008" (Full free text). MMWR. Morbidity and Mortality Weekly Report. 58 (44): 1227–1232. PMID 19910909.
- "WHO/WPRO-Tobacco Fact sheet". World Health Organization Regional Office for the Western Pacific. 2007-05-29. Archived from the original on 2009-02-07. Retrieved 2009-01-01.
- United Nations (2017) Resolution adopted by the General Assembly on 6 July 2017, Work of the Statistical Commission pertaining to the 2030 Agenda for Sustainable Development (A/RES/71/313)
- "Share of people who smoke every day". Our World in Data. Retrieved 5 March 2020.
- "Share of adults who smoke". Our World in Data. Retrieved 5 March 2020.
- "Smoking in men vs. women". Our World in Data. Retrieved 5 March 2020.
- "Daily cigarette consumption per smoker". Our World in Data. Retrieved 5 March 2020.
- "Table 7: Smoker status by age and sex, Australia" (XLS). Australian Health Survey: First Results, 2011-12. Australian Bureau of Statistics. Retrieved 19 February 2013.
- "Tobacco Smoking in Australia, 2007–08". Facts at your Fingertips: Health, 2011. Australian Bureau of Statistics. 2012-07-25. Retrieved 19 February 2013.
- "Tobacco Smoking in Australia 2007-08 Table 2.1" (XLS). Facts at your Fingertips: Health, 2011. Australian Bureau of Statistics. 2009-11-25. Retrieved 19 February 2013.
- "Smoking rates at 'all-time lows' in Australia". 2016-09-28. Retrieved 2016-09-28.
- Report on Smoking in Canada 1985 to 2001, Statistics Canada, Health Statistics Division, December 2002
- "Canadian Cancer Society".
- "Smoking rate falls to 17% in Canada". CBC News. 2011-09-07.
- "Leben in Deutschland. Haushalte, Familien und Gesundheit – Ergebnisse des Mikrozensus 2005" (PDF). Statistisches Bundesamt. 2005. pp. 61–67. Archived from the original (PDF) on 2009-04-19. Retrieved 2009-06-04.
- German youth smoking less
- Raupach, T; Shahab, Baetzing (2009). "smoking". Cite journal requires
|journal=(help) - "_Risikofaktor Nummer 1" [Smoking: Risk factor number 1] (in German). Archived from the original on 2012-03-06.
- Tobacco Use Introduction for Israel, World Health Organization
- Baron-Epel, O. Haviv-Messika A. Tamir D. Nitzan-Kaluski D. Green M. (2004). "Multiethnic differences in smoking in Israel: pooled analysis from three national surveys". European Journal of Public Health. 14 (4): 384–9. doi:10.1093/eurpub/14.4.384. PMID 15542874.
- Meijer, B. Branski D. Kerem E. (2001). "Ethnic differences in cigarette smoking among adolescents: a comparison of Jews and Arabs in Jerusalem". Israel Medical Association Journal: Imaj. 3 (7): 504–7.
- Tobacco or Health: A Global Status Report Archived 2006-12-10 at the Wayback Machine, Centers for Disease Control and Prevention (CDC), accessed July 13, 2005 (site now down)
- WHO European Country Profiles on Tobacco Control 2003 Archived 2010-05-16 at the Wayback Machine, World Health Organization, accessed November 24, 2005
- Israeli Ministry of Commerce and Industry
- http://www.jpost.com/HealthAndSci-Tech/Health/Article.aspx?id=181972
- "A Record Number of Non-Smokers". Walla (in Hebrew). 31 May 2012. Archived from the original on 4 June 2012. Retrieved 15 June 2012.
- "Sanatatea vrea taxa mai mare la tutun si alcool, pentru a-i convinge pe fumatori sa renunte la acest viciu. Tigarile s-ar putea scumpi iar". 23 December 2014. Retrieved 23 December 2014.
- "Raport: 4,85 milioane de romani fumeaza zilnic sau ocazional. 70% dintre fumatori isi aprind prima tigara imediat dupa trezire". 5 March 2012. Retrieved 23 December 2014.
- "Una din cinci romance este fumatoare". Retrieved 23 December 2014.
- "Nota Técnica. Encuesta Nacional de Salud. España 2017" (PDF). 26 June 2018. Retrieved 28 January 2021.
- "Scb.se". Retrieved 16 November 2012.
- http://www.nicorette.se/sites/nicorette_se/files/publication/Fakta%20om%20tobaksbruk%20i%20Sverige.pdf%5B%5D
- Health Survey for England 2007: Latest Trends, the Information Centre for Health and Social Care, December 2008
- "Smoking rates in England fall to lowest on record". BBC News. 20 September 2016 – via www.bbc.co.uk.
- "Turning the tide on tobacco: Smoking in England hits a new low - Public health matters".
- Simpson CR, Hippisley-Cox J, Sheikh A (2010). "Trends in the epidemiology of smoking recorded in UK general practice". Br J Gen Pract. 60 (572): e121–e127. doi:10.3399/bjgp10X483544. PMC 2828860. PMID 20202355.
- "Press Release: Opinions and Lifestyle Survey, Adult Smoking Habits in Great Britain, 2013". Office of National Statistics. Retrieved 26 November 2014.
- "Smoking and Tobacco Use Fact Sheet". Centers for Disease Control and Prevention. 1 December 2015. Retrieved 30 December 2016.
- Tobacco Use Among Adults: United States, 2005, Centers for Disease Control and Prevention, October 27, 2006
- https://www.csulb.edu/sites/default/files/groups/livewell/california_tobacco_facts_and_figures_2015.pdf
- "10 Healthiest States in America". University of Illinois at Chicago. 2014-07-15. Retrieved 15 September 2014.
- Centers for Disease Control and Prevention (CDC) (September 2007). "State-specific prevalence of cigarette smoking among adults and quitting among persons aged 18-35 years—United States, 2006". MMWR Morb Mortal Wkly Rep. 56 (38): 993–6. PMID 17898692.
- Pam Belluck (February 6, 2013). "Smoking, Once Used to Reward, Faces a Ban in Mental Hospitals". The New York Times. Retrieved February 7, 2013.
New data from the Centers for Disease Control and Prevention shows that the nearly 46 million adults with mental illness have a smoking rate 70 percent higher than those without mental illness, and consume about a third of the cigarettes in the country, though they make up one-fifth of the adult population.
- Makadia, Luv D.; Roper, P. Jervey; Andrews, Jeannette O.; Tingen, Martha S. (2017). "Tobacco Use and Smoke Exposure in Children: New Trends, Harm, and Strategies to Improve Health Outcomes". Current Allergy and Asthma Reports. 17 (8): 55. doi:10.1007/s11882-017-0723-0. ISSN 1529-7322. PMID 28741144.
- "Featured Datasets / Tobacco Use Among Adults By Age Group (National Adult Tobacco Survey, NATS)". cdc.gov. Centers for Disease Control and Prevention. 2014. Retrieved February 18, 2018. CDC apparently first published data on September 21, 2017.
- "GHO | World Health Statistics data visualizations dashboard | Tobacco smoking".
- WHO Report on the Global Tobacco Epidemic 2008, pp.267–288.
- WHO Report on the Global Tobacco Epidemic 2008, pp.278–287.
- WHO Report on the Global Tobacco Epidemic 2008, p.67.
- WHO Report on the Global Tobacco Epidemic 2008, p.287.
- WHO Report on the Global Tobacco Epidemic 2008, p.68.
- WHO Report on the Global Tobacco Epidemic 2008, p.268–287.
External links
| Wikivoyage has a travel guide for Smoking. |
- WHO Report on the Global Tobacco Epidemic, 2009: Surveys of adult tobacco use in WHO Member States
- "The Global Burden of Disease 2004 Update" (PDF). World Health Organization. 2008. Retrieved 2008-01-01.
- "WHO REPORT on the global TOBACCO epidemic" (PDF). World Health Organization. 2008. Retrieved 2008-01-01.
- Smoking Proves Hard to Shake Among the Poor