Corson County, South Dakota
Corson County is a county in the U.S. state of South Dakota. As of the 2010 census, the population was 4,050.[1] Its county seat is McIntosh.[2] The county was named for Dighton Corson, a native of Maine, who came to the Black Hills in 1876, and in 1877 began practicing law at Deadwood.
Corson County | |
|---|---|
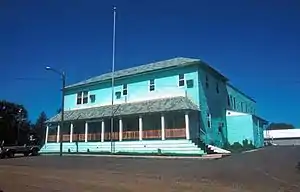 Corson County Courthouse in McIntosh, South Dakota in 1993. This building was destroyed by fire on April 10, 2006. | |
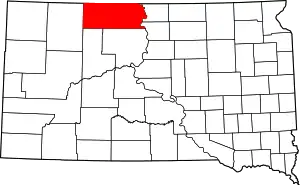 Location within the U.S. state of South Dakota | |
 South Dakota's location within the U.S. | |
| Coordinates: 45°43′N 101°11′W | |
| Country | |
| State | |
| Founded | 1909 |
| Named for | Dighton Corson |
| Seat | McIntosh |
| Largest city | McLaughlin |
| Area | |
| • Total | 2,530 sq mi (6,600 km2) |
| • Land | 2,470 sq mi (6,400 km2) |
| • Water | 60 sq mi (200 km2) 2.4% |
| Population (2010) | |
| • Total | 4,050 |
| • Estimate (2018) | 4,165 |
| • Density | 1.6/sq mi (0.62/km2) |
| Time zone | UTC−7 (Mountain) |
| • Summer (DST) | UTC−6 (MDT) |
| Congressional district | At-large |
| Website | corson |
The county is encompassed within the Standing Rock Indian Reservation, which extends into North Dakota. The Lakota people reside primarily in the South Dakota part of the reservation; the Yanktonai and Dakota live in that part in North Dakota. The Grand River, a tributary of the Missouri River, runs through the reservation.
Geography
Corson County lies on the north line of South Dakota. Its north boundary line abuts the south boundary line of the state of North Dakota. The Missouri River flows south-southeastward along its eastern boundary line. The county terrain consists of semi-arid rolling hills. A portion of the land is dedicated to agriculture.[3] The Grand River flows eastward through the central part of the county to discharge into the river, and Standing Cloud Creek flows eastward through the county's lower SW area. The terrain generally slopes to the east and south; its highest point is near its NW corner, at 2,582' (787m) ASL.[4]
Corson County has a total area of 2,530 square miles (6,600 km2), of which 2,470 square miles (6,400 km2) is land and 60 square miles (160 km2) (2.4%) is water.[5] It is the fifth-largest county in South Dakota by area. The entire county lies within the Standing Rock Indian Reservation, which also includes Sioux, Ziebach, and Dewey counties.
The eastern portion of South Dakota's counties (48 of 66) observe Central Time; the western counties (18 of 66) observe Mountain Time. Corson County is the easternmost of the SD counties to observe Mountain Time.[6]
Major highways
 U.S. Highway 12
 South Dakota Highway 20
 South Dakota Highway 63
 South Dakota Highway 65
 South Dakota Highway 1806
Adjacent counties
- Sioux County, North Dakota – north (eastern half of county observes Central Time)
- Campbell County – east (observes Central Time)
- Walworth County – southeast (observes Central Time)
- Dewey County – south
- Ziebach County – southwest
- Perkins County – west
- Adams County, North Dakota – northwest
Protected areas
- Grand River National Grassland (partial)
- C.C. Lee State Game Production Area
Demographics
| Historical population | |||
|---|---|---|---|
| Census | Pop. | %± | |
| 1910 | 2,929 | — | |
| 1920 | 7,249 | 147.5% | |
| 1930 | 9,535 | 31.5% | |
| 1940 | 6,755 | −29.2% | |
| 1950 | 6,168 | −8.7% | |
| 1960 | 5,798 | −6.0% | |
| 1970 | 4,994 | −13.9% | |
| 1980 | 5,196 | 4.0% | |
| 1990 | 4,195 | −19.3% | |
| 2000 | 4,181 | −0.3% | |
| 2010 | 4,050 | −3.1% | |
| 2019 (est.) | 4,086 | [7] | 0.9% |
| US Decennial Census[8] 1790-1960[9] 1900-1990[10] 1990-2000[11] 2010-2018[1] | |||
2000 census
As of the 2000 United States Census,[12] there were 4,181 people, 1,271 households, and 949 families in the county. The population density was 1.7 people per square mile (0.7/km2). There were 1,536 housing units at an average density of 0.6 per square mile (0.2/km2). The racial makeup of the county was 60.80% Native American, 37.19% White, 0.10% Black or African American, 0.05% Asian, 0.22% from other races, and 1.65% from two or more races. 2.13% of the population were Hispanic or Latino of any race. 27.3% were of German ancestry.
There were 1,271 households, out of which 38.3% had children under the age of 18 living with them, 46.8% were married couples living together, 19.7% had a female householder with no husband present, and 25.3% were non-families. 22.1% of all households were made up of individuals, and 10.0% had someone living alone who was 65 years of age or older. The average household size was 3.29 and the average family size was 3.82.
The county population contained 36.9% under the age of 18, 9.8% from 18 to 24, 24.3% from 25 to 44, 18.5% from 45 to 64, and 10.5% who were 65 years of age or older. The median age was 28 years. For every 100 females there were 102.0 males. For every 100 females age 18 and over, there were 100.8 males.
The median income for a household in the county was $20,654, and the median income for a family was $23,889. Males had a median income of $22,717 versus $19,609 for females. The per capita income for the county was $8,615. About 32.80% of families and 41.00% of the population were below the poverty line, including 48.60% of those under age 18 and 32.70% of those age 65 or over. The county's per-capita income makes it one of the poorest counties in the United States.
2010 census
As of the 2010 United States Census, there were 4,050 people, 1,260 households, and 939 families in the county.[13] The population density was 1.6 inhabitants per square mile (0.62/km2). There were 1,540 housing units at an average density of 0.6 per square mile (0.23/km2).[14] The racial makeup of the county was 67.0% American Indian, 29.7% white, 0.3% Asian, 0.1% black or African American, 0.3% from other races, and 2.6% from two or more races. Those of Hispanic or Latino origin made up 2.6% of the population.[13] In terms of ancestry,[15]
Of the 1,260 households, 45.6% had children under the age of 18 living with them, 40.6% were married couples living together, 21.9% had a female householder with no husband present, 25.5% were non-families, and 22.7% of all households were made up of individuals. The average household size was 3.21 and the average family size was 3.73. The median age was 29.7 years.[13]
The median income for a household in the county was $30,877 and the median income for a family was $36,500. Males had a median income of $32,037 versus $23,167 for females. The per capita income for the county was $13,359. About 24.1% of families and 35.1% of the population were below the poverty line, including 46.7% of those under age 18 and 16.9% of those age 65 or over.[16]
Communities
Cities
- McIntosh (county seat)
- McLaughlin
Town
Census-designated places
Unincorporated communities
Townships
- Custer
- Delaney
- Lake
- Mission
- Pleasant Ridge
- Prairie View
- Ridgeland
- Rolling Green
- Sherman
- Wakpala
- Watauga
Unorganized territories
- Central Corson
- Lemmon No. 2
- Northeast Corson
- West Corson
Politics
Like Ziebach County, and unlike the arch-Republican white West River counties, Corson is a competitive, fluctuating swing county. It voted Democratic in the three elections from 2004 to 2012 – doing so by over twenty percentage points for Barack Obama in 2008 – but as with most Native American counties there was a substantial swing against Hillary Clinton in 2016.
| Year | Republican | Democratic | Third parties |
|---|---|---|---|
| 2020 | 50.4% 647 | 48.5% 622 | 1.1% 14 |
| 2016 | 50.0% 588 | 45.5% 535 | 4.4% 52 |
| 2012 | 42.9% 515 | 54.0% 648 | 3.1% 37 |
| 2008 | 38.1% 535 | 59.5% 837 | 2.4% 34 |
| 2004 | 41.8% 720 | 56.4% 972 | 1.9% 32 |
| 2000 | 50.6% 629 | 44.2% 549 | 5.2% 65 |
| 1996 | 41.0% 533 | 41.5% 539 | 17.5% 228 |
| 1992 | 38.6% 483 | 35.5% 444 | 25.9% 324 |
| 1988 | 49.0% 710 | 49.9% 722 | 1.1% 16 |
| 1984 | 54.5% 955 | 45.2% 792 | 0.3% 6 |
| 1980 | 66.5% 1,233 | 28.1% 522 | 5.4% 100 |
| 1976 | 46.4% 846 | 53.0% 967 | 0.6% 10 |
| 1972 | 58.3% 975 | 41.2% 689 | 0.5% 9 |
| 1968 | 55.2% 1,108 | 40.9% 821 | 4.0% 80 |
| 1964 | 43.8% 1,034 | 56.2% 1,328 | |
| 1960 | 54.1% 1,290 | 45.9% 1,093 | |
| 1956 | 55.6% 1,394 | 44.4% 1,112 | |
| 1952 | 69.0% 1,757 | 31.0% 789 | |
| 1948 | 49.6% 1,154 | 49.6% 1,154 | 0.7% 17 |
| 1944 | 56.2% 1,008 | 43.8% 786 | |
| 1940 | 56.3% 1,709 | 43.7% 1,328 | |
| 1936 | 42.7% 1,408 | 54.1% 1,781 | 3.2% 106 |
| 1932 | 27.2% 946 | 69.0% 2,403 | 3.9% 135 |
| 1928 | 56.9% 1,847 | 42.3% 1,374 | 0.7% 24 |
| 1924 | 56.5% 1,364 | 5.8% 140 | 37.7% 910 |
| 1920 | 60.9% 1,448 | 20.4% 484 | 18.8% 446 |
| 1916 | 42.2% 503 | 53.8% 641 | 4.0% 48 |
| 1912 | 44.3% 455 | 55.7% 573 |
References
- "State & County QuickFacts". United States Census Bureau. Archived from the original on July 9, 2011. Retrieved November 26, 2013.
- "Find a County". National Association of Counties. Archived from the original on May 31, 2011. Retrieved June 7, 2011.
- Corson County SD Google Maps (accessed 1 February 2019)
- ""Find an Altitude" Google Maps (accessed 1 February 2019)". Archived from the original on May 21, 2019. Retrieved February 1, 2019.
- "2010 Census Gazetteer Files". US Census Bureau. August 22, 2012. Retrieved March 23, 2015.
- Map of Time Zone Line through South Dakota (accessed 30 January 2019)
- "Annual Estimates of the Resident Population for Counties: April 1, 2010 to July 1, 2019". Retrieved April 10, 2020.
- "US Decennial Census". US Census Bureau. Retrieved March 23, 2015.
- "Historical Census Browser". University of Virginia Library. Retrieved March 23, 2015.
- Forstall, Richard L., ed. (March 27, 1995). "Population of Counties by Decennial Census: 1900 to 1990". US Census Bureau. Retrieved March 23, 2015.
- "Census 2000 PHC-T-4. Ranking Tables for Counties: 1990 and 2000" (PDF). US Census Bureau. April 2, 2001. Retrieved March 23, 2015.
- "U.S. Census website". US Census Bureau. Retrieved May 14, 2011.
- "Profile of General Population and Housing Characteristics: 2010 Demographic Profile Data". US Census Bureau. Archived from the original on February 13, 2020. Retrieved March 11, 2016.
- "Population, Housing Units, Area, and Density: 2010 - County". US Census Bureau. Archived from the original on February 13, 2020. Retrieved March 11, 2016.
- "Selected Social Characteristics in the US – 2006-2010 American Community Survey 5-Year Estimates". US Census Bureau. Archived from the original on February 13, 2020. Retrieved March 11, 2016.
- "Selected Economic Characteristics – 2006-2010 American Community Survey 5-Year Estimates". U.S. Census Bureau. Archived from the original on February 13, 2020. Retrieved March 11, 2016.
- Miscol SD Google Maps (accessed 1 February 2019)
- Leip, David. "Atlas of US Presidential Elections". uselectionatlas.org. Retrieved April 13, 2018.
Places adjacent to Corson County, South Dakota | ||||||||||
|---|---|---|---|---|---|---|---|---|---|---|
| ||||||||||
Municipalities and communities of Corson County, South Dakota, United States | ||
|---|---|---|
| Cities | | |
| Town | ||
| CDPs | ||
| Unincorporated communities | ||
| Indian reservation | ||
| Ghost town | ||
| Footnotes | ‡This populated place also has portions in an adjacent county or counties | |
| ||

| Authority control |
|---|