Jackson County, South Dakota
Jackson County is a county in the U.S. state of South Dakota. As of the 2010 census, the population was 3,031.[1] Its county seat is Kadoka.[2] The county was created in 1883, and was organized in 1915.[3] Washabaugh County was merged into Jackson County in 1983.[4]
Jackson County | |
|---|---|
 | |
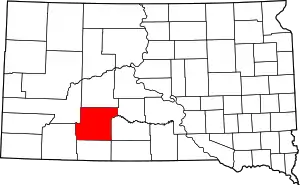 Location within the U.S. state of South Dakota | |
 South Dakota's location within the U.S. | |
| Coordinates: 43°42′N 101°38′W | |
| Country | |
| State | |
| Founded | 1883 (created) 1915 (organized) |
| Seat | Kadoka |
| Largest community | Wanblee |
| Area | |
| • Total | 1,871 sq mi (4,850 km2) |
| • Land | 1,864 sq mi (4,830 km2) |
| • Water | 7.4 sq mi (19 km2) 0.4% |
| Population (2010) | |
| • Total | 3,031 |
| • Estimate (2018) | 3,307 |
| • Density | 1.6/sq mi (0.63/km2) |
| Time zone | UTC−7 (Mountain) |
| • Summer (DST) | UTC−6 (MDT) |
| Congressional district | At-large |
| Washabaugh County was merged into Jackson County in 1983 | |

Geography
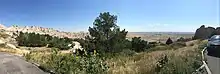
The terrain of Jackson County consists of mountains rising from rolling hills. The ground is arid and carved with drainages. The White River flows eastward, cutting a meandering channel through the central part.[5] The terrain generally slopes to the NE; its highest point is a ridge near the SW corner, at 3,274' (998m) ASL.[6]
Jackson County has a total area of 1,871 square miles (4,850 km2), of which 1,864 square miles (4,830 km2) is land and 7.4 square miles (19 km2) (0.4%) is water.[7] About 57 percent of its land, the portion south of White River, is on the Pine Ridge Indian Reservation. The county includes the easternmost portion of Badlands National Park.
The eastern portion of South Dakota's counties (48 of 66) observe Central Time; the western counties (18 of 66) observe Mountain Time. Jackson County is the easternmost of the SD counties to observe Mountain Time.[8]
Major highways
Adjacent counties
- Haakon County - north
- Jones County - northeast (observes Central Time)
- Mellette County - east (observes Central Time)
- Todd County[5] - southeast (observes Central Time)
- Bennett County - south
- Oglala Lakota County - southwest
- Pennington County - northwest
Lakes[5]
- Kadoka Lake
- Wanblee Lake
National protected areas
- Badlands National Park (part)
- Buffalo Gap National Grassland (part)
- Minuteman Missile National Historic Site (part)
Demographics
| Historical population | |||
|---|---|---|---|
| Census | Pop. | %± | |
| 1920 | 2,472 | — | |
| 1930 | 2,636 | 6.6% | |
| 1940 | 1,955 | −25.8% | |
| 1950 | 1,768 | −9.6% | |
| 1960 | 1,985 | 12.3% | |
| 1970 | 1,531 | −22.9% | |
| 1980 | 3,437 | 124.5% | |
| 1990 | 2,811 | −18.2% | |
| 2000 | 2,930 | 4.2% | |
| 2010 | 3,031 | 3.4% | |
| 2019 (est.) | 3,344 | [9] | 10.3% |
| US Decennial Census[10] 1790-1960[11] 1900-1990[12] 1990-2000[13] 2010-2018[1] | |||
2000 census
As of the 2000 United States Census,[14] there were 2,930 people, 945 households, and 675 families living in the county. The population density was 2 people per square mile (1/km2). There were 1,173 housing units at an average density of 0.6 per square mile (0.2/km2). The racial makeup of the county was 50.07% White, 0.03% Black or African American, 47.85% Native American, 0.03% Asian, 0.03% Pacific Islander, 0.14% from other races, and 1.84% from two or more races. 0.41% of the population were Hispanic or Latino of any race.
There were 945 households, out of which 38.60% had children under the age of 18 living with them, 51.40% were married couples living together, 14.70% had a female householder with no husband present, and 28.50% were non-families. 25.20% of all households were made up of individuals, and 11.90% had someone living alone who was 65 years of age or older. The average household size was 3.08 and the average family size was 3.73.
The county population contained 36.50% under the age of 18, 8.00% from 18 to 24, 23.60% from 25 to 44, 20.30% from 45 to 64, and 11.60% who were 65 years of age or older. The median age was 31 years. For every 100 females there were 98.80 males. For every 100 females age 18 and over, there were 95.40 males.
The median income for a household in the county was $23,945, and the median income for a family was $25,161. Males had a median income of $22,460 versus $17,895 for females. The per capita income for the county was $9,981. About 29.50% of families and 36.50% of the population were below the poverty line, including 46.10% of those under age 18 and 20.10% of those age 65 or over. The county's per-capita income makes it one of the poorest counties in the United States.
2010 census
As of the 2010 United States Census, there were 3,031 people, 996 households, and 703 families living in the county.[15] The population density was 1.6 inhabitants per square mile (0.62/km2). There were 1,193 housing units at an average density of 0.6 per square mile (0.23/km2).[16] The racial makeup of the county was 52.0% American Indian, 42.7% white, 0.2% black or African American, 0.2% from other races, and 4.8% from two or more races. Those of Hispanic or Latino origin made up 1.3% of the population.[15] In terms of ancestry, 20.7% were German, 12.3% were Irish, 10.1% were Norwegian, 5.7% were English, and 0.2% were American.[17]
Of the 996 households, 40.2% had children under the age of 18 living with them, 45.8% were married couples living together, 16.2% had a female householder with no husband present, 29.4% were non-families, and 26.2% of all households were made up of individuals. The average household size was 3.00 and the average family size was 3.65. The median age was 31.5 years.[15]
The median income for a household in the county was $36,354 and the median income for a family was $41,838. Males had a median income of $32,377 versus $25,000 for females. The per capita income for the county was $14,568. About 20.6% of families and 30.0% of the population were below the poverty line, including 35.9% of those under age 18 and 5.6% of those age 65 or over.[18]
Communities
City
- Kadoka (county seat)
Towns
- Belvidere (Population:49)
- Cottonwood (Population:9)
- Interior (Population:94)
Census-designated place
- Wanblee (Population:725)
Unincorporated communities[5]
- Cactus Flat
- Hisle
- Long Valley
- Potato Creek
- Stamford
- Weta
Townships
- Grandview II
- Interior
- Jewett
- Wall
- Weta
Unorganized territories
- East Jackson
- Northwest Jackson
- Southeast Jackson
- Southwest Jackson
Politics
Jackson County voters have been reliably Republican for decades. In only one national election since 1936 has the county selected the Democratic Party candidate (as of 2016).
| Year | Republican | Democratic | Third parties |
|---|---|---|---|
| 2020 | 66.2% 738 | 32.2% 359 | 1.6% 18 |
| 2016 | 65.9% 722 | 29.5% 323 | 4.6% 50 |
| 2012 | 59.8% 661 | 38.5% 426 | 1.7% 19 |
| 2008 | 59.0% 668 | 38.4% 435 | 2.7% 30 |
| 2004 | 57.1% 726 | 40.0% 508 | 2.9% 37 |
| 2000 | 66.1% 687 | 30.7% 319 | 3.3% 34 |
| 1996 | 55.3% 646 | 36.2% 423 | 8.6% 100 |
| 1992 | 53.7% 627 | 30.1% 351 | 16.3% 190 |
| 1988 | 58.8% 671 | 39.4% 450 | 1.8% 20 |
| 1984 | 70.8% 903 | 28.6% 365 | 0.6% 7 |
| 1980 | 68.7% 929 | 26.2% 354 | 5.1% 69 |
| 1976 | 61.5% 532 | 36.2% 313 | 2.3% 20 |
| 1972 | 68.7% 581 | 30.9% 261 | 0.5% 4 |
| 1968 | 56.8% 480 | 31.6% 267 | 11.6% 98 |
| 1964 | 48.3% 448 | 51.7% 480 | |
| 1960 | 61.4% 581 | 38.7% 366 | |
| 1956 | 54.6% 490 | 45.4% 408 | |
| 1952 | 70.5% 607 | 29.5% 254 | |
| 1948 | 56.4% 432 | 41.9% 321 | 1.7% 13 |
| 1944 | 61.5% 340 | 38.5% 213 | |
| 1940 | 58.8% 620 | 41.2% 435 | |
| 1936 | 43.6% 481 | 53.7% 593 | 2.7% 30 |
| 1932 | 37.1% 499 | 60.4% 812 | 2.5% 33 |
| 1928 | 62.6% 704 | 37.1% 417 | 0.3% 3 |
| 1924 | 56.9% 583 | 19.0% 194 | 24.1% 247 |
| 1920 | 70.6% 595 | 24.4% 206 | 5.0% 42 |
| 1916 | 49.4% 283 | 48.7% 279 | 1.9% 11 |
See also
| Wikimedia Commons has media related to Jackson County, South Dakota. |
References
- "State & County QuickFacts". United States Census Bureau. Archived from the original on June 7, 2011. Retrieved November 25, 2013.
- "Find a County". National Association of Counties. Archived from the original on May 31, 2011. Retrieved June 7, 2011.
- "Dakota Territory, South Dakota, and North Dakota: Individual County Chronologies". Dakota Territory Atlas of Historical County Boundaries. The Newberry Library. 2006. Retrieved March 30, 2015.
- John H. Long, Editor (2006). "Dakota Territory, South Dakota, and North Dakota: Individual County Chronologies". Dakota Territory Atlas of Historical County Boundaries. Newberry Library. Archived from the original on November 13, 2007. Retrieved July 18, 2008.
- Jackson County SD Google Maps (accessed 4 February 2019)
- ""Find an Altitude" Google Maps (accessed 4 February 2019)". Archived from the original on May 21, 2019. Retrieved February 4, 2019.
- "2010 Census Gazetteer Files". US Census Bureau. August 22, 2012. Retrieved March 26, 2015.
- Map of Time Zone Line through South Dakota (accessed 30 January 2019)
- "Annual Estimates of the Resident Population for Counties: April 1, 2010 to July 1, 2019". Retrieved April 10, 2020.
- "US Decennial Census". US Census Bureau. Retrieved March 26, 2015.
- "Historical Census Browser". University of Virginia Library. Retrieved March 26, 2015.
- Forstall, Richard L., ed. (March 27, 1995). "Population of Counties by Decennial Census: 1900 to 1990". US Census Bureau. Retrieved March 26, 2015.
- "Census 2000 PHC-T-4. Ranking Tables for Counties: 1990 and 2000" (PDF). US Census Bureau. April 2, 2001. Retrieved March 26, 2015.
- "U.S. Census website". US Census Bureau. Retrieved May 14, 2011.
- "Profile of General Population and Housing Characteristics: 2010 Demographic Profile Data". US Census Bureau. Archived from the original on February 13, 2020. Retrieved March 12, 2016.
- "Population, Housing Units, Area, and Density: 2010 - County". US Census Bureau. Archived from the original on February 13, 2020. Retrieved March 12, 2016.
- "Selected Social Characteristics in the US – 2006-2010 American Community Survey 5-Year Estimates". US Census Bureau. Archived from the original on February 13, 2020. Retrieved March 12, 2016.
- "Selected Economic Characteristics – 2006-2010 American Community Survey 5-Year Estimates". US Census Bureau. Archived from the original on February 13, 2020. Retrieved March 12, 2016.
- Leip, David. "Atlas of US Presidential Elections". uselectionatlas.org. Retrieved April 15, 2018.
Places adjacent to Jackson County, South Dakota | ||||||||||
|---|---|---|---|---|---|---|---|---|---|---|
| ||||||||||
Municipalities and communities of Jackson County, South Dakota, United States | ||
|---|---|---|
| City | | |
| Towns | ||
| CDP | ||
| Former CDP | ||
| Unincorporated communities | ||
| Indian reservation | ||
| Ghost town | ||
| Footnotes | ‡This populated place also has portions in an adjacent county or counties | |
| ||
