Buffalo County, South Dakota
Buffalo County is a county in the U.S. state of South Dakota. As of the 2010 census, the population was 1,912.[1] Its county seat is Gann Valley[2] which, at 14 people, is the least populous county seat in the United States. The county was created in 1864, and was organized in 1871[3] as part of the Dakota Territory.
Buffalo County | |
|---|---|
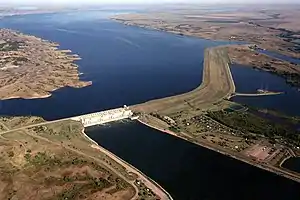 Fort Thompson Big Bend Dam. | |
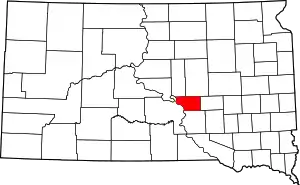 Location within the U.S. state of South Dakota | |
 South Dakota's location within the U.S. | |
| Coordinates: 44°05′N 99°12′W | |
| Country | |
| State | |
| Founded | 1864 (created) 1871 (organized) |
| Named for | American buffalo |
| Seat | Gann Valley |
| Largest community | Fort Thompson |
| Area | |
| • Total | 488 sq mi (1,260 km2) |
| • Land | 471 sq mi (1,220 km2) |
| • Water | 16 sq mi (40 km2) 3.4% |
| Population (2010) | |
| • Total | 1,912 |
| • Estimate (2018) | 2,036 |
| • Density | 3.9/sq mi (1.5/km2) |
| Time zone | UTC−6 (Central) |
| • Summer (DST) | UTC−5 (CDT) |
| Congressional district | At-large |
In 2010, the center of population of South Dakota was located in eastern Buffalo County.[4] The Crow Creek Indian Reservation, inhabited by the Crow Creek Sioux Tribe makes up the majority of Buffalo County.
According to the 2013 Small Area Income and Poverty Estimates (SAIPE) of the US Census Bureau, about 41% of county residents live in poverty, making it the fifth-poorest county in South Dakota. This is a far higher poverty rate than the national poverty rate of 15.8%. Median household income in 2013 was $21,572, making it the lowest-earning county in South Dakota and the United States.[5]
In March 2019, the county unemployment rate was 3.9%; its ten-year peaks occurred in December 2006 (18.1%) and December 2009 (17.2%).[6] As of 2002, many homes lack kitchens and indoor plumbing.[7]
Geography
The Missouri River flows southerly along the county's western boundary. The county terrain consists of semi-arid rolling hills, generally sloping to the south and east. Some area is devoted to agriculture. The south and west parts of the county are drained by Crow Creek, which discharges into the river at the county's SW corner. The county has a total area of 488 square miles (1,260 km2), of which 471 square miles (1,220 km2) is land and 16 square miles (41 km2) (3.4%) is water.[8]
Major highways
Adjacent counties
- Hand County – northeast
- Jerauld County – east
- Brule County – south
- Lyman County – west
- Hyde County – northwest
Protected Areas
- Pease State Game Production Area
Lakes
- Bedashosha Lake
- Lake Francis Case (part)
- Lake Sharpe (part)
History
As first organized, the county occupied an extensive area, bounded on the north by Canada, southwest and west by the Missouri River, having Montana for a part of its northwest boundary, and comprising a large portion of the “Plateau du Coteau du Missouri,” and a part of the Miniwakan or Devil's Lake.[9] Thus its original boundary also contained a portion of the future North Dakota, which became a separate unit when the Dakota Territory was admitted into the Union in 1889 as two separate states.
Demographics
| Historical population | |||
|---|---|---|---|
| Census | Pop. | %± | |
| 1870 | 246 | — | |
| 1880 | 63 | −74.4% | |
| 1890 | 993 | 1,476.2% | |
| 1900 | 1,790 | 80.3% | |
| 1910 | 1,589 | −11.2% | |
| 1920 | 1,715 | 7.9% | |
| 1930 | 1,931 | 12.6% | |
| 1940 | 1,853 | −4.0% | |
| 1950 | 1,615 | −12.8% | |
| 1960 | 1,547 | −4.2% | |
| 1970 | 1,739 | 12.4% | |
| 1980 | 1,795 | 3.2% | |
| 1990 | 1,759 | −2.0% | |
| 2000 | 2,032 | 15.5% | |
| 2010 | 1,912 | −5.9% | |
| 2019 (est.) | 1,962 | [10] | 2.6% |
| US Decennial Census[11] 1790-1960[12] 1900-1990[13] 1990-2000[14] 2010-2018[1] | |||
2000 census
As of the 2000 United States Census,[15] there were 2,032 people, 526 households, and 422 families in the county. The population density was 4 people per square mile (2/km2). There were 602 housing units at an average density of 1.3 per square mile (0.5/km2). The racial makeup of the county was 81.59% Native American, 16.34% White, 0.10% Black or African American, 0.30% from other races, and 1.67% from two or more races. 0.89% of the population were Hispanic or Latino of any race. 8.9% were of German ancestry.
There were 526 households, out of which 47.10% had children under the age of 18 living with them, 37.60% were married couples living together, 31.40% had a female householder with no husband present, and 19.80% were non-families. 16.00% of all households were made up of individuals, and 5.90% had someone living alone who was 65 years of age or older. The average household size was 3.83 and the average family size was 4.23.
The county population contains 41.30% under the age of 18, 11.00% from 18 to 24, 25.00% from 25 to 44, 16.10% from 45 to 64, and 6.50% who were 65 years of age or older. The median age was 23 years. For every 100 females there were 105.50 males. For every 100 females age 18 and over, there were 98 males.
The median income for a household in the county was $12,692, and the median income for a family was $14,167. Males had a median income of $18,650 versus $19,554 for females. The per capita income for the county was $5,213, the lowest in the nation. About 55.70% of families and 56.90% of the population were below the poverty line, including 61.50% of those under age 18 and 50.40% of those age 65 or over.
2010 census
As of the 2010 United States Census, there were 1,912 people, 532 households, and 407 families in the county.[16] The population density was 4.1 inhabitants per square mile (1.6/km2). There were 609 housing units at an average density of 1.3 per square mile (0.50/km2).[17] The racial makeup of the county was 84.0% Native American, 14.8% white, 0.2% black or African American, 0.1% Asian, 0.0% from other races, and 0.9% from two or more races. Those of Hispanic or Latino origin made up 1.8% of the population.[16] In terms of ancestry, 5.6% were German, and 0.0% were American.[18]
Of the 532 households, 55.6% had children under the age of 18 living with them, 33.1% were married couples living together, 33.1% had a female householder with no husband present, 23.5% were non-families, and 19.0% of all households were made up of individuals. The average household size was 3.59 and the average family size was 4.06. The median age was 25.0 years.[16]
The median income for a household in the county was $27,926 and the median income for a family was $28,333. Males had a median income of $38,920 versus $18,542 for females. The per capita income for the county was $11,410. About 44.4% of families and 49.3% of the population were below the poverty line, including 58.2% of those under age 18 and 36.3% of those age 65 or over.[19]
Communities
- Gann Valley (county seat; census-designated place)
- Fort Thompson (census-designated place)
- Crow Creek[20]
- North Buffalo[21]
- Shelby[22]
- Southeast Buffalo[23]
Township
- Elvira
Politics
In 2016, Hillary Clinton won the votes in Buffalo County due to support from Native Americans. Democratic Party nominees have won every presidential election since 1956 except the 1980 and 1984 elections which Ronald Reagan won.
| Year | Republican | Democratic | Third parties |
|---|---|---|---|
| 2016 | 34.9% 171 | 60.4% 296 | 4.7% 23 |
| 2012 | 25.9% 166 | 73.6% 472 | 0.5% 3 |
| 2008 | 25.2% 156 | 73.3% 454 | 1.5% 9 |
| 2004 | 26.5% 223 | 71.7% 603 | 1.8% 15 |
| 2000 | 34.3% 140 | 62.8% 256 | 2.9% 12 |
| 1996 | 20.9% 134 | 72.7% 465 | 6.4% 41 |
| 1992 | 27.6% 137 | 56.9% 282 | 15.5% 77 |
| 1988 | 30.8% 151 | 68.2% 334 | 1.0% 5 |
| 1984 | 51.2% 253 | 47.8% 236 | 1.0% 5 |
| 1980 | 59.7% 272 | 32.2% 147 | 8.1% 37 |
| 1976 | 44.7% 194 | 55.3% 240 | |
| 1972 | 44.5% 221 | 55.3% 275 | 0.2% 1 |
| 1968 | 47.1% 261 | 47.8% 265 | 5.1% 28 |
| 1964 | 35.7% 278 | 64.3% 501 | |
| 1960 | 46.8% 294 | 53.2% 334 | |
| 1956 | 49.7% 314 | 50.3% 318 | |
| 1952 | 61.5% 413 | 38.5% 259 | |
| 1948 | 48.0% 313 | 51.2% 334 | 0.8% 5 |
| 1944 | 56.5% 324 | 43.6% 250 | |
| 1940 | 55.4% 491 | 44.6% 395 | |
| 1936 | 46.3% 368 | 51.6% 410 | 2.1% 17 |
| 1932 | 29.6% 270 | 69.6% 634 | 0.8% 7 |
| 1928 | 51.0% 405 | 48.7% 387 | 0.3% 2 |
| 1924 | 41.5% 309 | 30.2% 225 | 28.2% 210 |
| 1920 | 59.7% 200 | 30.2% 101 | 10.2% 34 |
| 1916 | 30.2% 80 | 68.7% 182 | 1.1% 3 |
| 1912 | 0.0% 0 | 53.9% 105 | 46.2% 90 |
| 1908 | 59.0% 105 | 38.8% 69 | 2.3% 4 |
| 1904 | 60.5% 118 | 22.1% 43 | 17.4% 34 |
| 1900 | 46.3% 87 | 53.2% 100 | 0.5% 1 |
| 1896 | 46.3% 68 | 53.7% 79 | |
| 1892 | 50.7% 78 | 8.4% 13 | 40.9% 63 |
See also
| Wikimedia Commons has media related to Buffalo County, South Dakota. |
Further reading
- "Buffalo County". South Dakota Magazine. Part of a series on South Dakota counties.
References
- "State & County QuickFacts". United States Census Bureau. Archived from the original on July 7, 2011. Retrieved November 26, 2013.
- "Find a County". National Association of Counties. Archived from the original on May 31, 2011. Retrieved June 7, 2011.
- "Dakota Territory, South Dakota, and North Dakota: Individual County Chronologies". Dakota Territory Atlas of Historical County Boundaries. The Newberry Library. 2006. Retrieved March 28, 2015.
- "Centers of Population by State: 2010". US Census Bureau. Archived from the original on January 3, 2014. Retrieved April 25, 2014.
- 2013 Small Area Income and Poverty Estimates, Interactive SAIPE Data and Mapping Tool, Bureau of the Census.
- Unemployment Rate in Buffalo County, SD, Federal Reserve Economic Data, Federal Reserve Bank of St. Louis.
- Cara Hetland, South Dakota has nation's poorest county, Minnesota Public Radio (October 1, 2002).
- "2010 Census Gazetteer Files". US Census Bureau. August 22, 2012. Retrieved March 22, 2015.
- One or more of the preceding sentences incorporates text from a publication now in the public domain: Ripley, George; Dana, Charles A., eds. (1879). . The American Cyclopædia.
- "Annual Estimates of the Resident Population for Counties: April 1, 2010 to July 1, 2019". Retrieved April 10, 2020.
- "US Decennial Census". US Census Bureau. Retrieved March 22, 2015.
- "Historical Census Browser". University of Virginia Library. Retrieved March 22, 2015.
- Forstall, Richard L., ed. (March 27, 1995). "Population of Counties by Decennial Census: 1900 to 1990". US Census Bureau. Retrieved March 22, 2015.
- "Census 2000 PHC-T-4. Ranking Tables for Counties: 1990 and 2000" (PDF). US Census Bureau. April 2, 2001. Retrieved March 22, 2015.
- "U.S. Census website". US Census Bureau. Retrieved May 14, 2011.
- "Profile of General Population and Housing Characteristics: 2010 Demographic Profile Data". US Census Bureau. Archived from the original on February 13, 2020. Retrieved March 11, 2016.
- "Population, Housing Units, Area, and Density: 2010 - County". US Census Bureau. Archived from the original on February 13, 2020. Retrieved March 11, 2016.
- "Selected Social Characteristics in the US – 2006-2010 American Community Survey 5-Year Estimates". US Census Bureau. Archived from the original on February 13, 2020. Retrieved March 11, 2016.
- "DP03 SELECTED ECONOMIC CHARACTERISTICS – 2006-2010 American Community Survey 5-Year Estimates". US Census Bureau. Archived from the original on February 13, 2020. Retrieved March 11, 2016.
- Crow Creek SD Google Maps (accessed 31 January 2019)
- North Buffalo SD Google Maps (accessed 31 January 2019)
- Shelby SD Google Maps (accessed 31 January 2019)
- Southeast Buffalo SD Google Maps (accessed 31 January 2019)
- Leip, David. "Atlas of US Presidential Elections". uselectionatlas.org. Retrieved April 13, 2018.
Places adjacent to Buffalo County, South Dakota | ||||||||||
|---|---|---|---|---|---|---|---|---|---|---|
| ||||||||||
Municipalities and communities of Buffalo County, South Dakota, United States | ||
|---|---|---|
| CDP | | |
| Unincorporated community | ||
| Township |
| |
| Unorganized territories |
| |
| Indian reservation | ||
| Footnotes | ‡This populated place also has portions in an adjacent county or counties | |
| ||
