Bennett County, South Dakota
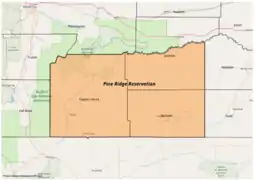
Bennett County is a county in the U.S. state of South Dakota. As of the 2010 census, the population was 3,431.[1] Its county seat is Martin.[2] The county lies completely within the boundaries of the Pine Ridge Indian Reservation.[3] To the east is the Rosebud Indian Reservation, occupied by Sicangu Oyate, also known the Upper Brulé Sioux Nation and the Rosebud Sioux Tribe (RST), a branch of the Lakota people.
Bennett County | |
|---|---|
_from_S_1.JPG.webp) Art Deco style Inland Theater at Martin SD. | |
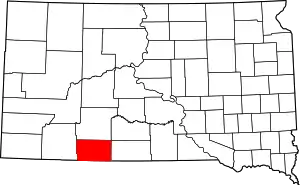 Location within the U.S. state of South Dakota | |
 South Dakota's location within the U.S. | |
| Coordinates: 43°11′N 101°40′W | |
| Country | |
| State | |
| Founded | 1909 (created) April 27, 1912 (organized) |
| Named for | John E. Bennett or Granville G. Bennett |
| Seat | Martin |
| Largest city | Martin |
| Area | |
| • Total | 1,191 sq mi (3,080 km2) |
| • Land | 1,185 sq mi (3,070 km2) |
| • Water | 5.8 sq mi (15 km2) 0.5% |
| Population (2010) | |
| • Total | 3,431 |
| • Estimate (2018) | 3,468 |
| • Density | 2.9/sq mi (1.1/km2) |
| Time zone | UTC−7 (Mountain) |
| • Summer (DST) | UTC−6 (MDT) |
| Congressional district | At-large |
The North American continental pole of inaccessibility is in Bennett County, located 1650 km (1024 mi) from the nearest coastline, between Allen and Kyle (Oglala Lakota County) at 43.36°N 101.97°W.[4]
Historically, ranching and dry land farming have been the chief agricultural pursuits possible given climate and soil conditions.
History
This land has for centuries been the traditional territory of the Oglala Lakota, also known as the Sioux; it has been part of their legally defined territory since the treaty of 1851 and has remained within its legal boundaries through various other Treaties and Acts that reduced their land base to the current boundaries of the Pine Ridge Indian Reservation when the reservation was created by the Act of March 2, 1889 (25 Stat. 888).[5] Despite its reservation status, most of the county was opened for settlement by the Act of May 27, 1910, where the US Congress "authorized and directed the Secretary of Interior to sell and dispose of all that portion of the Pine Ridge Indian Reservation, in the State of South Dakota, lying and being in Bennett County". Open settlement was ended by a Secretarial Order of June 10, 1936, which restored "to tribal ownership of all lands which are now, or may hereafter be, classified as undisposed-of surplus opened lands of the Pine Ridge Reservation...."[6]
The county was created in 1909, with land partitioned from Fall River County.[7] On April 27, 1912, the county's first board of commissioners was elected. In November 1912, residents chose the town of Martin as the county seat.
Dispute Over Reservation Status
A 1975 decision of the Eighth Circuit Court decided that Bennett County was not to be considered part of the Pine Ridge Reservation. However, the federal government participated in that lawsuit only as amicus, and did not consider itself bound by that decision because it did not participate in the litigation. The United States was a party in United States v. Bennett County, 394 F.2d 8 (8th Cir. 1968), in which the State of South Dakota had to obtain permission from the Department of the Interior in order to fix roads or condemn property in Bennett County, consistent with the property's reservation status.[8] Putnam v. United States 248 F.2d 292 (8th Cir. 1957) ruled that "Bennett County is within the Pine Ridge Indian Reservation created by the Act of Congress of March 2, 1889, 25 Stat. 888." The Federal Government recognizes Bennett County as being entirely within the Pine Ridge Indian Reservation. In 2004, in State of South Dakota v. Acting Great Plains Regional Director, Bureau of Indian Affairs Docket Number IBIA3-24-A the State of South Dakota argued against an Oglala Sioux Tribal member's application to the BIA to return a 10-acre tract of land in Bennett County into Federal Trust arguing it was outside of the Boundary of the Pine Ridge Reservation. The judge ruled in favor of the applicant and Bureau of Indian Affairs' affirming that Bennett County is indeed within the boundaries of the Reservation.[9]
Native/Non-Native Relations
Both Lakota and European Americans have worked during recent decades to improve relations between the groups, which residents commonly refer to as full-bloods, mixed-bloods (usually both identified as Native American) and whites. Intermarriage continues between the groups and cooperation has been increasing.[10] In the mid-1990s, residents co-sponsored a concurrent powwow and rodeo in the county. By the 1990s, people of Native American descent comprised the majority of county residents. In the 2000 Census, 5.7% of the people in Bennett County identified as mixed-race Native American-European American (more Lakota socially identify as having mixed-race ancestry). This is the highest percentage of any county within US boundaries, except northeastern Oklahoma and White Earth Indian Reservation in northwestern Minnesota.[11]
Bennett County was in national news in 2014 when the township of Swett was put up for sale. The township's two residents listed six acres and all property in the township for sale for nearly $400,000.[12] By 2016 the price had been reduced to $250,000, still with no takers.[13]
Geography
Bennett County lies on the south line of South Dakota. Its south boundary line abuts the north boundary line of the state of Nebraska. The Little White River flows eastward through the lower central part of the county.[14] The highest point on the county's terrain is the SW corner, at 3,497' (1066m) ASL. Its lowest point is along the north boundary line, at 2,703' (824m) ASL.[15] The terrain consists of rolling hills cut with drainage gullies, sloping to the east-northeast.
The county has a total area of 1,191 square miles (3,080 km2), of which 1,185 square miles (3,070 km2) is land and 5.8 square miles (15 km2) (0.5%) is water.[16]
The eastern portion of South Dakota's counties (48 of 66) observe Central Time; the western counties (18 of 66) observe Mountain Time. Bennett County is the easternmost of the SD counties to observe Mountain Time.[17]
Major highways
 U.S. Highway 18
 South Dakota Highway 73
Adjacent counties
- Jackson County - north
- Mellette County – northeast (boundary of Central Time)
- Todd County - east (boundary of Central Time)
- Cherry County, Nebraska - south (eastern part of county observes Central Time)
- Sheridan County, Nebraska – southwest
- Oglala Lakota County - west
Protected areas
- Lacreek National Wildlife Refuge
- Little White River Recreation Area[18]
- Little White River State Game Production Area
- Todd State Game Production Area
Demographics
| Historical population | |||
|---|---|---|---|
| Census | Pop. | %± | |
| 1910 | 96 | — | |
| 1920 | 1,924 | 1,904.2% | |
| 1930 | 4,590 | 138.6% | |
| 1940 | 3,983 | −13.2% | |
| 1950 | 3,396 | −14.7% | |
| 1960 | 3,053 | −10.1% | |
| 1970 | 3,088 | 1.1% | |
| 1980 | 3,044 | −1.4% | |
| 1990 | 3,206 | 5.3% | |
| 2000 | 3,574 | 11.5% | |
| 2010 | 3,431 | −4.0% | |
| 2019 (est.) | 3,365 | [19] | −1.9% |
| US Decennial Census[20] 1790-1960[21] 1900-1990[22] 1990-2000[23] 2010-2018[1] | |||
2000 census
As of the 2000 United States Census,[24] there were 3,574 people, 1,123 households, and 818 families in the county. The population density was 3 people per square mile (1/km2). There were 1,278 housing units at an average density of 1.1 per square mile (0.4/km2). The racial makeup of the county was 40.91% White, 0.28% Black or African American, 52.07% Native American, 0.06% Asian, 0.14% Pacific Islander, 0.17% from other races, and 6.38% from two or more races. 2.01% of the population were Hispanic or Latino of any race. 14.2% were of German and 6.1% of Irish ancestry.
There were 1,123 households, out of which 39.70% had children under the age of 18 living with them, 48.60% were married couples living together, 17.50% had a female householder with no husband present, and 27.10% were non-families. 23.30% of all households were made up of individuals, and 10.20% had someone living alone who was 65 years of age or older. The average household size was 3.14 and the average family size was 3.74.
The county population contained 36.30% under the age of 18, 9.20% from 18 to 24, 25.30% from 25 to 44, 18.00% from 45 to 64, and 11.10% who were 65 years of age or older. The median age was 29 years. For every 100 females there were 98.30 males. For every 100 females age 18 and over, there were 93.90 males. The county's per-capita income makes it one of the poorest counties in the United States.
The median income for a household in the county was $25,313, and the median income for a family was $28,363. Males had a median income of $26,042 versus $17,472 for females. The per capita income for the county was $10,106. About 30.30% of families and 39.20% of the population were below the poverty line, including 48.80% of those under age 18 and 23.10% of those age 65 or over.
2010 census
As of the 2010 United States Census, there were 3,431 people, 1,090 households, and 766 families in the county.[25] The population density was 2.9 inhabitants per square mile (1.1/km2). There were 1,263 housing units at an average density of 1.1 per square mile (0.42/km2).[26] The racial makeup of the county was 61.5% American Indian, 33.7% white, 0.4% Asian, 0.1% Pacific islander, 0.1% black or African American, 0.2% from other races, and 4.0% from two or more races. Those of Hispanic or Latino origin made up 2.0% of the population.[25] In terms of ancestry, 20.9% were German, 5.1% were Swedish, and 1.9% were American.[27]
Of the 1,090 households, 42.9% had children under the age of 18 living with them, 40.3% were married couples living together, 20.1% had a female householder with no husband present, 29.7% were non-families, and 24.3% of all households were made up of individuals. The average household size was 3.11 and the average family size was 3.73. The median age was 28.7 years.[25]
The median income for a household in the county was $32,841 and the median income for a family was $38,487. Males had a median income of $40,158 versus $31,406 for females. The per capita income for the county was $16,153. About 24.3% of families and 32.1% of the population were below the poverty line, including 42.3% of those under age 18 and 15.4% of those age 65 or over.[28]
Communities
Cities
- Martin (county seat)
Census-designated places
Unincorporated communities
Former communities
Politics
Bennett is a solidly Republican county in Presidential elections. It has not been carried by a Democratic Presidential nominee since Lyndon Johnson’s landslide of 1964, although vis-à-vis most West River counties it has a sizeable Democratic vote due to its substantial Native American population, so that both John Kerry in 2004 and Barack Obama in 2008 – probably aided by local opposition to the “War on Terrorism” – came within five percentage points of carrying the county. However, as with most Native American counties, Bennett County was to show a substantial swing towards Donald Trump in 2016.
| Year | Republican | Democratic | Third parties |
|---|---|---|---|
| 2020 | 58.7% 694 | 39.4% 466 | 1.9% 23 |
| 2016 | 58.0% 666 | 35.9% 412 | 6.2% 71 |
| 2012 | 52.0% 626 | 45.6% 548 | 2.4% 29 |
| 2008 | 50.8% 614 | 46.1% 557 | 3.1% 37 |
| 2004 | 51.1% 833 | 46.6% 759 | 2.3% 38 |
| 2000 | 63.8% 712 | 33.8% 377 | 2.4% 27 |
| 1996 | 47.1% 539 | 44.3% 507 | 8.6% 99 |
| 1992 | 46.5% 556 | 34.5% 413 | 19.0% 228 |
| 1988 | 52.5% 663 | 45.9% 579 | 1.6% 20 |
| 1984 | 65.1% 856 | 34.4% 453 | 0.5% 7 |
| 1980 | 69.4% 919 | 26.4% 350 | 4.2% 55 |
| 1976 | 54.9% 610 | 43.3% 481 | 1.8% 20 |
| 1972 | 62.8% 808 | 37.0% 476 | 0.2% 2 |
| 1968 | 53.9% 665 | 37.1% 457 | 9.0% 111 |
| 1964 | 44.6% 624 | 55.4% 775 | |
| 1960 | 56.2% 779 | 43.8% 607 | |
| 1956 | 52.1% 746 | 47.9% 685 | |
| 1952 | 62.9% 873 | 37.2% 516 | |
| 1948 | 38.1% 477 | 60.5% 758 | 1.4% 17 |
| 1944 | 46.6% 494 | 53.4% 566 | |
| 1940 | 51.6% 915 | 48.5% 860 | |
| 1936 | 39.3% 530 | 59.8% 807 | 0.9% 12 |
| 1932 | 23.7% 453 | 73.9% 1,410 | 2.4% 45 |
| 1928 | 58.2% 766 | 41.3% 544 | 0.5% 7 |
| 1924 | 57.1% 444 | 13.1% 102 | 29.8% 232 |
| 1920 | 48.7% 220 | 44.0% 199 | 7.3% 33 |
| 1916 | 22.6% 67 | 74.8% 222 | 2.7% 8 |
| 1912 | 70.8% 179 | 29.3% 74 |
References
- "State & County QuickFacts". United States Census Bureau. Archived from the original on July 7, 2011. Retrieved November 26, 2013.
- "Find a County". National Association of Counties. Archived from the original on May 31, 2011. Retrieved June 7, 2011.
- Suzanne R. Schaeffer, Assistant Solicitor, Environment, Land and Minerals Branch, Division of Indian Affairs
- Garcia-Castellanos, D.; U. Lombardo (2007). "Poles of Inaccessibility: A Calculation Algorithm for the Remotest Places on Earth" (PDF). Scottish Geographical Journal. 123 (3): 227–233. doi:10.1080/14702540801897809. Archived from the original (PDF) on June 29, 2014. () - p. 231: "Region: America, North Longitude (deg. E.) -101.97 Latitude (deg. N.) 43.36 distance (km) 1639 uncertainty (km) +14 Altitude (m) 1030"
- Secretarial Order
- "Dakota Territory, South Dakota, and North Dakota: Individual County Chronologies". Dakota Territory Atlas of Historical County Boundaries. The Newberry Library. 2006. Retrieved March 28, 2015.
- Suzanne R. Schaeffer, Assistant Solicitor, Environment, Land and Minerals Branch, Division of Indian Affairs
- "State of South Dakota and Bennett County SD v. Acting Great Plains Regional Director BIA" (PDF). oha.doi.gov. October 3, 2018.
- Gwen Florio, "Indians Show Political Clout; Natives Throng Polls in 'White' SD County", The Denver Post, January 8, 2003, accessed June 8, 2011
- Sterling Fluharty, "Review of Wagoner, Paula L., 'They Treated Us Just Like Indians': The Worlds of Bennett County SD", H-AmIndian, H-Net Reviews, March 2004, accessed June 8, 2011
- "Buy a town: Swett, South Dakota for sale". Usatoday.com. Retrieved June 30, 2014.
- Saloon Included (accessed January 30, 2019)
- Bennett County SD Google Maps (accessed 30 January 2019)
- ""Find an Altitude" Google Maps (accessed 30 January 2019)". Archived from the original on May 21, 2019. Retrieved January 30, 2019.
- "2010 Census Gazetteer Files". US Census Bureau. August 22, 2012. Retrieved March 22, 2015.
- Map of Time Zone Line through South Dakota (accessed 30 January 2019)
- Little White River Recreation Area, Martin SD Google Maps (accessed 30 January 2019)
- "Annual Estimates of the Resident Population for Counties: April 1, 2010 to July 1, 2019". Retrieved April 10, 2020.
- "US Decennial Census". US Census Bureau. Retrieved March 22, 2015.
- "Historical Census Browser". University of Virginia Library. Retrieved March 22, 2015.
- Forstall, Richard L., ed. (March 27, 1995). "Population of Counties by Decennial Census: 1900 to 1990". US Census Bureau. Retrieved March 22, 2015.
- "Census 2000 PHC-T-4. Ranking Tables for Counties: 1990 and 2000" (PDF). US Census Bureau. April 2, 2001. Retrieved March 22, 2015.
- "U.S. Census website". US Census Bureau. Retrieved May 14, 2011.
- "Profile of General Population and Housing Characteristics: 2010 Demographic Profile Data". US Census Bureau. Archived from the original on February 13, 2020. Retrieved March 11, 2016.
- "Population, Housing Units, Area, and Density: 2010 - County". US Census Bureau. Archived from the original on February 13, 2020. Retrieved March 11, 2016.
- "Selected Social Characteristics in the US – 2006-2010 American Community Survey 5-Year Estimates". US Census Bureau. Archived from the original on February 13, 2020. Retrieved March 11, 2016.
- "Selected Economic Characteristics – 2006-2010 American Community Survey 5-Year Estimates". US Census Bureau. Archived from the original on February 13, 2020. Retrieved March 11, 2016.
- Leip, David. "Atlas of US Presidential Elections". uselectionatlas.org. Retrieved April 13, 2018.
Places adjacent to Bennett County, South Dakota | ||||||||||
|---|---|---|---|---|---|---|---|---|---|---|
| ||||||||||
Municipalities and communities of Bennett County, South Dakota, United States | ||
|---|---|---|
| City | | |
| CDP | ||
| Unorganized territories |
| |
| Unincorporated communities | ||
| Indian reservation | ||
| Footnotes | ‡This populated place also has portions in an adjacent county or counties | |
| ||
