St. John's East
St. John's East (French: St. John's-Est; formerly known as St. John's North) is a federal electoral district in Newfoundland and Labrador, Canada, that has been represented in the House of Commons of Canada since 1949.
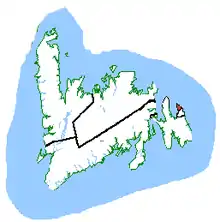 St. John's East in relation to other Newfoundland and Labrador ridings | |||
| Federal electoral district | |||
| Legislature | House of Commons | ||
| MP |
New Democratic | ||
| District created | 1949 | ||
| First contested | 1949 | ||
| Last contested | 2019 | ||
| District webpage | profile, map | ||
| Demographics | |||
| Population (2016)[1] | 85,697 | ||
| Electors (2019) | 66,063 | ||
| Area (km²)[1] | 363 | ||
| Pop. density (per km²) | 236.1 | ||
| Census division(s) | Division 1 | ||
| Census subdivision(s) | St. John's, Logy Bay-Middle Cove-Outer Cove, Paradise, Portugal Cove-St. Philip's, Subdivision 1R, Torbay, Wabana | ||
- For the provincial electoral district please see St. John's East (provincial electoral district) or St. John's North (provincial electoral district).
It covers a part of St. John's. For a brief period in 2003 and 2004, it was known as "St. John's North".[2]
In the 2019 federal election, former NDP MP Jack Harris defeated incumbent MP Nick Whalen in a rematch of the 2015 election.
Demographics
Ethnic groups: 97.2% White
Languages: 97.7% English, 1.9% Other
Religions: 47.1% Catholic, 46.0% Protestant, 4.9% No affiliation
Average income: $28 969
Geography
The district includes the extreme northeastern part of the Avalon Peninsula including the northern half of the City of St. John's, and the eastern half of the Town of Conception Bay South. It also includes Bell Island, Little Bell Island and Kelly's Island.
The neighbouring ridings are Avalon and St. John's South—Mount Pearl.
According to Elections Canada, the geographic boundaries for this riding as of the 39th General Election are:
- "All that area consisting of:
- (a) the towns of Bauline, Flatrock, Logy Bay-Middle Cove-Outer Cove, Portugal Cove-St. Philip's, Pouch Cove, Torbay and Wabana;
- (b) that part of the Town of Paradise lying northeasterly and northerly of a line described as follows: commencing at the intersection of the easterly limit of the Town of Paradise with Topsail Road; thence generally westerly along said road to Paradise Road; thence generally northwesterly along said road to Camrose Drive; thence northerly along said drive to the northerly limit of said town; and
- (c) that part of the City of St. John's lying northwesterly of a line described as follows: commencing at the intersection of the westerly limit of the City of St. John's with Kenmount Road coincident with the northerly limit of the City of Mount Pearl; thence northeasterly and easterly along said road and Freshwater Road to Lemarchant Road; thence southerly along said road to Barter's Hill; thence generally southeasterly along Barter's Hill to Waldegrave Street; thence easterly and northeasterly along said street to Water Street; thence northerly and northeasterly along said street to Temperance Street; thence northwesterly along said street to Duckworth Street; thence northeasterly along said street to Signal Hill Road; thence northeasterly along said road to Cabot Avenue; thence northeasterly in a straight line to a point on Signal Hill at approximate latitude 47°34'31"N and longitude 52°41'21"W (on the northern boundary of the Johnson Geo Centre lot); thence due east in a straight line to the Atlantic Ocean."
See the map of the St. John's East riding.
History
The riding was created when Newfoundland joined Confederation in 1949 and has historically been a conservative stronghold. St. John's East was won by Liberal Bonnie Hickey in 1993 election, who was defeated by Progressive Conservative Norman Doyle in the 1997 election. Doyle held the riding for the PCs and then the Conservatives, but stood down in 2008 and was replaced in a landslide by New Democrat, Jack Harris. Harris held the riding until his defeat in the 2015 election by Nick Whalen. That result was considered one of the biggest surprises of the 2015 election.[3]
As of the 2012 electoral redistribution, 21% of this riding will be moved into Avalon, and it will gain 5% from St. John's South—Mount Pearl.
Members of Parliament
This riding has elected the following Members of Parliament:
| Parliament | Years | Member | Party | |
|---|---|---|---|---|
| St. John's East | ||||
| 21st | 1949–1953 | Gordon Higgins | Progressive Conservative | |
| 22nd | 1953–1957 | Allan Fraser | Liberal | |
| 23rd | 1957–1958 | James McGrath | Progressive Conservative | |
| 24th | 1958–1962 | |||
| 25th | 1962–1963 | |||
| 26th | 1963–1965 | Joseph O'Keefe | Liberal | |
| 27th | 1965–1968 | |||
| 28th | 1968–1972 | James McGrath | Progressive Conservative | |
| 29th | 1972–1974 | |||
| 30th | 1974–1979 | |||
| 31st | 1979–1980 | |||
| 32nd | 1980–1984 | |||
| 33rd | 1984–1986 | |||
| 1987–1988 | Jack Harris | New Democratic | ||
| 34th | 1988–1993 | Ross Reid | Progressive Conservative | |
| 35th | 1993–1997 | Bonnie Hickey | Liberal | |
| 36th | 1997–2000 | Norman Doyle | Progressive Conservative | |
| 37th | 2000–2003 | |||
| 2003–2004 | Conservative | |||
| St. John's North | ||||
| 38th | 2004–2006 | Norman Doyle | Conservative | |
| St. John's East | ||||
| 39th | 2006–2008 | Norman Doyle | Conservative | |
| 40th | 2008–2011 | Jack Harris | New Democratic | |
| 41st | 2011–2015 | |||
| 42nd | 2015–2019 | Nick Whalen | Liberal | |
| 43rd | 2019–present | Jack Harris | New Democratic | |
Election results
2019 general election
| 2019 Canadian federal election | ||||||||
|---|---|---|---|---|---|---|---|---|
| Party | Candidate | Votes | % | ±% | Expenditures | |||
| New Democratic | Jack Harris | 21,148 | 46.92 | +1.63 | none listed | |||
| Liberal | Nick Whalen | 14,962 | 33.20 | −13.53 | none listed | |||
| Conservative | Joedy Wall | 8,141 | 18.06 | +11.51 | $56,419.96 | |||
| Green | David Peters | 821 | 1.82 | +0.71 | $0.00 | |||
| Total valid votes/Expense limit | 45,072 | 100.0 | $101,886.12 | |||||
| Total rejected ballots | 528 | 1.16 | +0.91 | |||||
| Turnout | 45,600 | 69.03 | +0.34 | |||||
| Eligible voters | 66,063 | |||||||
| New Democratic gain from Liberal | Swing | +7.58 | ||||||
| Source: Elections Canada[4] | ||||||||
2015 general election
| 2015 Canadian federal election | ||||||||
|---|---|---|---|---|---|---|---|---|
| Party | Candidate | Votes | % | ±% | Expenditures | |||
| Liberal | Nick Whalen | 20,974 | 46.73 | +38.96 | $95,604.48 | |||
| New Democratic | Jack Harris | 20,328 | 45.29 | -25.36 | $112,858.54 | |||
| Conservative | Deanne Stapleton | 2,938 | 6.55 | -13.90 | $4,463.40 | |||
| Green | David Anthony Peters | 500 | 1.11 | -0.02 | $3,539.94 | |||
| Communist | Sean Burton | 140 | 0.31 | – | – | |||
| Total valid votes/Expense limit | 44,880 | 100.0 | $200,009.55 | |||||
| Total rejected ballots | 111 | 0.25 | –0.06 | |||||
| Turnout | 44,991 | 68.69 | +10.84 | |||||
| Eligible voters | 65,499 | |||||||
| Liberal gain from New Democratic | Swing | +32.16 | ||||||
| Source: Elections Canada[5][6] | ||||||||
| 2011 federal election redistributed results[7] | |||
|---|---|---|---|
| Party | Vote | % | |
| New Democratic | 26,042 | 70.65 | |
| Conservative | 7,538 | 20.45 | |
| Liberal | 2,863 | 7.77 | |
| Green | 415 | 1.13 | |
2011 general election
| 2011 Canadian federal election | ||||||||
|---|---|---|---|---|---|---|---|---|
| Party | Candidate | Votes | % | ±% | Expenditures | |||
| New Democratic | Jack Harris | 31,388 | 71.22 | -3.33 | $68,045.84 | |||
| Conservative | Jerry Byrne | 9,198 | 20.87 | +11.61 | $85,207.91 | |||
| Liberal | John Allan | 3,019 | 6.85 | -5.73 | $53,539.40 | |||
| Green | Robert Miller | 467 | 1.06 | -0.32 | $335.14 | |||
| Total valid votes/Expense limit | 44,072 | 100.0 | – | $85,537.94 | ||||
| Total rejected, declined and unmarked ballots | 136 | 0.31 | +0.32 | |||||
| Turnout | 44,208 | 57.85 | +0.96 | |||||
| Eligible voters | 76,424 | |||||||
| New Democratic hold | Swing | -7.47 | ||||||
| Sources:[8][9] | ||||||||
2008 general election
| 2008 Canadian federal election | ||||||||
|---|---|---|---|---|---|---|---|---|
| Party | Candidate | Votes | % | ±% | Expenditures | |||
| New Democratic | Jack Harris | 30,881 | 74.55 | +57.03 | $78,829 | |||
| Liberal | Walter Noel | 5,211 | 12.58 | -22.37 | $51,030 | |||
| Conservative | Craig Westcott | 3,836 | 9.26 | -37.30 | $79,772 | |||
| Progressive Canadian | Shannon Tobin | 578 | 1.40 | – | none listed | |||
| Green | Howard Story | 570 | 1.38 | +0.40 | none listed | |||
| Newfoundland and Labrador First | Les Coultas | 347 | 0.84 | – | none listed | |||
| Total valid votes/Expense limit | 41,423 | 100.0 | $81,734 | |||||
| Total rejected, declined and unmarked ballots | 137 | 0.33 | -0.06 | |||||
| Turnout | 41,560 | 56.89 | -4.6 | |||||
| Eligible voters | 73,053 | |||||||
| New Democratic gain from Conservative | Swing | +39.70 | ||||||
2006 general election
| 2006 Canadian federal election | ||||||||
|---|---|---|---|---|---|---|---|---|
| Party | Candidate | Votes | % | ±% | Expenditures | |||
| Conservative | Norman Doyle | 19,110 | 46.56 | +5.16 | $72,442 | |||
| Liberal | Paul Antle | 14,345 | 34.95 | -1.70 | $71,682 | |||
| New Democratic | Mike Kehoe | 7,190 | 17.52 | -2.25 | $14,072 | |||
| Green | Stephen Eli Harris | 402 | 0.98 | -1.19 | none listed | |||
| Total valid votes/Expense limit | 41,047 | 100.0 | – | $74,567 | ||||
| Total rejected, declined and unmarked ballots | 111 | 0.27 | -0.04 | |||||
| Turnout | 41,158 | 60.50 | +4.88 | |||||
| Eligible voters | 68,026 | |||||||
| Conservative hold | Swing | +3.43 | ||||||
2004 general election
| 2004 Canadian federal election | ||||||||
|---|---|---|---|---|---|---|---|---|
| Party | Candidate | Votes | % | ±% | Expenditures | |||
| Conservative | Norman Doyle | 15,073 | 41.40 | -12.50 | $67,414 | |||
| Liberal | Walter Noel | 13,343 | 36.65 | +4.07 | $70,872 | |||
| New Democratic | Janine Piller | 7,198 | 19.77 | +7.09 | $17,703 | |||
| Green | Scott Vokey | 791 | 2.17 | – | $564 | |||
| Total valid votes/Expense limit | 36,405 | 100.0 | – | $72,255 | ||||
| Total rejected, declined and unmarked ballots | 114 | 0.31 | ||||||
| Turnout | 36,519 | 55.62 | -1.47 | |||||
| Eligible voters | 65,660 | |||||||
| Conservative notional gain from Progressive Conservative | Swing | -8.28 | ||||||
| Changes from 2000 are based on redistributed results. Change for the Conservatives is based on the combined totals of the Progressive Conservatives and the Canadian Alliance. | ||||||||
| 2000 federal election redistributed results | |||
|---|---|---|---|
| Party | Vote | % | |
| Progressive Conservative | 17,752 | 51.26 | |
| Liberal | 11,282 | 32.58 | |
| New Democratic | 4,391 | 12.68 | |
| Alliance | 913 | 2.64 | |
| Others | 290 | 0.84 | |
2000 general election
| 2000 Canadian federal election | ||||||||
|---|---|---|---|---|---|---|---|---|
| Party | Candidate | Votes | % | ±% | ||||
| Progressive Conservative | Norman Doyle | 23,606 | 53.22 | +14.24 | ||||
| Liberal | Peter Miller | 13,835 | 31.19 | +4.02 | ||||
| New Democratic | Carol Cantwell | 5,395 | 12.16 | -15.93 | ||||
| Alliance | Garry Hartle | 1,144 | 2.58 | -1.88 | ||||
| Independent | Judy Day | 254 | 0.57 | |||||
| Natural Law | Michael Rayment | 122 | 0.28 | -0.15 | ||||
| Total valid votes | 44,356 | 100.00 | ||||||
| Changes for the Canadian Alliance from 1997 are based on the results of its predecessor, the Reform Party. | ||||||||
1997 general election
| 1997 Canadian federal election | ||||||||
|---|---|---|---|---|---|---|---|---|
| Party | Candidate | Votes | % | ±% | ||||
| Progressive Conservative | Norman Doyle | 17,286 | 38.98 | -2.83 | ||||
| New Democratic | Ted Warren | 12,460 | 28.09 | +21.62 | ||||
| Liberal | Bonnie Hickey | 12,048 | 27.17 | -17.27 | ||||
| Reform | David Tulett | 1,977 | 4.46 | +1.56 | ||||
| Green | Jonathan C. Whalen | 388 | 0.87 | |||||
| Natural Law | Michael Rayment | 191 | 0.43 | -0.42 | ||||
| Total valid votes | 44,350 | 100.00 | ||||||
1993 general election
| 1993 Canadian federal election | ||||||||
|---|---|---|---|---|---|---|---|---|
| Party | Candidate | Votes | % | ±% | ||||
| Liberal | Bonnie Hickey | 19,511 | 44.44 | +25.38 | ||||
| Progressive Conservative | Ross Reid | 18,355 | 41.81 | -2.32 | ||||
| New Democratic | Bob Buckingham | 2,839 | 6.47 | -28.83 | ||||
| Reform | J. Leonard Barron | 1,271 | 2.90 | |||||
| National | Bill Vetter | 1,211 | 2.76 | |||||
| Natural Law | Michael Rayment | 374 | 0.85 | |||||
| Christian Heritage | Bob Tremblett | 339 | 0.77 | -0.75 | ||||
| Total valid votes | 43,900 | 100.00 | ||||||
1988 general election
| 1988 Canadian federal election | ||||||||
|---|---|---|---|---|---|---|---|---|
| Party | Candidate | Votes | % | ±% | ||||
| Progressive Conservative | Ross Reid | 21,503 | 44.13 | +9.16 | ||||
| New Democratic | Jack Harris | 17,198 | 35.30 | -10.98 | ||||
| Liberal | Jim Baird | 9,285 | 19.06 | +1.84 | ||||
| Christian Heritage | Robert Tremblett | 739 | 1.52 | |||||
| Total valid votes | 48,725 | 100.00 | ||||||
1987 by-election
| Canadian federal by-election, 20 July 1987 Resignation of James McGrath, 4 September 1986 | ||||||||
|---|---|---|---|---|---|---|---|---|
| Party | Candidate | Votes | % | ±% | ||||
| New Democratic | Jack Harris | 15,842 | 46.28 | +39.72 | ||||
| Progressive Conservative | Thomas V. Hickey | 11,971 | 34.97 | -43.33 | ||||
| Liberal | Steve Neary | 5,894 | 17.22 | +2.9 | ||||
| Rhinoceros | Peter Francis Quinlan | 527 | 1.54 | |||||
| Total valid votes | 34,234 | 100.00 | ||||||
1984 general election
| 1984 Canadian federal election | ||||||||
|---|---|---|---|---|---|---|---|---|
| Party | Candidate | Votes | % | ±% | ||||
| Progressive Conservative | James McGrath | 30,866 | 78.30 | +17.04 | ||||
| Liberal | Elizabeth Reynolds | 5,644 | 14.32 | -11.15 | ||||
| New Democratic | Christine Oliver | 2,584 | 6.56 | -5.60 | ||||
| Libertarian | Paul Paquet | 325 | 0.82 | |||||
| Total valid votes | 39,419 | 100.00 | ||||||
1980 general election
| 1980 Canadian federal election | ||||||||
|---|---|---|---|---|---|---|---|---|
| Party | Candidate | Votes | % | ±% | ||||
| Progressive Conservative | James McGrath | 20,007 | 61.26 | +2.83 | ||||
| Liberal | Ernest J. Bishop | 8,320 | 25.47 | +3.17 | ||||
| New Democratic | George P. Corbett | 3,973 | 12.16 | -7.11 | ||||
| Independent | Ann Margaret Barney | 270 | 0.83 | |||||
| Marxist–Leninist | Carol Hodge | 91 | 0.28 | |||||
| Total valid votes | 32,661 | 100.00 | ||||||
1979 general election
| 1979 Canadian federal election | ||||||||
|---|---|---|---|---|---|---|---|---|
| Party | Candidate | Votes | % | ±% | ||||
| Progressive Conservative | James McGrath | 20,262 | 58.43 | +2.25 | ||||
| Liberal | John Dustan | 7,734 | 22.30 | -11.48 | ||||
| New Democratic | Stratford G. Canning | 6,684 | 19.27 | +10.04 | ||||
| Total valid votes | 34,680 | 100.00 | ||||||
1974 general election
| 1974 Canadian federal election | ||||||||
|---|---|---|---|---|---|---|---|---|
| Party | Candidate | Votes | % | ±% | ||||
| Progressive Conservative | James McGrath | 16,941 | 56.18 | -4.29 | ||||
| Liberal | Norman Whalen | 10,187 | 33.78 | +0.06 | ||||
| New Democratic | George Corbett | 2,783 | 9.23 | +3.90 | ||||
| Independent | J. Wayne Saint John | 242 | 0.80 | |||||
| Total valid votes | 30,153 | 100.00 | ||||||
1972 general election
| 1972 Canadian federal election | ||||||||
|---|---|---|---|---|---|---|---|---|
| Party | Candidate | Votes | % | ±% | ||||
| Progressive Conservative | James McGrath | 17,728 | 60.47 | -0.46 | ||||
| Liberal | Margaret Dunn | 9,887 | 33.72 | -1.72 | ||||
| New Democratic | R. Graham Kelly | 1,563 | 5.33 | +2.12 | ||||
| Social Credit | Norman W. King | 139 | 0.47 | +0.05 | ||||
| Total valid votes | 29,317 | 100.00 | ||||||
1968 general election
| 1968 Canadian federal election | ||||||||
|---|---|---|---|---|---|---|---|---|
| Party | Candidate | Votes | % | ±% | ||||
| Progressive Conservative | James McGrath | 18,153 | 60.93 | +19.79 | ||||
| Liberal | Joseph O'Keefe | 10,558 | 35.44 | -20.53 | ||||
| New Democratic | Mary Summers | 956 | 3.21 | +1.13 | ||||
| Social Credit | Norman W. King | 126 | 0.42 | -0.39 | ||||
| Total valid votes | 29,793 | 100.00 | ||||||
1965 general election
| 1965 Canadian federal election | ||||||||
|---|---|---|---|---|---|---|---|---|
| Party | Candidate | Votes | % | ±% | ||||
| Liberal | Joseph O'Keefe | 16,182 | 55.97 | +4.48 | ||||
| Progressive Conservative | William Joseph Browne | 11,894 | 41.14 | -7.37 | ||||
| New Democratic | Cyril W. Strong | 602 | 2.08 | Ø | ||||
| Social Credit | Norman William King | 233 | 0.81 | Ø | ||||
| Total valid votes | 28,911 | 100.00 | ||||||
1963 general election
| 1963 Canadian federal election | ||||||||
|---|---|---|---|---|---|---|---|---|
| Party | Candidate | Votes | % | ±% | ||||
| Liberal | Joseph O'Keefe | 14,768 | 51.49 | +5.92 | ||||
| Progressive Conservative | James McGrath | 13,911 | 48.51 | -3.82 | ||||
| Total valid votes | 28,679 | 100.00 | ||||||
1962 general election
| 1962 Canadian federal election | ||||||||
|---|---|---|---|---|---|---|---|---|
| Party | Candidate | Votes | % | ±% | ||||
| Progressive Conservative | James McGrath | 14,821 | 52.33 | -13.09 | ||||
| Liberal | Brian White | 12,907 | 45.57 | +11.95 | ||||
| New Democratic | James J. Walsh | 435 | 1.54 | Ø | ||||
| Social Credit | Eric Dixon Cave Hiscock | 158 | 0.56 | Ø | ||||
| Total valid votes | 28,321 | 100.00 | ||||||
1958 general election
| 1958 Canadian federal election | ||||||||
|---|---|---|---|---|---|---|---|---|
| Party | Candidate | Votes | % | ±% | ||||
| Progressive Conservative | James McGrath | 17,894 | 65.42 | +12.22 | ||||
| Liberal | Gregory O'Grady | 9,197 | 33.62 | -13.18 | ||||
| Independent Liberal | David Ignatius Jackman | 263 | 0.96 | Ø | ||||
| Total valid votes | 27,354 | 100.00 | ||||||
1957 general election
| 1957 Canadian federal election | ||||||||
|---|---|---|---|---|---|---|---|---|
| Party | Candidate | Votes | % | ±% | ||||
| Progressive Conservative | James McGrath | 10,312 | 53.20 | +18.82 | ||||
| Liberal | Allan Fraser | 9,073 | 46.80 | +4.1 | ||||
| Total valid votes | 19,385 | 100.00 | ||||||
1953 general election
| 1953 Canadian federal election | ||||||||
|---|---|---|---|---|---|---|---|---|
| Party | Candidate | Votes | % | ±% | ||||
| Liberal | Allan Fraser | 8,310 | 42.70 | -1.21 | ||||
| Progressive Conservative | Gordon Higgins | 6,691 | 34.38 | -20.62 | ||||
| Independent | Peter John Cashin | 4,459 | 22.91 | Ø | ||||
| Total valid votes | 19,460 | 100.00 | ||||||
1949 general election
| 1949 Canadian federal election | ||||||||
|---|---|---|---|---|---|---|---|---|
| Party | Candidate | Votes | % | |||||
| Progressive Conservative | Gordon Higgins | 9,912 | 55.00 | |||||
| Liberal | Ambrose John Dalton Shea | 7,913 | 43.91 | |||||
| Co-operative Commonwealth | William W. Gillies | 197 | 1.09 | |||||
| Total valid votes | 18,022 | 100.00 | ||||||
Student Vote Results
2019
| 2019 Canadian federal election | ||||||||
|---|---|---|---|---|---|---|---|---|
| Party | Candidate | Votes | % | ±% | ||||
| New Democratic | Jack Harris | 2,135 | 40.34 | -1.87 | ||||
| Liberal | Nick Whalen | 1,542 | 29.14 | -13.46 | ||||
| Conservative | Joedy Wall | 964 | 18.22 | +11.45 | ||||
| Green | David Peters | 651 | 12.30 | +7.57 | ||||
| Total Valid Votes | 5,292 | 100.0 | – | |||||
| Source: Student Vote Canada[10] | ||||||||
2015
| 2015 Canadian federal election | ||||||||
|---|---|---|---|---|---|---|---|---|
| Party | Candidate | Votes | % | ±% | ||||
| Liberal | Nick Whalen | 648 | 42.60 | +25.72 | ||||
| New Democratic | Jack Harris | 642 | 42.21 | -11.51 | ||||
| Conservative | Deanne Stapleton | 103 | 6.77 | -11.75 | ||||
| Green | David Anthony Peters | 72 | 4.73 | 6.15 | ||||
| Communist | Sean Burton | 56 | 3.68 | – | ||||
| Total Valid Votes | 1,521 | 100.0 | – | |||||
| Source: Student Vote Canada[11] | ||||||||
2011
| 2011 Canadian federal election | ||||||||
|---|---|---|---|---|---|---|---|---|
| Party | Candidate | Votes | % | |||||
| New Democratic | Jack Harris | 815 | 53.72 | |||||
| Conservative | Jerry Bynre | 281 | 18.52 | |||||
| Liberal | John Allan | 256 | 16.88 | |||||
| Green | Robert Miller | 165 | 10.88 | |||||
| Total Valid Votes | 1,517 | 100.0 | ||||||
| Source: Student Vote Canada[12] | ||||||||
References
- "(Code 10006) Census Profile". 2011 census. Statistics Canada. 2012. Retrieved 2011-03-03.
- St. John's East riding from Elections Canada
- Riding history for St. John's East (1949–1952) from the Library of Parliament
- Riding history for St. John's East (1952–1987) from the Library of Parliament
- Riding history for St. John's East (1987–2003) from the Library of Parliament
- Riding history for St. John's North (2003–2004) from the Library of Parliament
- Riding history for St. John's East (2004– ) from the Library of Parliament
- Election Financial Reports from Elections Canada
Notes
- Statistics Canada: 2012
- "Just who is Nick Whalen?". The Telegram. St. John's. October 20, 2015. Retrieved 2015-10-22.
- "Results Validated by the Returning Officer". Elections Canada. Retrieved 25 October 2019.
- "October 19, 2015 Election Results — St. John's East (Validated results)". Elections Canada. 21 October 2015. Retrieved 24 October 2015.
- Elections Canada – Preliminary Election Expenses Limits for Candidates
- Pundits' Guide to Canadian Elections
- Elections Canada – Official voting results, Forty-first general election, 2011
- Elections Canada – Candidate's electoral campaign return, 41st general election
- "Student Vote Canada 2019". Retrieved 2020-09-25.
- "Student Vote". Retrieved 2020-09-25.
- "District Results". Student Vote Canada. Archived from the original on 2015-05-06. Retrieved 2020-09-25.
