Tipping-point state
In United States presidential elections, the tipping-point state is the first state that gives the winning candidate a majority of electoral votes, thereby securing the candidate's victory in the Electoral College, when all states are arranged in decreasing order of their vote margins for the ultimate winner.

The tipping-point state can be interpreted as a counterfactual, on the assumption that outcomes in different states are strongly correlated: if the nation-wide vote margin were shifted, but the order of states by vote margin were unchanged, the tipping-point state would be the state or states in which a change in the state winner would result in a change in the national winner. The term is also used to refer to the state that would give the second-place candidate a majority of the electoral vote when all states are arranged in order of their vote margins. Since the number of electors was set to 538 prior to the 1964 United States presidential election, 270 votes have been required to win the Electoral College.
Origin and definition
The concept of a tipping-point state was popularized by FiveThirtyEight's Nate Silver.[1] FiveThirtyEight regularly predicts which state will be the tipping-point state in a given presidential election through the site's "Tipping Point Index". Past predictions of tipping-point states include either Michigan or Ohio in the 2008 election,[2] Ohio in the 2012 election,[3] Florida in the 2016 election,[4] and Pennsylvania in the 2020 election.[5]
Because a majority of the electoral vote is required in order to clinch the presidential election in the Electoral College,[lower-alpha 1] the tipping-point state for the first-place finisher and the second-place finisher may differ if more than two candidates received electoral votes, or if a shift in the states would leave the electoral vote tied. Tipping-point states may also differ depending on the disposition of faithless electors, on the assumption that certain faithless electors may have chosen to give their vote to the candidate they had pledged to vote for if their vote would have given that candidate a majority of the vote. Because electoral votes are awarded to winners of Washington, D.C. and certain congressional districts,[lower-alpha 2] it is possible for the tipping-point to be something other than a state.
The tipping-point state is not related to the chronological order in which media outlets report the state-by-state election results. Rather, the media uses decision desks to project the apparent winners of each state before all the votes are counted, and will announce a state that they project will give a candidate enough electoral votes to become the apparent presidential winner. The tipping-point state can only be determined after all the votes in each state are counted and certified, and thus all the vote margins are accurate.
Example: 2012 presidential election
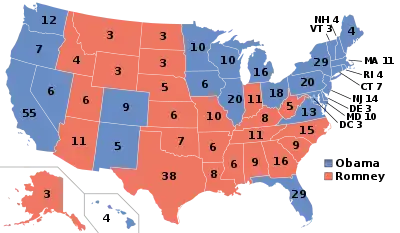
Obama victory tipping point state
In the 2012 presidential election, Barack Obama defeated Mitt Romney in the electoral vote, taking 332 electoral votes compared to 206 for Romney. As with all presidential elections since the 1964 election, 270 electoral votes were needed to win a majority in the Electoral College. Obama would still have won a majority of the electoral vote even if he did not win Virginia, Ohio, and Florida, the three states in which he had his lowest margin of victory. However, if Obama had lost those three states as well as Colorado (the state in which Obama's margin of victory was smallest after excluding Virginia, Ohio, and Florida), he would not have won a majority of the Electoral College. Thus, Colorado was the tipping point state for an Obama victory in 2012.
| State | Cumulative Obama electoral vote | ||
|---|---|---|---|
| State | Obama margin | Electoral votes | |
| 20 states + D.C.[lower-alpha 3] | >6% | 233 | 233 |
| Iowa | 5.81% | 6 | 239 |
| New Hampshire | 5.58% | 4 | 243 |
| Pennsylvania | 5.39% | 20 | 263 |
| Colorado | 5.37% | 9 | 272 |
| Virginia | 3.87% | 13 | 285 |
| Ohio | 2.98% | 18 | 303 |
| Florida | 0.88% | 29 | 332 |
| 24 states[lower-alpha 4] | <0% | 206 | N/A |
Hypothetical Romney victory tipping point state
In a hypothetical 2012 presidential election in which every state uniformly shifted to Romney by 5.38 points, Romney would have won a majority of the electoral vote. In this scenario, Romney would have won 275 electoral votes by adding Florida, Ohio, Virginia, and Colorado to the states he won historically. By contrast, if each state had only shifted uniformly to Romney by 5.36 points, Romney would have still have won Florida, Ohio, and Virginia, but would not have won Colorado and would not have won a majority of the electoral vote. Thus, Colorado was the tipping point state for a Romney victory in 2012.
| State | Cumulative Romney electoral vote | ||
|---|---|---|---|
| State | Romney margin | Electoral votes | |
| 24 states[lower-alpha 4] | >5% | 206 | 206 |
| Florida | 4.5% | 29 | 235 |
| Ohio | 2.4% | 18 | 253 |
| Virginia | 1.51% | 13 | 266 |
| Colorado | 0.01% | 9 | 275 |
| Pennsylvania | -0.01% | 20 | N/A |
| New Hampshire | -0.2% | 4 | N/A |
| Iowa | -0.43% | 6 | N/A |
| 20 states + D.C. | <-0.5% | 233 | N/A |
List of tipping-point states by election
This table shows the tipping point state for the winning candidate in each presidential election since 1832, without any reassignment of faithless electors.
Tipping-point states by frequency
The following states have been the tipping-point state for the winning candidate (without accounting for any change in the disposition of faithless electors) beginning with the 1832 election:
| Times | State(s) |
|---|---|
| 8 | New York |
| 6 | Ohio |
| 5 | Pennsylvania |
| 4 | Illinois |
| 3 | Michigan |
| 2 | California, Colorado, Florida, New Jersey, Tennessee, Wisconsin |
| 1 | Indiana, Iowa, Maine, Missouri, Nebraska, North Carolina, Rhode Island, South Carolina, Washington, West Virginia |
Notes
- If no individual wins a majority of the electoral vote, the U.S. House of Representatives determines the winner in a contingent election.
- Nebraska and Maine award two electoral votes to the statewide winner and award the remainder of their electoral votes based on the winner of each congressional district. Since the 1832 presidential election, the vast majority of states have awarded all of their respective electoral votes to the statewide winner, but various methods have been used historically. In some cases, such as the 1860 United States presidential election in New York, parties have formed fusion tickets in which they agreed to split a state's electoral vote if they won the state.
- 20 states and Washington D.C. voted for Obama by a margin of at least 6 percent in 2012.
- 24 states voted for Romney in 2012.
- The margin by which the winning candidate won the tipping point state.
- The margin by which the winning candidate won the national popular vote.
- The tipping-point state margin subtracted by the national popular vote margin.
- Because third party candidates John Floyd and William Wirt each won several electoral votes, Pennsylvania was the tipping point state for a Henry Clay victory.
- Because Hugh Lawson White, Daniel Webster, and Willie Person Mangum each won several electoral votes, and because William Henry Harrison did not appear on the ballot of every state, New York was the tipping point state for a Harrison victory.
- Because Millard Fillmore won several electoral votes, and because John C. Fremont did not appear on the ballot of every state, Pennsylvania was the tipping point state for a Fremont victory.
- Hoping to rally War Democrats and other unionists during the American Civil War, the Republican Party campaigned as the National Union Party in the 1864 election.[6]
- Arkansas was the tipping point state for a victory by Horatio Seymour.
- Congress voted to reject the electoral votes of Arkansas and Louisiana on the grounds of election irregularities. If the presidential electors of those states had been accepted by Congress, New Hampshire would have been the tipping point state.
- Ohio was the tipping point state for a victory by Theodore Roosevelt.
- Because third party candidate Strom Thurmond won 39 electoral votes, Illinois was the tipping point state for a victory by Thomas Dewey.
- Because Harry F. Byrd won several electoral votes, New Jersey was the tipping point state for a Nixon victory.
- Because third party candidate George Wallace won several electoral votes, Illinois was the tipping point state for a victory by Hubert Humphrey.[7]
- Because of a faithless elector, Maine was the tipping point state for a George McGovern victory.[7]
- George W. Bush won Florida by 0.0092% in the 2000 presidential election.
- Broke a possible tie in the Electoral College. As a result, Iowa was the tipping point state for a John McCain victory.
- Without assigning faithless electors to the winners of their respective states, Pennsylvania was the tipping point state for a Trump victory.[8] Wisconsin was the tipping point state for a Hillary Clinton victory, and was also the tipping point state for a Trump victory if faithless electors are assigned to the winners of their respective states.[9]
- Broke a possible tie in the Electoral College. As a result, Pennsylvania was the tipping point state for a Donald Trump victory.
References
- Katz, Josh (2 August 2016). "Florida Is Most Likely to Be the Election 'Tipping Point'". The New York Times. Retrieved 26 February 2019.
- Silver, Nate (22 July 2008). "The Tipping-Point States". The New Republic. Retrieved 26 February 2019.
- LoGiurato, Brett (11 October 2012). "Mitt Romney Is On The Verge Of A Major Electoral Map Comeback". Business Insider. Retrieved 26 February 2019.
- Hickey, Walt (2 November 2016). "Which Tipping-Point States Favor Trump?". FiveThirtyEight. Retrieved 26 February 2019.
- "The winding path to victory". FiveThirtyEight. 1 November 2020. Archived from the original on 1 November 2020. Retrieved 1 November 2020.
- White (2009), pp. 592–593.
- Silver, Nate (14 November 2016). "Will The Electoral College Doom The Democrats Again?". FiveThirtyEight. Retrieved 10 March 2019.
- Bump, Philip (November 1, 2020). "Here are the states that have been the most likely to deliver the presidency". Washington Post.
- Silver, Nate (6 February 2017). "Donald Trump Had A Superior Electoral College Strategy". FiveThirtyEight. Retrieved 26 February 2019.
- Coleman, J. Miles (19 November 2020). "Wisconsin: Decisive Again In 2020". Center For Politics. Retrieved 9 December 2020.
Works cited
- White, Jr., Ronald C. (2009). A. Lincoln: A Biography. Random House. ISBN 978-1-4000-6499-1.