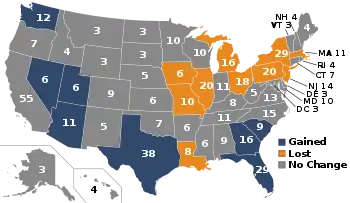
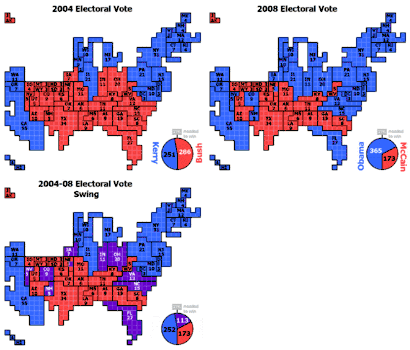
Electoral vote changes between United States presidential elections
The following is a summary of the electoral vote changes between United States presidential elections. It summarizes the changes in the Electoral College vote by comparing United States presidential election results for a given year with those from the immediate preceding election. It tracks those states which changed their support between parties as well as changes resulting from other factors, such as reapportionment.
 |
|---|
| This article is part of a series on the politics and government of the United States |
|
|
1792 vs. 1788

Electoral votes of the party that won in 1792: None
| 1788 electoral vote George Washington |
Gain due to reapportionment |
1788 result under the 1792 apportionment |
Gains | Losses | 1792 electoral vote George Washington |
|---|---|---|---|---|---|
| 69 | 95 | 132 | |||
| Kentucky(4) New York(12) North Carolina(12) Rhode Island(4) Vermont(3) Virginia(2)* |
* Washington received only 10 of Virginia's 12 electoral votes in the 1788 election.
1796 vs. 1792

Electoral votes of the party that won in 1796: Federalist Party
| 1792 electoral vote George Washington |
Gains | Losses | 1796 electoral vote John Adams |
|---|---|---|---|
| 132 | 71 | ||
| Vermont(1)* | Georgia(4) Kentucky(4) North Carolina(11)† Maryland(1)‡ Pennsylvania(14)↑ South Carolina(8) Virginia(20)↓ |
Though George Washington was officially non-partisan during his presidency, he was broadly sympathetic to the Federalist platform and was endorsed by both parties.
* Washington received only 3 of Vermont's 4 electoral votes in the 1792 election.
† Adams received only 1 of North Carolina's 12 electoral votes in the 1796 election.
‡ Washington only received 8 of Maryland's 10 electoral votes in the 1792 election. In 1796, Adams received 7 of 10.
↑ Adams received only 1 of Pennsylvania's 15 electoral votes in the 1796 election.
↓ Adams received only 1 of Virginia's 21 electoral votes in the 1796 election.
1800 vs. 1796

Electoral votes of the party that won in 1800: Democratic-Republican Party
| 1796 electoral vote Thomas Jefferson |
Gains | Losses | 1800 electoral vote Thomas Jefferson |
|---|---|---|---|
| 68 | 73 | ||
| Maryland(1)* New York(12) Virginia(1)† |
North Carolina(3)‡ Pennsylvania(6)↑ |
* Jefferson received only 4 of Maryland's 10 electoral votes in the 1796 election. In 1800, he received 5 of 10.
† Jefferson received only 20 of Virginia's 21 electoral votes in the 1796 election.
‡ Jefferson received only 8 of North Carolina's 12 electoral votes in the 1800 election, as opposed to the 11 of 12 he received in 1796.
↑ Jefferson received only 8 of Pennsylvania's 15 electoral votes in the 1800 election, as opposed to the 14 of 15 he received in 1796.
1804 vs. 1800
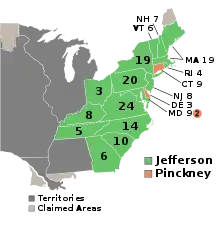
Electoral votes of the party that won in 1804: Democratic-Republican Party
| 1800 electoral vote Thomas Jefferson |
Gain due to reapportionment |
1800 result under the 1804 apportionment |
Gains | Losses | 1804 electoral vote Thomas Jefferson |
|---|---|---|---|---|---|
| 73 | 101 | 162 | |||
| Maryland(3)* Massachusetts(19) New Hampshire(7) New Jersey(8) North Carolina(4)† Ohio(3) Pennsylvania(7)‡ Rhode Island(4) Vermont(6) |
* Jefferson received only 5 of Maryland's 10 electoral votes in the 1800 election. In 1804, he received 9 of 11.
† Jefferson received only 8 of North Carolina's 12 electoral votes in the 1800 election.
‡ Jefferson received only 8 of Pennsylvania's 15 electoral votes in the 1800 election.
1808 vs. 1804
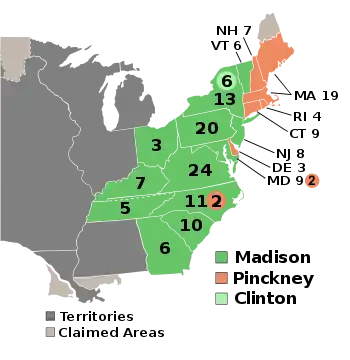
Electoral votes of the party that won in 1808: Democratic-Republican Party
| 1804 electoral vote Thomas Jefferson |
Gains | Losses | 1808 electoral vote James Madison |
|---|---|---|---|
| 162 | 122 | ||
| Kentucky(1)* Massachusetts(19) New Hampshire(7) New York(6)† North Carolina(3)‡ Rhode Island(4) |
* Madison received only 7 of Kentucky's 8 electoral votes in the 1808 election.
† Madison received only 13 of New York's 19 electoral votes in the 1808 election.
‡ Madison received only 11 of North Carolina's 14 electoral votes in the 1808 election.
1812 vs. 1808

Electoral votes of the party that won in 1812: Democratic-Republican Party
| 1808 electoral vote James Madison |
Gain due to reapportionment |
1808 result under the 1812 apportionment |
Gains | Losses | 1812 electoral vote James Madison |
|---|---|---|---|---|---|
| 122 | 156 | 128 | |||
| Kentucky(1)* North Carolina(3)† Louisiana(3) |
Maryland(3)‡ New Jersey(8) New York(23) Ohio(1)↑ |
* Madison received only 7 of Kentucky's 8 electoral votes in the 1808 election.
† Madison received only 11 of North Carolina's 14 electoral votes in the 1808 election.
‡ Madison received only 9 of Maryland's 11 electoral votes in the 1808 election. In 1812, Madison received 6 out of 11.
↑ Madison received only 7 of Ohio's 8 electoral votes in the 1812 election.
1816 vs. 1812

Electoral votes of the party that won in 1816: Democratic-Republican Party
| 1812 electoral vote James Madison |
Gains | Losses | 1816 electoral vote James Monroe |
|---|---|---|---|
| 128 | 183 | ||
| Indiana(3) Maryland(2)* New Hampshire(8) New Jersey(8) New York(29) Ohio(1)† Rhode Island (4) |
* Madison received only 6 of Maryland's 11 electoral votes in the 1812 election. In 1816, Monroe received 8 out of 11
† Madison received only 7 of Ohio's 8 electoral votes in the 1812 election.
1820 vs. 1816

Electoral votes of the party that won in 1820: Democratic-Republican Party
| 1816 electoral vote James Monroe |
Gain due to reapportionment |
1816 result under the 1820 apportionment |
Gains | Losses | 1820 electoral vote James Monroe |
|---|---|---|---|---|---|
| 183 | 185 | 231 | |||
| Alabama(3) Connecticut(9) Delaware(4) Illinois(9) Massachusetts(15) Maine(3) Mississippi(2) Missouri(3) |
New Hampshire(1)* |
* Monroe received only 7 of New Hampshire's 8 electoral votes in 1820.
1824 vs. 1820
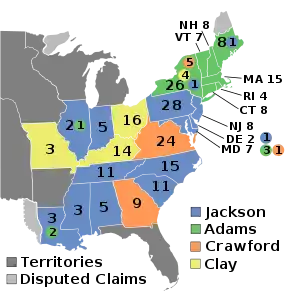
Electoral votes of the candidate that won in 1824: one of several from the Democratic-Republican Party
| 1820 electoral vote John Quincy Adams |
Gains | Losses | 1824 electoral vote John Quincy Adams |
|---|---|---|---|
| 1 | 84 | ||
| Connecticut(8) Delaware(1)* Illinois(1)† Louisiana(2)‡ Maryland(3)↑ Maine(9) Massachusetts(15) New Hampshire(7)↓ New York (26)# Rhode Island(4) Vermont(7) |
Due to multiple candidates from the same party in the 1824 election (and the party being the only major party at the time), this chart only shows the electoral votes of the winning candidate, even though he did not receive a plurality of the electoral votes and the election was decided in the United States House of Representatives.
* Adams received only 1 of Delaware's 3 electoral votes in the 1824 election.
† Adams received only 1 of Illinois's 3 electoral votes in the 1824 election.
‡ Adams received only 2 of Louisiana's 5 electoral votes in the 1824 election.
↑ Adams received only 3 of Maryland's 11 electoral votes in the 1824 election.
↓ Adams received only 1 of New Hampshire's 8 electoral votes in 1820 and all 8 in 1824.
# Adams received only 26 of New York's 36 electoral votes in the 1824 election.
1828 vs. 1824
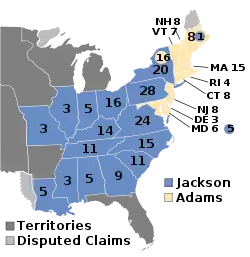
Electoral votes of the candidate that won in 1828: candidate of the Democratic Party in 1828 and one of several from the Democratic-Republican Party in 1824
| 1824 electoral vote Andrew Jackson |
Gains | Losses | 1828 electoral vote Andrew Jackson |
|---|---|---|---|
| 99 | 178 | ||
| Georgia(9) Illinois(1)* Kentucky(14) Louisiana(2)† Maine(1)‡ Missouri(3) New York(19)↑ Ohio(16) Virginia(24) |
Maryland(2)↓ New Jersey(8) |
Due to multiple candidates from the same party in the 1824 election (and the party being the only major party at the time), this chart only shows the electoral votes changes of the winning candidate of 1828.
* Jackson received only 2 of Illinois's 3 electoral votes in the 1824 election.
† Jackson received only 3 of Louisiana's 5 electoral votes in the 1824 election.
‡ Jackson received only 1 of Maine's 9 electoral votes in the 1828 election.
↑ Jackson received 1 of New York's 36 electoral votes in 1824 and 20 of 26 in 1828.
↓ Jackson received 7 of Maryland's 11 electoral votes in 1824 and 5 of 11 in 1828.
1832 vs. 1828
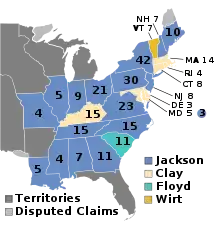
Electoral votes of the party that won in 1832: Democratic Party
| 1828 electoral vote Andrew Jackson |
Gain due to reapportionment |
1828 result under the 1832 apportionment |
Gains | Losses | 1832 electoral vote Andrew Jackson |
|---|---|---|---|---|---|
| 178 | 201 | 219 | |||
| Maine(9)* New Hampshire(7) New Jersey(8) New York(22)† |
Kentucky(15) Maryland(2)‡ South Carolina(11) |
* Jackson received 1 of Maine's 9 electoral votes in 1828 and all 10 in 1832.
† Jackson received 20 of New York's 36 electoral votes in 1828 and all 42 in 1832.
‡ Jackson received 5 of Maryland's 11 electoral votes in 1828 and 3 of 11 in 1832.
1836 vs. 1832
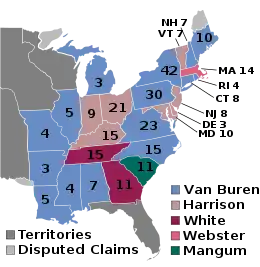
Electoral votes of the party that won in 1836: Democratic Party
| 1832 electoral vote Andrew Jackson |
Gains | Losses | 1836 electoral vote Martin Van Buren |
|---|---|---|---|
| 219 | 170 | ||
| Arkansas(3) Connecticut(8) Michigan(3) Rhode Island(4) |
Georgia(11) Indiana(9) Maryland(3)* New Jersey(8) Ohio(21) Tennessee(15) |
* Jackson received only 3 of Maryland's 8 electoral votes in the 1832 election.
1840 vs. 1836
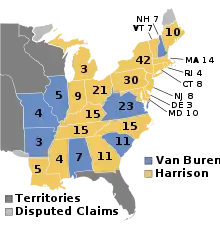
Electoral votes of the party that won in 1840: Whig Party
| 1836 electoral vote William Henry Harrison Hugh Lawson White Daniel Webster Willie Person Mangum |
Gains | Losses | 1840 electoral vote William Henry Harrison |
|---|---|---|---|
| 124 | 234 | ||
| Connecticut(8) Louisiana(5) Maine(10) Michigan(3) Mississippi(4) New York(42) North Carolina(15) Pennsylvania(30) Rhode Island(4) |
South Carolina(11) |
1844 vs. 1840
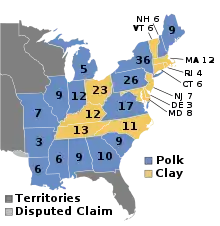
Electoral votes of the party that won in 1844: Democratic Party
| 1840 electoral vote Martin Van Buren |
Gain due to reapportionment |
1840 result under the 1844 apportionment |
Gains | Losses | 1844 electoral vote James K. Polk |
|---|---|---|---|---|---|
| 60 | 60 | 170 | |||
| Georgia(10) Indiana(12) Louisiana(6) Maine(9) Michigan(5) Mississippi(6) New York(36) Pennsylvania(26) |
1848 vs. 1844
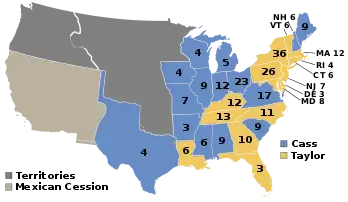
Electoral votes of the party that won in 1848: Whig Party
| 1844 electoral vote Henry Clay |
Gains | Losses | 1848 electoral vote Zachary Taylor |
|---|---|---|---|
| 105 | 163 | ||
| Georgia(10) Florida(3) Louisiana(6) New York(36) Pennsylvania(26) |
Ohio(23) |
1852 vs. 1848
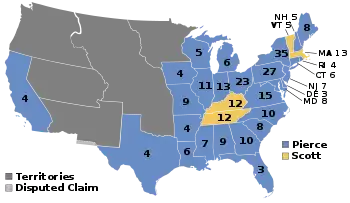
Electoral votes of the party that won in 1852: Democratic Party
| 1848 electoral vote Lewis Cass |
Gain due to reapportionment |
1848 result under the 1852 apportionment |
Gains | Losses | 1852 electoral vote Franklin Pierce |
|---|---|---|---|---|---|
| 127 | 131 | 254 | |||
| California(4) Connecticut(6) Delaware(3) Florida(3) Georgia(10) Louisiana(6) Maryland(8) New Jersey(7) New York(35) North Carolina(10) Pennsylvania(27) Rhode Island(4) |
1856 vs. 1852
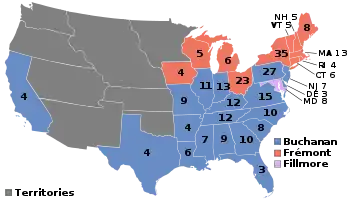
Electoral votes of the party that won in 1856: Democratic Party
| 1852 electoral vote Franklin Pierce |
Gains | Losses | 1856 electoral vote James Buchanan |
|---|---|---|---|
| 254 | 174 | ||
| Kentucky(12) Tennessee(12) |
Connecticut(6) Iowa(4) Maine(8) Maryland(8) Michigan(6) New Hampshire(5) New York(35) Ohio(23) Rhode Island(4) Wisconsin(5) |
1860 vs. 1856
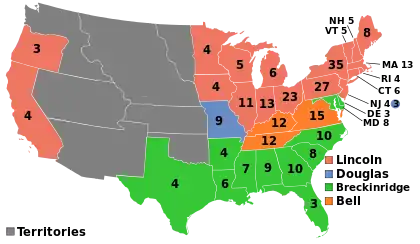
Electoral votes of the party that won in 1860: Republican Party
| 1856 electoral vote John Fremont |
Gains | Losses | 1860 electoral vote Abraham Lincoln |
|---|---|---|---|
| 114 | 180 | ||
| California(4) Illinois(11) Indiana(3) Minnesota(4) New Jersey(4)* Oregon(3) Pennsylvania(27) |
* Lincoln received only 4 of New Jersey's 7 electoral votes in the 1860 election.
1864 vs. 1860
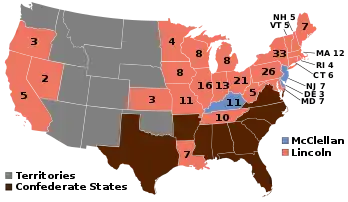
Electoral votes of the party that won in 1864: Republican Party
| 1860 electoral vote Abraham Lincoln |
Gain due to reapportionment |
1860 result under the 1864 apportionment |
Gains | Losses | 1864 electoral vote Abraham Lincoln |
|---|---|---|---|---|---|
| 180 | 188 | 212 | |||
| Kansas(3) Maryland(7) Missouri(11) Nevada(2) West Virginia(5) |
New Jersey(4)* |
* Lincoln received only 4 of New Jersey's 7 electoral votes in 1860.
1868 vs. 1864
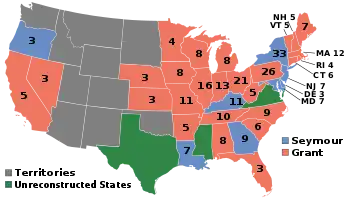
Electoral votes of the party that won in 1868: Republican Party
| 1864 electoral vote Abraham Lincoln |
Gains | Losses | 1868 electoral vote Ulysses S. Grant |
|---|---|---|---|
| 212 | 214 | ||
| Alabama(8) Arkansas(5) Florida(3) Nebraska(3) Nevada(1)* North Carolina(9) South Carolina(6) Tennessee(10) |
Maryland(7) New York(33) Oregon(3) |
* Lincoln received only 2 of Nevada's 3 electoral votes in 1864.
1872 vs. 1868
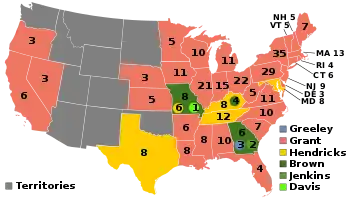
Electoral votes of the party that won in 1872: Republican Party
| 1868 electoral vote Ulysses S. Grant |
Gain due to reapportionment |
1868 result under the 1872 apportionment |
Gains | Losses | 1872 electoral vote Ulysses S. Grant |
|---|---|---|---|---|---|
| 214 | 249 | 286 | |||
| Delaware(3) Mississippi(8) New Jersey(9) New York(35) Oregon(3) Virginia(11) |
Arkansas(5) Missouri(15) Tennessee(12) |
1876 vs. 1872
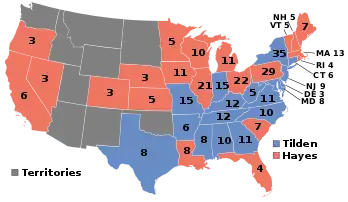
Electoral votes of the party that won in 1876: Republican Party
| 1872 electoral vote Ulysses S. Grant |
Gains | Losses | 1876 electoral vote Rutherford B. Hayes |
|---|---|---|---|
| 286 | 185 | ||
| Colorado(3) Louisiana(8) |
Alabama(10) Connecticut(6) Delaware(3) Indiana(15) New Jersey(9) New York(35) North Carolina(10) Virginia(11) West Virginia(5) |
1880 vs. 1876
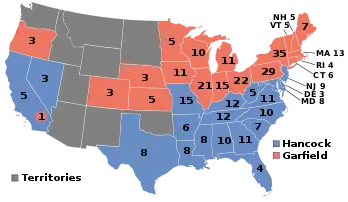
Electoral votes of the party that won in 1880: Republican Party
| 1876 electoral vote Rutherford Hayes |
Gains | Losses | 1880 electoral vote James A. Garfield |
|---|---|---|---|
| 185 | 214 | ||
| Connecticut(6) Indiana(15) New York(35) |
California(5)* Florida(4) Louisiana(8) South Carolina(7) Nevada(3) |
* Garfield received only 1 of California's 6 electoral votes in the 1880 election.
1884 vs. 1880
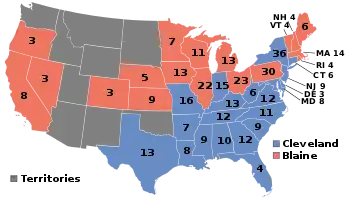
Electoral votes of the party that won in 1884: Democratic Party
| 1880 electoral vote Winfield Hancock |
Gain due to reapportionment |
1880 result under the 1884 apportionment |
Gains | Losses | 1884 electoral vote Grover Cleveland |
|---|---|---|---|---|---|
| 155 | 170 | 219 | |||
| Connecticut(6) Indiana(15) New York(36) |
California(5)* Nevada(3) |
* Hancock received only 5 of California's 6 electoral votes in 1880.
1888 vs. 1884
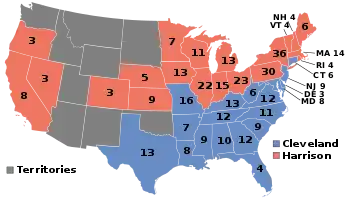
Electoral votes of the party that won in 1888: Republican Party
| 1884 electoral vote James G. Blaine |
Gains | Losses | 1888 electoral vote Benjamin Harrison |
|---|---|---|---|
| 182 | 233 | ||
| Indiana(15) New York(36) |
1892 vs. 1888
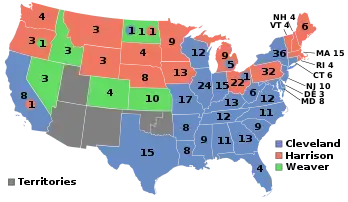
Electoral votes of the party that won in 1892: Democratic Party
| 1888 electoral vote Grover Cleveland |
Gain due to reapportionment |
1888 result under the 1892 apportionment |
Gains | Losses | 1892 electoral vote Grover Cleveland |
|---|---|---|---|---|---|
| 168 | 175 | 277 | |||
| California(8)* Illinois(24) Indiana(15) Michigan(5)† New York(36) North Dakota(1)‡ Ohio(1)↑ Wisconsin(12) |
* Cleveland received only 8 of California's 9 electoral votes in the 1892 election.
† Cleveland received only 5 of Michigan's 14 electoral votes in the 1892 election.
‡ Cleveland received only 1 of North Dakota's 3 electoral votes in the 1892 election.
↑ Cleveland received only 1 of Ohio's 23 electoral votes in the 1892 election.
1896 vs. 1892
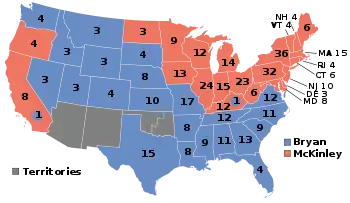
Electoral votes of the party that won in 1896: Republican Party
| 1892 electoral vote Benjamin Harrison |
Gains | Losses | 1896 electoral vote William McKinley |
|---|---|---|---|
| 145 | 271 | ||
| California(7)* Connecticut(6) Delaware(3) Illinois(24) Indiana(15) Kentucky(12)† Maryland(8) Michigan(5)‡ New Jersey(10) New York(36) North Dakota(2)↑ Ohio(1)↓ Oregon(1)# West Virginia(6) Wisconsin(12) |
Montana(3) Nebraska(8) South Dakota(4) Washington(4) Wyoming(3) |
* Harrison received 1 of California's 9 electoral votes in 1892 vs. McKinley's 8 of 9 in 1896.
† McKinley received only 12 of Kentucky's 13 electoral votes in the 1896 election.
‡ Harrison received only 9 of Michigan's 14 electoral votes in the 1892 election.
↑ Harrison received only 1 of North Dakota's 3 electoral votes in the 1892 election.
↓ Harrison received only 22 of Ohio's 23 electoral votes in the 1892 election.
# Harrison received only 3 of Oregon's 4 electoral votes in the 1892 election.
1900 vs. 1896
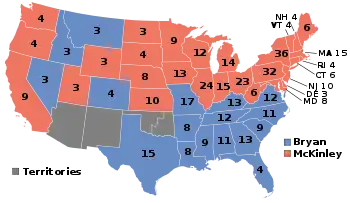
Electoral votes of the party that won in 1900: Republican Party
| 1896 electoral vote William McKinley |
Gains | Losses | 1900 electoral vote William McKinley |
|---|---|---|---|
| 271 | 292 | ||
| California(1)* Kansas(10) Nebraska(8) South Dakota(4) Utah(3) Washington(4) Wyoming(3) |
Kentucky(12)† |
* McKinley received only 8 of California's 9 electoral votes in the 1896 election.
† McKinley received only 12 of Kentucky's 13 electoral votes in the 1896 election.
1904 vs. 1900
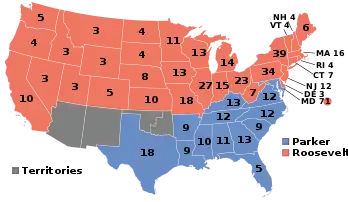
Electoral votes of the party that won in 1904: Republican Party
| 1900 electoral vote William McKinley |
Gain due to reapportionment |
1900 result under the 1904 apportionment |
Gains | Losses | 1904 electoral vote Theodore Roosevelt |
|---|---|---|---|---|---|
| 292 | 311 | 336 | |||
| Colorado(5) Idaho(3) Missouri(18) Montana(3) Nevada(3) |
Maryland(7)* |
* Theodore Roosevelt received only 1 of Maryland's 8 electoral votes in the 1904 election
1908 vs. 1904
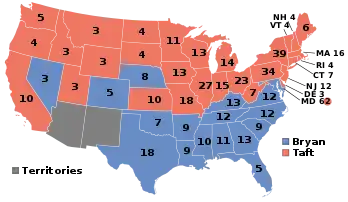
Electoral votes of the party that won in 1908: Republican Party
| 1904 electoral vote Theodore Roosevelt |
Gains | Losses | 1908 electoral vote William Howard Taft |
|---|---|---|---|
| 336 | 321 | ||
| Maryland(1)* | Colorado(5) Nebraska(8) Nevada(3) |
* Taft received 2 of 8 Maryland electors in 1908 vs. Roosevelt's 1 of 8 in 1904
1912 vs. 1908
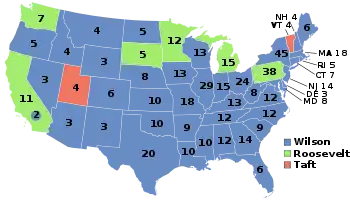
Electoral votes of the party that won in 1912: Democratic Party
| 1908 electoral vote William Jennings Bryan |
Gain due to reapportionment |
1908 result under the 1912 apportionment |
Gains | Losses | 1912 electoral vote Woodrow Wilson |
|---|---|---|---|---|---|
| 162 | 172 | 435 | |||
| California(2)* Connecticut(7) Delaware(3) Idaho(4) Illinois(29) Indiana(15) Iowa(13) Kansas(10) Maine(6) Maryland(2)† Massachusetts(18) Missouri(18) Montana(4) New Hampshire(4) New Jersey(14) New York(45) North Dakota(5) Ohio(24) Oregon(5) Rhode Island(5) West Virginia(8) Wisconsin(13) Wyoming(3) |
* Wilson received only 2 of California's 13 electoral votes in the 1912 election
† ''Bryan received only 6 of Maryland's 8 electoral votes in the 1908 election
1916 vs. 1912
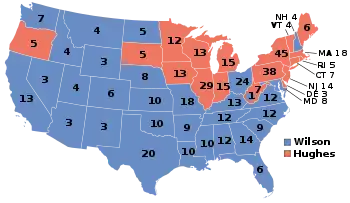
Electoral votes of the party that won in 1916: Democratic Party
| 1912 electoral vote Woodrow Wilson |
Gains | Losses | 1916 electoral vote Woodrow Wilson |
|---|---|---|---|
| 435 | 277 | ||
| California(11)* Utah(4) Washington(7) |
Connecticut(7) Delaware(3) Illinois(29) Indiana(15) Iowa(13) Maine(6) Massachusetts(18) New Jersey(14) New York(45) Oregon(5) Rhode Island(5) West Virginia(7)† Wisconsin(13) |
* Wilson received only 2 out of California's 13 electoral votes in the 1912 election
† Wilson received only 1 out of West Virginia's 8 electoral votes in the 1916 election
1920 vs. 1916
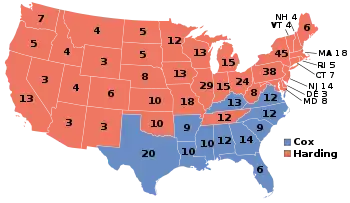
Electoral votes of the party that won in 1920: Republican Party
| 1916 electoral vote Charles Evans Hughes |
Gains | Losses | 1920 electoral vote Warren G. Harding |
|---|---|---|---|
| 254 | 404 | ||
| Arizona(3) California(13) Colorado(6) Idaho(4) Kansas(10) Maryland(8) Missouri(18) Montana(4) Nebraska(8) Nevada(3) New Hampshire(4) New Mexico(3) North Dakota(5) Ohio(24) Oklahoma(10) Tennessee (12) Utah(4) Washington(7) West Virginia(1)* Wyoming(3) |
* Hughes received only 7 out of West Virginia's 8 electoral votes in the 1916 election
1924 vs. 1920
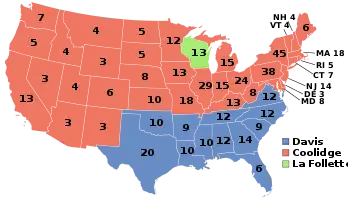
Electoral votes of the party that won in 1924: Republican Party
| 1920 electoral vote Warren G. Harding |
Gains | Losses | 1924 electoral vote Calvin Coolidge |
|---|---|---|---|
| 404 | 382 | ||
| Kentucky(13) | Oklahoma(10) Tennessee(12) Wisconsin(12) |
1928 vs. 1924
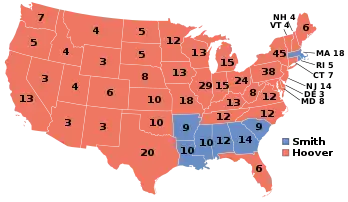
Electoral votes of the party that won in 1928: Republican Party
| 1924 electoral vote Calvin Coolidge |
Gains | Losses | 1928 electoral vote Herbert Hoover |
|---|---|---|---|
| 382 | 444 | ||
| Florida(6) North Carolina(12) Oklahoma(10) Tennessee(12) Texas(20) Virginia(12) Wisconsin(13) |
Massachusetts(18) Rhode Island(5) |
1932 vs. 1928
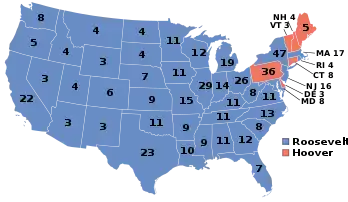
Electoral votes of the party that won in 1932: Democratic Party
| 1928 electoral vote Alfred E. Smith |
Loss due to reapportionment |
1928 result under the 1932 apportionment |
Gains | Losses | 1932 electoral vote Franklin D. Roosevelt |
|---|---|---|---|---|---|
| 87 | 80 | 472 | |||
| Arizona(3) California(22) Colorado(6) Florida(7) Idaho(4) Illinois(29) Indiana(14) Iowa(11) Kansas(9) Kentucky(11) Maryland(8) Michigan(19) Minnesota(11) Missouri(15) Montana(4) Nebraska(7) Nevada(3) New Jersey(16) New Mexico(3) New York(47) North Carolina(13) North Dakota(4) Ohio(26) Oregon(5) Oklahoma(11) South Dakota(4) Tennessee(11) Texas(23) Utah(4) Virginia(11) Washington(8) West Virginia(8) Wisconsin(12) Wyoming(3) |
1936 vs. 1932
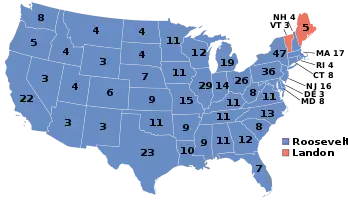
Electoral votes of the party that won in 1936: Democratic Party
| 1932 electoral vote Franklin D. Roosevelt |
Gains | Losses | 1936 electoral vote Franklin D. Roosevelt |
|---|---|---|---|
| 472 | 523 | ||
| Connecticut(8) Delaware(3) New Hampshire(4) Pennsylvania(36) |
1940 vs. 1936
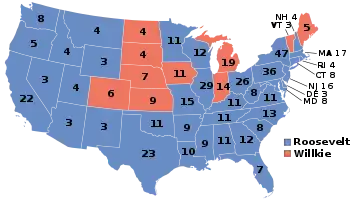
Electoral votes of the party that won in 1940: Democratic Party
| 1936 electoral vote Franklin D. Roosevelt |
Gains | Losses | 1940 electoral vote Franklin D. Roosevelt |
|---|---|---|---|
| 523 | 449 | ||
| Colorado(6) Indiana(14) Iowa(11) Kansas(9) Michigan(19) Nebraska(7) North Dakota(4) South Dakota(4) |
1944 vs. 1940
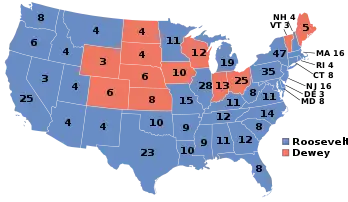
Electoral votes of the party that won in 1944: Democratic Party
| 1940 electoral vote Franklin D. Roosevelt |
Gain due to reapportionment |
1940 result under the 1944 apportionment |
Gains | Losses | 1944 electoral vote Franklin D. Roosevelt |
|---|---|---|---|---|---|
| 449 | 453 | 432 | |||
| Michigan(19) | Ohio(25) Wisconsin(12) Wyoming(3) |
1948 vs. 1944
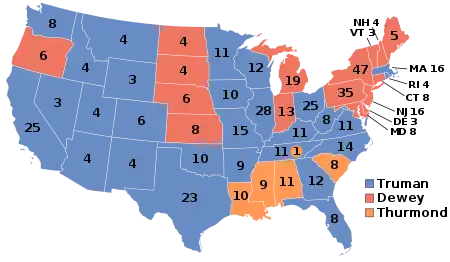
Electoral votes of the party that won in 1948: Democratic Party
| 1944 electoral vote Franklin D. Roosevelt |
Gains | Losses | 1948 electoral vote Harry S. Truman |
|---|---|---|---|
| 432 | 303 | ||
| Colorado(6) Iowa(10) Ohio(25) Wisconsin(12) Wyoming(3) |
Alabama(11) Connecticut(8) Delaware(3) Louisiana(10) Maryland(8) Michigan(19) Mississippi(9) New Hampshire(4) New Jersey(16) New York(47) Oregon(6) Pennsylvania(35) South Carolina(8) Tennessee(1)* |
* Truman received only 11 out of Tennessee's 12 electoral votes
1952 vs. 1948
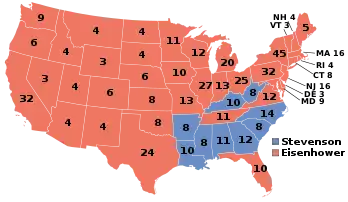
Electoral votes of the party that won in 1952: Republican Party
| 1948 electoral vote Thomas Dewey |
Loss due to reapportionment |
1948 result under the 1952 apportionment |
Gains | Losses | 1952 electoral vote Dwight D. Eisenhower |
|---|---|---|---|---|---|
| 189 | 186 | 442 | |||
| Arizona(4) California(32) Colorado(6) Florida(10) Idaho(4) Illinois(27) Iowa(10) Massachusetts(16) Minnesota(11) Missouri(13) Montana(4) Nevada(3) New Mexico(4) Ohio(25) Oklahoma(8) Rhode Island(4) Tennessee(11) Texas(24) Utah(4) Virginia(12) Washington(9) Wisconsin(12) Wyoming(3) |
1956 vs. 1952
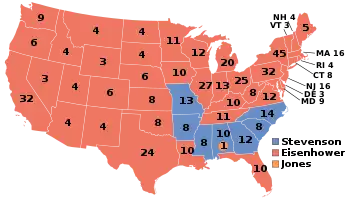
Electoral votes of the party that won in 1956: Republican Party
| 1952 electoral vote Dwight Eisenhower |
Gains | Losses | 1956 electoral vote Dwight Eisenhower |
|---|---|---|---|
| 442 | 457 | ||
| Kentucky(10) Louisiana(10) West Virginia(8) |
Missouri(13) |
1960 vs. 1956
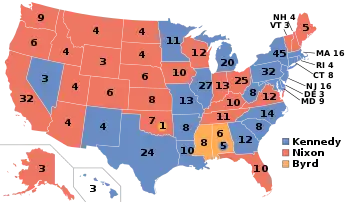
Electoral votes of the party that won in 1960: Democratic Party
| 1956 electoral vote Adlai Stevenson |
Gains | Losses | 1960 electoral vote John F. Kennedy |
|---|---|---|---|
| 73 | 303 | ||
| Connecticut (8) Delaware(3) Hawaii(3) Illinois(27) Louisiana(10) Maryland(9) Massachusetts(16) Michigan(20) Minnesota(11) Nevada(3) New Jersey(16) New Mexico(4) New York(45) Pennsylvania(32) Rhode Island(4) Texas(24) West Virginia(8) |
Alabama(5)* Mississippi(8) |
* Kennedy received only 5 out of Alabama's 11 electoral votes
1964 vs. 1960
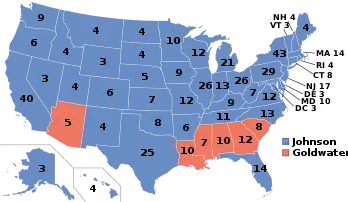
Electoral votes of the party that won in 1964: Democratic Party
| 1960 electoral vote John F. Kennedy |
Loss due to reapportionment |
1960 result under the 1964 apportionment |
Gains | Losses | 1964 electoral vote Lyndon B. Johnson |
|---|---|---|---|---|---|
| 303 | 294 | 486 | |||
| Alaska(3) California (40) Colorado (6) District of Columbia (3) Florida (14) Idaho (4) Indiana (13) Iowa (9) Kansas (7) Kentucky (9) Maine (4) Montana (4) Nebraska (5) New Hampshire (4) North Dakota (4) Ohio (26) Oklahoma (8) Oregon(6) South Dakota (4) Tennessee (11) Utah (4) Vermont (3) Virginia(12) Washington (9) Wisconsin(12) Wyoming (3) |
Alabama (5)* Georgia (12) Louisiana(10) South Carolina (8) |
* Kennedy received only 5 electoral votes from Alabama in 1960 of what would have been 10 electoral votes in 1964
1968 vs. 1964
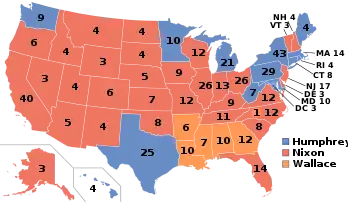
Electoral votes of the party that won in 1968: Republican Party
| 1964 electoral vote Barry Goldwater |
Gains | Losses | 1968 electoral vote Richard Nixon |
|---|---|---|---|
| 52 | 301 | ||
| Alaska(3) California(40) Colorado(6) Delaware(3) Florida(14) Idaho(4) Illinois(26) Indiana(13) Iowa(9) Kansas(7) Kentucky(9) Missouri(12) Montana(4) Nebraska(5) Nevada(3) New Hampshire(4) New Jersey(17) New Mexico(4) North Carolina(12)* North Dakota(4) Ohio(26) Oklahoma(8) Oregon(6) South Dakota(4) Tennessee(11) Utah(4) Vermont(3) Virginia(12) Wisconsin(12) Wyoming(3) |
Alabama(10) Georgia(12) Louisiana(10) Mississippi(7) |
* Nixon received only 12 out of North Carolina's 13 electoral votes in 1968
1972 vs. 1968
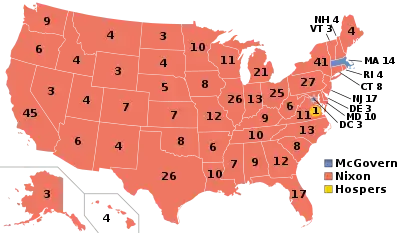
Electoral votes of the party that won in 1972: Republican Party
| 1968 electoral vote Richard Nixon |
Gain due to reapportionment |
1968 result under the 1972 apportionment |
Gains | Losses | 1972 electoral vote Richard Nixon |
|---|---|---|---|---|---|
| 301 | 306 | 520 | |||
| Alabama(9) Arkansas(6) Connecticut(8) Georgia(12) Hawaii(4) Louisiana(10) Maine(4) Maryland(10) Michigan(21) Minnesota(10) Mississippi(7) New York(41) North Carolina(1)* Pennsylvania(27) Rhode Island(4) Texas(26) Washington(9) West Virginia(6) |
Virginia(1)† |
* Nixon received only 12 out of North Carolina's 13 electoral votes in 1968
† Nixon received only 11 out of Virginia's 12 electoral votes in 1972
1976 vs. 1972
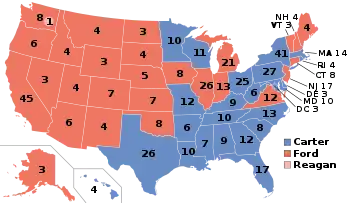
Electoral votes of the party that won in 1976: Democratic Party
| 1972 electoral vote George McGovern |
Gains | Losses | 1976 electoral vote Jimmy Carter |
|---|---|---|---|
| 17 | 297 | ||
| Alabama(9) Arkansas(6) Delaware(3) Florida(17) Georgia(12) Hawaii(4) Kentucky(9) Louisiana(10) Maryland(10) Minnesota(10) Mississippi(7) Missouri(12) New York(41) North Carolina(13) Ohio(25) Pennsylvania(27) Rhode Island(4) South Carolina(8) Tennessee(10) Texas(26) West Virginia(6) Wisconsin(11) |
1980 vs. 1976
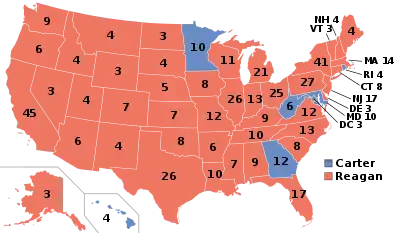
Electoral votes of the party that won in 1980: Republican Party
| 1976 electoral vote Gerald Ford |
Gains | Losses | 1980 electoral vote Ronald Reagan |
|---|---|---|---|
| 240 | 489 | ||
| Alabama(9) Arkansas(6) Delaware(3) Florida(17) Kentucky(9) Louisiana(10) Massachusetts(14) Mississippi(7) Missouri(12) New York(41) North Carolina(13) Ohio(25) Pennsylvania(27) South Carolina(8) Tennessee(10) Texas(26) Washington(1)* Wisconsin(11) |
* Ford received only 8 of Washington's 9 electoral votes in 1976, while 1 faithless elector voted for Reagan
1984 vs. 1980
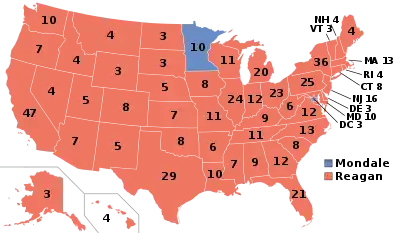
Electoral votes of the party that won in 1984: Republican Party
| 1980 electoral vote Ronald Reagan |
Gain due to reapportionment |
1980 result under the 1984 apportionment |
Gains | Losses | 1984 electoral vote Ronald Reagan |
|---|---|---|---|---|---|
| 489 | 489 | 525 | |||
| Georgia(12) Hawaii(4) Maryland(10) Rhode Island(4) West Virginia(6) |
1988 vs. 1984
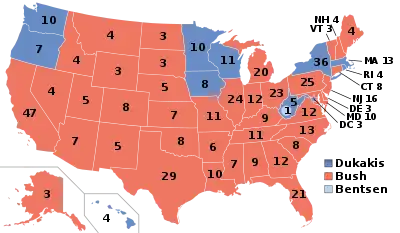
Electoral votes of the party that won in 1988: Republican Party
| 1984 electoral vote Ronald Reagan |
Gains | Losses | 1988 electoral vote George H. W. Bush |
|---|---|---|---|
| 525 | 426 | ||
| Hawaii(4) Iowa(8) Massachusetts(13) New York(36) Oregon(7) Rhode Island(4) Washington(10) West Virginia(6) Wisconsin(11) |
1992 vs. 1988
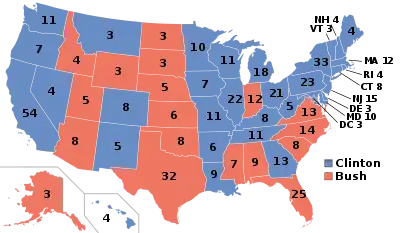
Electoral votes of the party that won in 1992: Democratic Party
| 1988 electoral vote Michael Dukakis |
Loss due to reapportionment |
1988 result under the 1992 apportionment |
Gains | Losses | 1992 electoral vote Bill Clinton |
|---|---|---|---|---|---|
| 111 | 106 | 370 | |||
| Arkansas(6) California(54) Colorado(8) Connecticut(8) Delaware(3) Georgia(13) Illinois(22) Kentucky(8) Louisiana(9) Maine(4) Maryland(10) Michigan(18) Missouri(11) Montana(3) Nevada(4) New Hampshire(4) New Jersey(15) New Mexico(5) Ohio(21) Pennsylvania(23) Tennessee(11) Vermont(3) West Virginia(1)* |
* Dukakis received only 5 of West Virginia's 6 electoral votes in 1988, while 1 faithless elector voted for his running mate Lloyd Bentsen. Due to reapportionment, West Virginia had 5 electoral votes in 1992, of which Clinton won all of them
1996 vs. 1992
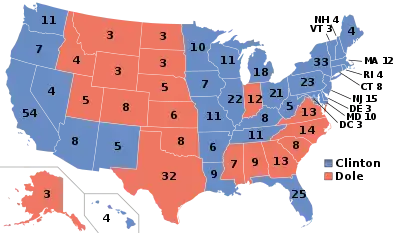
Electoral votes of the party that won in 1996: Democratic Party
| 1992 electoral vote Bill Clinton |
Gains | Losses | 1996 electoral vote Bill Clinton |
|---|---|---|---|
| 370 | 379 | ||
| Arizona(8) Florida(25) |
Colorado(8) Georgia(13) Montana(3) |
2000 vs. 1996
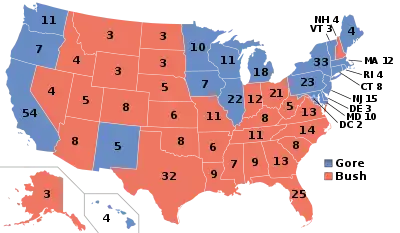
Electoral votes of the party that won in 2000: Republican Party
| 1996 electoral vote Bob Dole |
Gains | Losses | 2000 electoral vote George W. Bush |
|---|---|---|---|
| 159 | 271 | ||
| Arizona(8) Arkansas(6) Florida(25) Kentucky(8) Louisiana(9) Missouri(11) Nevada(4) New Hampshire(4) Ohio(21) Tennessee(11) West Virginia(5) |
2004 vs. 2000
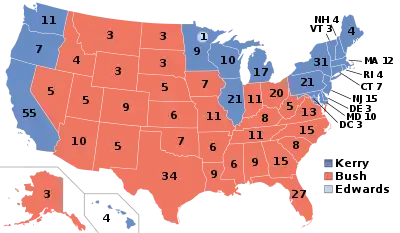
Electoral votes of the party that won in 2004: Republican Party
| 2000 electoral vote George W. Bush |
Gain due to reapportionment |
2000 result under the 2004 apportionment |
Gains | Losses | 2004 electoral vote George W. Bush |
|---|---|---|---|---|---|
| 271 | 278 | 286 | |||
| Iowa(7) New Mexico(5) |
New Hampshire(4) |
2008 vs. 2004
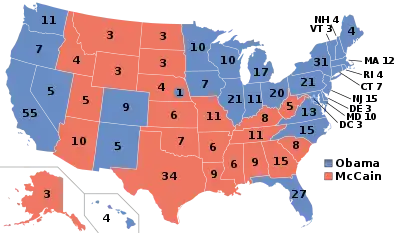
Electoral votes of the party that won in 2008: Democratic Party
| 2004 electoral vote John Kerry |
Gains | 2008 electoral vote Barack Obama |
|---|---|---|
| 251 | 365 | |
| Colorado(9) Florida(27) Indiana(11) Iowa(7) Minnesota(1)* Nebraska(1)** Nevada(5) New Mexico(5) North Carolina(15) Ohio(20) Virginia(13) |
* Kerry received only 9 of Minnesota's 10 electoral votes in 2004, while 1 faithless elector voted for his running mate John Edwards
** Obama received 1 out of Nebraska's 5 total electoral votes
2012 vs. 2008
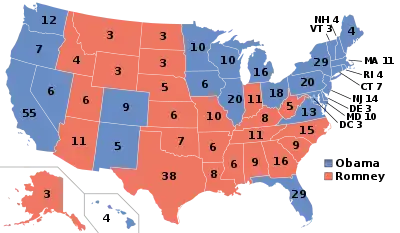
Electoral votes of the party that won in 2012: Democratic Party
| 2008 electoral vote Barack Obama |
Loss due to reapportionment |
2008 result under the 2012 apportionment |
Gains | Losses | 2012 electoral vote Barack Obama |
|---|---|---|---|---|---|
| 365 | 359 | 332 | |||
| Indiana(11) Nebraska(1)* North Carolina(15) |
* While Obama received 1 out of Nebraska's total electoral votes in 2008, he lost all of the state's votes in 2012
2016 vs. 2012
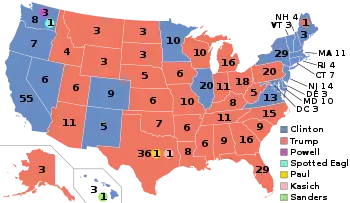
Electoral votes of the party that won in 2016: Republican Party
| 2012 electoral vote Mitt Romney |
Gains | Losses | 2016 electoral vote Donald Trump |
|---|---|---|---|
| 206 | 304 | ||
| Florida (29) Iowa (6) Maine (1)* Michigan (16) Ohio (18) Pennsylvania (20) Wisconsin (10) |
Texas (2)† |
*Trump received one of Maine's four electoral votes, for his win in Maine's second Congressional district
†Trump received 36 of Texas's 38 electoral votes, while two faithless electors voted for other candidates
2020 vs. 2016
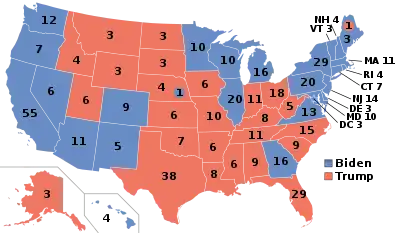
Electoral votes of the party that won in 2020: Democratic Party
| 2016 electoral vote Hillary Clinton |
Gains | Losses | 2020 electoral vote Joe Biden |
|---|---|---|---|
| 227 | 306 | ||
| Arizona (11) Georgia (16) Michigan (16) Nebraska (1)* Pennsylvania (20) Wisconsin (10) Hawaii (1)† Washington (4)†† |
*Biden received one of Nebraska's five electoral votes, for his win in Nebraska's second Congressional district
†In 2016, Clinton received 3 of Hawaii's 4 electoral votes, while 1 faithless elector voted for Bernie Sanders in 2016
††In 2016, Clinton received 8 of Washington's 12 electoral votes, while 4 faithless electors voted for other candidates in 2016
