2020 United States presidential election in Florida
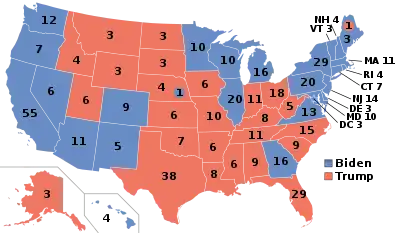
The 2020 United States presidential election in Florida was held on Tuesday, November 3, 2020, as part of the 2020 United States elections in which all 50 states plus the District of Columbia participated.[2] Florida voters chose electors to represent them in the Electoral College via a popular vote, pitting the Republican Party's nominee, incumbent president Donald Trump, and running mate Vice President Mike Pence against Democratic Party nominee, former vice president Joe Biden, and his running mate California senator Kamala Harris. Florida has 29 electoral votes in the Electoral College.[3]
| ||||||||||||||||||||||||||
| Turnout | 77.17% (of registered voters)[1] | |||||||||||||||||||||||||
|---|---|---|---|---|---|---|---|---|---|---|---|---|---|---|---|---|---|---|---|---|---|---|---|---|---|---|
| ||||||||||||||||||||||||||
 County results
| ||||||||||||||||||||||||||
| ||||||||||||||||||||||||||
.jpg.webp)

| Elections in Florida |
|---|
 |
|
|
Florida was one of six states where Trump received more percentage of the two-party vote than he did in 2016. [lower-alpha 1]
Miami Beach, Florida, which hosted the 1972 Democratic National Convention, was a finalist to host the 2020 Democratic National Convention.[4] The other finalists were Milwaukee and Houston; Milwaukee was ultimately selected as the host.[5][6] Florida was Trump's state of residency for this election, after having identified New York as his home state in 2016.[7] As a result, Trump became the first nominee of either major party to be a Florida resident. Biden was selected as the Democratic nominee in the 2020 Florida Democratic presidential primary on March 17, 2020.
Prior to the election, aggregate polls had Joe Biden in the lead in Florida by up to almost 3 points. Despite this, Trump won the state by a 3.4% margin, improving upon his margin from 2016 over Hillary Clinton by 2.2%; it was the largest margin for any presidential election in Florida since 2004. This was due to increased support among Latino voters in the state, particularly in Miami-Dade County, which Biden carried by just a 7.3% margin, significantly lower than Clinton's 29.4% margin in 2016 or Obama's 23.7% margin in 2012.[8] Trump carried Latinos of Cuban heritage with 58%, while Biden carried Puerto Ricans with 66%, and Trump and Biden split the South American vote with 50% each.[9][10] Trump labeled Biden as a "trojan horse for socialism".[11] In this election, Florida voted 7.9 points right of the nation as a whole, the furthest it has voted from the nation since 1988, when Florida voted 14.6 points right of the nation.
This election was the first time since 1992, and only the second time since 1960, that Florida went to the losing candidate in a presidential election. It was also the first time since 1960 that both Ohio and Florida have voted for the losing candidate in a presidential election, the first time since 1992 that Florida voted Republican while neighboring Georgia voted Democratic, and the first time since 1992 that Florida voted more Republican than North Carolina.
Despite his loss statewide, Biden became the first Democrat to win Duval County since Southerner Jimmy Carter in 1976, and the first Democrat to win Seminole County since Harry Truman in 1948.[12][13] Biden also flipped Pinellas County back to the Democratic Party. Biden became the first Democrat to win the presidency without carrying St. Lucie County since 1992, and the first Democrat to win the presidency without carrying Monroe County.
Florida is one of three states that voted twice for both Barack Obama and Trump, with the other two being Ohio and Iowa.
Primary elections
The primary elections were held on March 17, 2020.
Republican primary
The Florida secretary of state declared Rocky De La Fuente to be a major candidate and thus worthy of automatic inclusion on the ballot.
| Candidate | Votes | % | Estimated delegates |
|---|---|---|---|
| Donald Trump | 1,162,984 | 93.79 | 122 |
| Bill Weld | 39,319 | 3.17 | |
| Joe Walsh (withdrawn) | 25,464 | 2.05 | |
| Rocky De La Fuente | 12,172 | 0.98 | |
| Total | 1,239,939 | 100% | 122 |
Democratic primary
Three Democrats were still in race by the time Florida held its primaries: Vermont senator Bernie Sanders, former vice president Joe Biden, and representative from Hawaii Tulsi Gabbard.[16][17][18]
The first Democratic debate took place in Miami over two nights at the end of June 2019. It was broadcast on several of the NBC networks.[19]
| Candidate | Votes | % | Delegates[21] |
|---|---|---|---|
| Joe Biden | 1,077,375 | 61.95 | 162 |
| Bernie Sanders | 397,311 | 22.84 | 57 |
| Michael Bloomberg (withdrawn) | 146,544 | 8.43 | 0 |
| Pete Buttigieg (withdrawn) | 39,886 | 2.29 | 0 |
| Elizabeth Warren (withdrawn) | 32,875 | 1.89 | 0 |
| Amy Klobuchar (withdrawn) | 17,276 | 0.99 | 0 |
| Tulsi Gabbard | 8,712 | 0.50 | 0 |
| Andrew Yang (withdrawn) | 5,286 | 0.30 | 0 |
| Michael Bennet (withdrawn) | 4,244 | 0.24 | 0 |
| Tom Steyer (withdrawn) | 2,510 | 0.14 | 0 |
| Marianne Williamson (withdrawn) | 1,744 | 0.10 | 0 |
| John Delaney (withdrawn) | 1,583 | 0.09 | 0 |
| Cory Booker (withdrawn) | 1,507 | 0.09 | 0 |
| Julián Castro (withdrawn) | 1,036 | 0.06 | 0 |
| Joe Sestak (withdrawn) | 664 | 0.04 | 0 |
| Deval Patrick (withdrawn) | 661 | 0.04 | 0 |
| Total | 1,739,214 | 100% | 219 |
General election
Predictions
| Source | Ranking | As of |
|---|---|---|
| The Cook Political Report[22] | Tossup | November 3, 2020 |
| Inside Elections[23] | Tilt D (flip) | November 3, 2020 |
| Sabato's Crystal Ball[24] | Lean R | November 3, 2020 |
| Politico[25] | Tossup | November 3, 2020 |
| RCP[26] | Tossup | November 3, 2020 |
| Niskanen[27] | Likely D (flip) | November 3, 2020 |
| CNN[28] | Tossup | November 3, 2020 |
| The Economist[29] | Lean D (flip) | November 3, 2020 |
| CBS News[30] | Tossup | November 3, 2020 |
| 270towin[31] | Tossup | November 3, 2020 |
| ABC News[32] | Tossup | November 3, 2020 |
| NPR[33] | Tossup | November 3, 2020 |
| NBC News[34] | Tossup | November 3, 2020 |
| 538[35] | Lean D (flip) | November 3, 2020 |
Polling
Graphical summary
Aggregate polls
| Source of poll aggregation |
Dates administered |
Dates updated |
Joe Biden Democratic |
Donald Trump Republican |
Other/ Undecided[lower-alpha 2] |
Margin |
|---|---|---|---|---|---|---|
| 270 to Win | October 24 – November 1, 2020 | November 3, 2020 | 48.7% | 46.0% | 5.3% | Biden +2.7 |
| Real Clear Politics | October 28 – November 2, 2020 | November 3, 2020 | 47.9% | 47.0% | 5.1% | Biden +0.9 |
| FiveThirtyEight | until November 2, 2020 | November 3, 2020 | 49.1% | 46.6% | 4.3% | Biden +2.5 |
| Average | 48.6% | 46.5% | 4.9% | Biden +2.1 | ||
State polls
| Poll source | Date(s) administered |
Sample size[lower-alpha 3] |
Margin of error |
Donald Trump Republican |
Joe Biden Democratic |
Jo Jorgensen Libertarian |
Howie Hawkins Green |
Other | Undecided |
|---|---|---|---|---|---|---|---|---|---|
| Insider Advantage/Fox 35 | Nov 1–2, 2020[lower-alpha 4] | 400 (LV) | ± 4.4% | 48% | 47% | 2% | - | – | 3% |
| Trafalgar Group | Oct 31 – Nov 2, 2020 | 1,054 (LV) | ± 2.94% | 49% | 47% | 2% | - | 1%[lower-alpha 5] | 1% |
| SurveyMonkey/Axios | Oct 20 – Nov 2, 2020 | 8,792 (LV) | ± 1.5% | 49%[lower-alpha 6] | 49% | - | - | – | – |
| AYTM/Aspiration | Oct 30 – Nov 1, 2020 | 517 (LV) | – | 43% | 45% | - | - | – | – |
| Change Research/CNBC | Oct 29 – Nov 1, 2020 | 806 (LV) | ± 3.45% | 48% | 51% | 0% | 0% | – | 1% |
| Susquehanna Polling & Research Inc./Center for American Greatness[upper-alpha 1] | Oct 29 – Nov 1, 2020 | 400 (LV) | ± 4.9% | 47% | 46% | 2% | - | 2%[lower-alpha 7] | 3% |
| Quinnipiac University | Oct 28 – Nov 1, 2020 | 1,657 (LV) | ± 2.4% | 42% | 47% | - | - | 1%[lower-alpha 8] | 9% |
| Swayable | Oct 27 – Nov 1, 2020 | 1,261 (LV) | ± 3.7% | 46% | 53% | 1% | 1% | – | – |
| Data for Progress | Oct 27 – Nov 1, 2020 | 1,202 (LV) | ± 2.8% | 48% | 51% | 1% | 1% | 0%[lower-alpha 9] | – |
| Ipsos/Reuters | Oct 27 – Nov 1, 2020 | 670 (LV) | ± 4.3% | 46%[lower-alpha 10] | 50% | 1% | 0% | 1%[lower-alpha 11] | – |
| 46%[lower-alpha 12] | 50% | - | - | 2%[lower-alpha 13] | 2% | ||||
| 47%[lower-alpha 14] | 51% | - | - | 2%[lower-alpha 15] | – | ||||
| Frederick Polls/Compete Everywhere[upper-alpha 2] | Oct 30–31, 2020 | 768 (LV) | ± 3.5% | 49% | 51% | - | - | – | – |
| Pulse Opinion Research/Rasmussen Reports | Oct 29–31, 2020 | 800 (LV) | ± 3.5% | 47% | 48% | - | - | 3%[lower-alpha 16] | – |
| Siena College/NYT Upshot | Oct 27–31, 2020 | 1,451 (LV) | ± 3.2% | 44% | 47% | 2% | 1% | 0%[lower-alpha 17] | 6%[lower-alpha 18] |
| Morning Consult | Oct 22–31, 2020 | 4,451 (LV) | ± 2% | 45% | 52% | - | - | – | – |
| St. Pete Polls | Oct 29–30, 2020 | 2,758 (LV) | ± 1.9% | 48% | 49% | 1% | - | – | 2% |
| RMG Research/PoliticalIQ | Oct 28–30, 2020 | 1,200 (LV) | ± 2.8% | 47%[lower-alpha 10] | 51% | - | - | 2%[lower-alpha 19] | 0% |
| 45%[lower-alpha 20] | 52% | - | - | 2%[lower-alpha 21] | 0% | ||||
| 48%[lower-alpha 22] | 49% | - | - | 2%[lower-alpha 23] | 0% | ||||
| Targoz Market Research/PollSmart | Oct 25–30, 2020 | 1,027 (LV) | – | 47% | 51% | - | - | 2%[lower-alpha 24] | – |
| AtlasIntel | Oct 28–29, 2020 | 786 (LV) | ± 3% | 48.5% | 48.5% | - | - | – | 3% |
| Public Policy Polling/Climate Power 2020[upper-alpha 3] | Oct 28–29, 2020 | 941 (V) | – | 45% | 52% | - | - | – | 3% |
| Harvard-Harris/The Hill | Oct 26–29, 2020 | 1,148 (LV) | ± >=3% | 47% | 50% | - | - | – | 3% |
| ABC/Washington Post | Oct 24–29, 2020 | 824 (LV) | ± 4% | 50% | 48% | 1% | 0% | 0%[lower-alpha 25] | 0% |
| Redfield & Wilton Strategies | Oct 27–28, 2020 | 1,587 (LV) | – | 46% | 50% | 1% | 0% | 0% | 3% |
| Trafalgar Group | Oct 25–28, 2020 | 1,088 (LV) | ± 2.89% | 50% | 47% | 2% | - | 1%[lower-alpha 26] | 1% |
| Monmouth University | Oct 24–28, 2020 | 509 (RV) | ± 4.7% | 45% | 50% | 1% | 0% | 1%[lower-alpha 27] | 2% |
| 509 (LV) | 45%[lower-alpha 28] | 51% | - | - | – | – | |||
| 46%[lower-alpha 29] | 50% | - | - | – | – | ||||
| SurveyMonkey/Axios | Oct 1–28, 2020 | 14,571 (LV) | – | 50% | 48% | - | - | – | – |
| Marist College/NBC | Oct 25–27, 2020 | 743 (LV) | ± 4.4% | 47% | 51% | - | - | 1% | 1% |
| Quinnipiac University | Oct 23–27, 2020 | 1,324 (LV) | ± 2.7% | 42% | 45% | - | - | 1%[lower-alpha 30] | 11% |
| Ipsos/Reuters | Oct 21–27, 2020 | 704 (LV) | ± 4.2% | 47%[lower-alpha 10] | 48% | 1% | 1% | 2%[lower-alpha 31] | – |
| 47%[lower-alpha 32] | 49% | - | - | 3%[lower-alpha 33] | 2% | ||||
| Swayable | Oct 23–26, 2020 | 605 (LV) | ± 5.4% | 51% | 46% | 2% | 1% | – | – |
| YouGov/Institute of Politics at Florida State University | Oct 16–26, 2020 | 1,200 (LV) | ± 3.2% | 46% | 48% | - | - | – | 6% |
| Wick Surveys | Oct 24–25, 2020 | 1,000 (LV) | ± 3.1% | 50% | 47% | - | - | – | – |
| Florida Atlantic University | Oct 24–25, 2020 | 937 (LV) | ± 3.1% | 48% | 50% | - | - | 2%[lower-alpha 34] | – |
| Susquehanna Polling & Research Inc./Center for American Greatness[upper-alpha 1] | Oct 23–25, 2020 | 400 (LV) | ± 4.9% | 49% | 44% | 2% | - | 3%[lower-alpha 35] | 3% |
| Univision/University of Houston/Latino Decisions/North Star Opinion Research |
Oct 17–25, 2020 | 743 (RV) | ± 3.56% | 46% | 49% | - | - | 2%[lower-alpha 36] | 3% |
| Ryan Tyson (R) | Released Oct 24, 2020 | – (V)[lower-alpha 37] | – | 47% | 45% | - | - | 3%[lower-alpha 38] | 4% |
| Gravis Marketing | Oct 24, 2020 | 665 (LV) | ± 3.8% | 48% | 47% | - | - | – | 5% |
| YouGov/CBS | Oct 20–23, 2020 | 1,228 (LV) | ± 3.6% | 48% | 50% | - | - | 2%[lower-alpha 39] | 0% |
| St. Pete Polls/Florida Politics | Oct 21–22, 2020 | 2,527 (LV) | ± 2% | 47% | 49% | - | - | 2%[lower-alpha 40] | 2% |
| RMG Research/PoliticalIQ | Oct 20–22, 2020 | 800 (LV) | ± 3.5% | 48%[lower-alpha 10] | 50% | - | - | 1%[lower-alpha 41] | 1% |
| 46%[lower-alpha 42] | 52% | - | - | 1%[lower-alpha 43] | 1% | ||||
| 48%[lower-alpha 44] | 46% | - | - | 1%[lower-alpha 45] | 1% | ||||
| Pulse Opinion Research/Rasmussen Reports | Oct 20–21, 2020 | 800 (LV) | ± 3.5% | 50% | 46% | - | - | 3%[lower-alpha 46] | 3% |
| Ipsos/Reuters | Oct 14–21, 2020 | 662 (LV) | ± 4.3% | 46%[lower-alpha 10] | 51% | 1% | 0% | 2%[lower-alpha 47] | – |
| 46%[lower-alpha 48] | 50% | - | - | 1%[lower-alpha 49] | 3% | ||||
| Citizen Data | Oct 17–20, 2020 | 1,000 (LV) | ± 3.1% | 45% | 50% | 1% | 0% | 1% | 4% |
| Civiqs/Daily Kos | Oct 17–20, 2020 | 863 (LV) | ± 3.5% | 47% | 51% | - | - | 1%[lower-alpha 50] | 1% |
| CNN/SSRS | Oct 15–20, 2020 | 847 (LV) | ± 4% | 46% | 50% | 1% | 1% | 0%[lower-alpha 51] | 1% |
| Morning Consult | Oct 11–20, 2020 | 4,685 (LV) | ± 1.4% | 45% | 52% | - | - | – | – |
| Change Research/CNBC | Oct 16–19, 2020 | 547 (LV)[lower-alpha 4] | – | 45% | 50% | - | - | – | – |
| University of North Florida | Oct 12–16, 2020 | 863 (LV) | ± 3.3% | 47% | 48% | - | - | 1%[lower-alpha 52] | 3% |
| HarrisX/The Hill | Oct 12–15, 2020 | 965 (LV) | – | 48% | 48% | - | - | – | 4% |
| Ipsos/Reuters | Oct 7–14, 2020 | 653 (LV) | ± 4.4% | 47%[lower-alpha 10] | 50% | 0% | 0% | 2%[lower-alpha 53] | – |
| 47%[lower-alpha 54] | 49% | - | - | 1%[lower-alpha 55] | 3% | ||||
| Trafalgar Group | Oct 11–13, 2020 | 1,051 (LV) | ± 2.94% | 48% | 46% | 2% | 1% | 1%[lower-alpha 56] | 2% |
| Redfield & Wilton Strategies | Oct 10–13, 2020 | 1,519 (LV) | – | 44%[lower-alpha 4] | 50% | 1% | 0% | – | – |
| St. Pete Polls/Florida Politics | Oct 11–12, 2020 | 2,215 (LV) | ± 2.1% | 47% | 49% | - | - | 1%[lower-alpha 57] | 2% |
| Emerson College | Oct 10–12, 2020 | 690 (LV) | ± 3.7% | 48%[lower-alpha 58] | 51% | - | - | 1%[lower-alpha 59] | – |
| Mason-Dixon | Oct 8–12, 2020 | 625 (LV) | ± 4% | 45% | 48% | - | - | 1%[lower-alpha 60] | 6% |
| Clearview Research | Oct 7–12, 2020 | 550 (LV) | ± 4.18% | 40%[lower-alpha 10] | 47% | - | - | 4%[lower-alpha 61] | 9% |
| 39%[lower-alpha 62] | 48% | - | - | 4%[lower-alpha 63] | 9% | ||||
| 41%[lower-alpha 64] | 46% | - | - | 4%[lower-alpha 65] | 9% | ||||
| Morning Consult | Oct 2–11, 2020 | 4,785 (LV) | ± 1.4% | 46% | 51% | - | - | – | – |
| Redfield & Wilton Strategies | Oct 9–10, 2020 | 750 (LV) | – | 42%[lower-alpha 4] | 53% | 1% | 0% | – | – |
| Florida Atlantic University | Oct 9–10, 2020 | 644 (LV) | ± 3.8% | 47% | 51% | - | - | 2%[lower-alpha 66] | – |
| RMG Research/PoliticalIQ | Oct 4–8, 2020 | 800 (LV) | – | 46%[lower-alpha 10] | 48% | 1% | 1% | 1% | 4% |
| 44%[lower-alpha 67] | 50% | 1% | 1% | 1% | 4% | ||||
| 47%[lower-alpha 68] | 46% | 1% | 1% | 1% | 4% | ||||
| Insider Advantage/Hannity Exclusive (R) | Oct 6–7, 2020 | 400 (LV) | ± 4.9% | 49% | 46% | 1% | - | – | 10% |
| YouGov/CCES | Sep 29 – Oct 7, 2020 | 3,755 (LV) | – | 47% | 49% | - | - | – | – |
| Ipsos/Reuters | Sep 29 – Oct 7, 2020 | 678 (LV) | ± 4.3% | 45% | 49% | - | - | 1%[lower-alpha 69] | 5% |
| Redfield & Wilton Strategies | Oct 4–6, 2020 | 998 (LV) | ± 3.1% | 44% | 49% | 1% | 0% | 1%[lower-alpha 70] | 6% |
| Quinnipiac University | Oct 1–5, 2020 | 1,256 (LV) | ± 2.8% | 40% | 51% | - | - | 1%[lower-alpha 71] | 7% |
| Change Research/CNBC | Oct 2–4, 2020 | 560 (LV) | – | 46% | 50% | - | - | – | – |
| Suffolk University/USA Today | Oct 1–4, 2020 | 500 (LV) | ± 4.4% | 45%[lower-alpha 10] | 45% | 2% | 0%[lower-alpha 72] | 2%[lower-alpha 73] | 6% |
| 46%[lower-alpha 74] | 45% | - | - | 2%[lower-alpha 75] | 7% | ||||
| University of North Florida | Oct 1–4, 2020 | 3,134 (LV) | ± 1.8% | 45% | 51% | - | - | 1%[lower-alpha 76] | 3%[lower-alpha 77] |
| St. Leo University | Sep 27 – Oct 2, 2020 | 489 (LV) | – | 44% | 50% | - | - | – | 5% |
| Siena College/NYT Upshot | Sep 30 – Oct 1, 2020 | 710 (LV) | ± 4.2% | 42% | 47% | 2% | 1% | 0%[lower-alpha 78] | 8%[lower-alpha 79] |
| SurveyMonkey/Axios | Sep 1–30, 2020 | 12,962 (LV) | – | 47% | 51% | - | - | – | 2% |
| Cherry Communications/Florida Chamber of Commerce | Sep 23–29, 2020 | 600 (LV) | ± 4% | 44%[lower-alpha 4] | 49% | - | - | – | – |
| Susquehanna Polling & Research Inc./Center for American Greatness[upper-alpha 1] | Sep 23–26, 2020 | 500 (LV) | ± 4.3% | 43% | 46% | 3% | - | – | 8%[lower-alpha 80] |
| Redfield & Wilton Strategies | Sep 23–25, 2020 | 1,073 (LV) | ± 2.99% | 43% | 48% | 1% | 1% | 1%[lower-alpha 81] | 7% |
| St. Pete Polls | Sep 21–22, 2020 | 2,906 (LV) | ± 1.8% | 47% | 50% | - | - | 2%[lower-alpha 82] | 2% |
| Data For Progress[upper-alpha 4] | Sep 15–22, 2020 | 620 (LV) | ± 3.9% | 43% | 46% | - | - | – | 11% |
| Change Research/CNBC | Sep 18–20, 2020 | 702 (LV) | – | 46% | 49% | - | - | – | – |
| ABC/Washington Post | Sep 15–20, 2020 | 613 (LV) | ± 4.5% | 51% | 47% | - | - | 1%[lower-alpha 83] | 1% |
| Hart Research Associates/Human Rights Campaign[upper-alpha 5] | Sep 17–19, 2020 | 400 (LV) | ± 4.9% | 45% | 51% | - | - | – | – |
| YouGov/CBS | Sep 15–18, 2020 | 1,205 (LV) | ± 3.7% | 46% | 48% | - | - | 1%[lower-alpha 84] | 5% |
| Ipsos/Reuters | Sep 11–17, 2020 | 586 (LV) | ± 4.6% | 47% | 47% | - | - | 2%[lower-alpha 85] | 4% |
| Redfield & Wilton Strategies | Sep 12–14, 2020 | 1,158 (LV) | ± 2.88% | 44% | 47% | 1% | 1% | 1%[lower-alpha 86] | 6% |
| Monmouth University | Sep 10–13, 2020 | 428 (RV) | ± 4.7% | 45% | 50% | 2% | 0% | 1%[lower-alpha 87] | 3% |
| 428 (LV) | 45%[lower-alpha 88] | 50% | - | - | 1%[lower-alpha 89] | 3% | |||
| 46%[lower-alpha 90] | 49% | - | - | 1%[lower-alpha 91] | 3% | ||||
| Kaiser Family Foundation/Cook Political Report | Aug 29 – Sep 13, 2020 | 1,009 (RV) | ± 4.0% | 42% | 43% | - | - | 4%[lower-alpha 92] | 11% |
| Florida Atlantic University | Sep 11–12, 2020 | 631 (LV) | ± 3.8% | 50% | 50% | - | - | 0%[lower-alpha 93] | – |
| St. Pete Polls/Florida Politics/AARP | Sep 7–8, 2020 | 2,689 (LV) | ± 1.9% | 47% | 50% | - | - | 2%[lower-alpha 94] | 2% |
| Benenson Strategy Group/GS Strategy Group/AARP | Aug 30 – Sep 8, 2020 | 1,600 (LV) | ± 2.5% | 46% | 48% | - | - | 2%[lower-alpha 95] | 4% |
| Morning Consult | Aug 29 – Sep 7, 2020 | 3,914 (LV) | ± (2%-4%) | 43%[lower-alpha 96] | 50% | - | - | – | – |
| Change Research/CNBC | Sep 4–6, 2020 | 1,144 (LV) | – | 46% | 49% | - | - | 4%[lower-alpha 97] | – |
| Marist College/NBC | Aug 31 – Sep 5, 2020 | 760 (LV) | ± 4.5% | 48% | 48% | - | - | 1% | 2% |
| Trafalgar Group | Sep 1–3, 2020 | 1,022 (LV) | ± 3.0% | 49% | 46% | 2% | - | 1%[lower-alpha 98] | 2% |
| Redfield & Wilton Strategies | Aug 30 – Sep 3, 2020 | 1,093 (LV) | ± 2.96% | 43% | 48% | 1% | 1% | 1%[lower-alpha 99] | 6% |
| GQR Research (D) | Aug 26 – Sep 3, 2020 | 800 (LV) | ± 3.5% | 46% | 51% | - | - | – | – |
| Quinnipiac | Aug 28 – Sep 1, 2020 | 1,235 (LV) | ± 2.8% | 45% | 48% | - | - | 1%[lower-alpha 100] | 5% |
| SurveyMonkey/Axios | Aug 1–31, 2020 | 12,286 (LV) | – | 50% | 48% | - | - | – | 2% |
| Morning Consult | Aug 21–30, 2020 | 3,790 (LV) | ± (2%–4%) | 47% | 49% | - | - | – | – |
| Opinium/The Guardian | Aug 21–26, 2020 | 684 (LV) | – | 43% | 50% | - | - | 1% | 6% |
| Change Research/CNBC | Aug 21–23, 2020 | 1,262 (LV) | – | 46% | 49% | - | - | – | – |
| PPP | Aug 21–22, 2020 | 671 (V) | ± 3.8% | 44% | 48% | - | - | – | 7% |
| Redfield and Wilton Strategies | Aug 16, 2020 | 1,280 (LV) | – | 41% | 49% | 1% | - | 1%[lower-alpha 101] | 7% |
| Morning Consult | Aug 7–16, 2020 | 3,484 (LV) | ± (2%–4%) | 45% | 50% | - | - | – | – |
| Tyson Group/Consumer Energy Alliance[upper-alpha 6] | Aug 11–15, 2020 | 750 (LV) | ± 4% | 44% | 46% | 2% | - | 1%[lower-alpha 102] | 6% |
| Change Research/CNBC | Aug 7–9, 2020 | 469 (LV) | – | 44% | 50% | - | - | – | – |
| OnMessage Inc./Heritage Action[upper-alpha 7] | Aug 2–4, 2020 | 400 (LV) | – | 49% | 49% | - | - | – | 2% |
| SurveyMonkey/Axios | Jul 1–31, 2020 | 13,945 (LV) | – | 48% | 49% | - | - | – | 2% |
| Change Research/CNBC | Jul 24–26, 2020 | 685 (LV) | – | 45% | 48% | - | - | – | – |
| Morning Consult | Jul 17–26, 2020 | 3,760 (LV) | ± 1.6% | 46%[lower-alpha 103] | 49% | - | - | – | – |
| Morning Consult | Jul 16–25, 2020 | – (LV)[lower-alpha 104] | – | 45% | 49% | - | - | – | – |
| CNN/SSRS | Jul 18–24, 2020 | 880 (RV) | ± 3.8% | 46% | 51% | - | - | 2%[lower-alpha 105] | 2% |
| Zogby Analytics | Jul 21–23, 2020 | 811 (RV) | ± 3.4% | 43% | 43% | 3% | 2% | – | 9% |
| Mason-Dixon | Jul 20–23, 2020 | 625 (LV) | ± 4.0% | 46% | 50% | - | - | – | 4% |
| Redfield & Wilton Strategies | Jul 19–21, 2020 | 1,121 (LV) | – | 41% | 48% | 1% | 1% | 1%[lower-alpha 106] | 8% |
| Quinnipiac University | Jul 16–20, 2020 | 924 (RV) | ± 4.3% | 38% | 51% | - | - | 6%[lower-alpha 107] | 5% |
| Morning Consult | Jul 6–15, 2020 | – (LV)[lower-alpha 108] | – | 45% | 50% | - | - | – | – |
| Florida Politics/AARP Florida/St. Pete Polls | Jul 13–14, 2020 | 3,018 (RV) | ± 1.8% | 44% | 50% | - | - | 2%[lower-alpha 109] | 3% |
| Gravis Marketing | Jul 13, 2020 | 513 (LV) | ± 4.3% | 43% | 53% | - | - | – | 4% |
| Change Research/CNBC | Jul 10–12, 2020 | 1,128 (LV) | – | 43% | 50% | - | - | – | – |
| YouGov/CBS | Jul 7–10, 2020 | 1,206 (LV) | ± 3.6% | 42% | 48% | - | - | 2%[lower-alpha 110] | 8% |
| Morning Consult | Jun 26 – Jul 5, 2020 | – (LV)[lower-alpha 111] | – | 46% | 49% | - | - | – | – |
| Trafalgar Group | Jun 29 – Jul 2, 2020 | 1,072 (LV) | ± 2.91% | 46% | 46% | - | - | 5%[lower-alpha 112] | 3% |
| SurveyMonkey/Axios | Jun 8–30, 2020 | 5,663 (LV) | – | 51% | 47% | - | - | – | 2% |
| Change Research/CNBC | Jun 26–28, 2020 | 951 (LV)[lower-alpha 4] | – | 45% | 50% | - | - | – | – |
| Morning Consult | Jun 16–25, 2020 | – (LV)[lower-alpha 113] | – | 45% | 49% | - | - | – | – |
| Fox News | Jun 20–23, 2020 | 1,010 (RV) | ± 3% | 40% | 49% | - | - | 6%[lower-alpha 114] | 6% |
| Siena College/NYT Upshot | Jun 8–18, 2020 | 651 (RV) | ± 4.6% | 41% | 47% | - | - | 4%[lower-alpha 115] | 7% |
| Redfield & Wilton Strategies | Jun 14–15, 2020 | 1,079 (LV) | ± 2.98% | 41% | 45% | 1% | 1% | 1%[lower-alpha 116] | 11% |
| Morning Consult | Jun 6–15, 2020 | – (LV)[lower-alpha 117] | – | 45% | 50% | - | - | – | – |
| Change Research/CNBC | Jun 12–14, 2020 | 713 (LV)[lower-alpha 4] | – | 43% | 50% | - | - | 3%[lower-alpha 118] | – |
| Gravis Marketing/OANN | Released Jun 11, 2020 | – (V)[lower-alpha 119] | – | 50% | 50% | - | - | – | – |
| TIPP/American Greatness PAC[upper-alpha 1] | Jun 9–11, 2020 | 875 (LV) | – | 40% | 51% | - | - | 4%[lower-alpha 120] | 5% |
| Morning Consult | May 27 – Jun 5, 2020 | – (LV)[lower-alpha 121] | – | 48% | 47% | - | - | – | – |
| Change Research/CNBC | May 29–31, 2020 | 1,186 (LV)[lower-alpha 4] | – | 45% | 48% | - | - | 2% | 4% |
| Cygnal (R) | May 18–30, 2020 | 881 (LV) | ± 3.3% | 43.8% | 47% | - | - | 3.3%[lower-alpha 122] | 5.9% |
| St. Pete Polls | May 26–27, 2020 | 4,763 (RV) | ± 1.4% | 46.7% | 47.5% | - | - | 2.7%[lower-alpha 123] | 3.1% |
| Morning Consult | May 17–26, 2020 | 3,593 (LV) | – | 48%[lower-alpha 124] | 47% | - | - | – | – |
| Morning Consult | May 16–25, 2020 | – (LV)[lower-alpha 125] | – | 48% | 47% | - | - | – | – |
| Point Blank Political | May 14–17, 2020 | 2,149 (LV) | ± 3.5% | 44% | 45% | 1%[lower-alpha 126] | <1%[lower-alpha 127] | 2% | 8% |
| Point Blank Political | May 14–17, 2020 | 2,149 (LV) | ± 3.5% | 48% | 52% | - | - | – | – |
| Morning Consult | May 6–15, 2020 | – (LV)[lower-alpha 128] | – | 50% | 45% | - | - | – | – |
| Redfield & Wilton Strategies | May 10–14, 2020 | 1,014 (LV) | ± 3.1% | 43% | 45% | - | - | 3%[lower-alpha 129] | 10% |
| Florida Atlantic University | May 8–12, 2020 | 928 (RV) | ± 3.1% | 47% | 53% | - | - | – | – |
| Fox News | Apr 18–21, 2020 | 1,004 (RV) | ± 3.0% | 43% | 46% | - | - | 3% | 7% |
| Quinnipiac University | Apr 16–20, 2020 | 1,385 (RV) | ± 2.6% | 42% | 46% | - | - | 3% | 7% |
| St. Pete Polls | Apr 16–17, 2020 | 5,659 (RV) | ± 1.3% | 48% | 48% | - | - | – | 4% |
| University of North Florida | Mar 31 – Apr 4, 2020 | 3,244 (RV) | ± 1.7% | 40% | 46% | - | - | – | 8% |
| AtlasIntel | Mar 14–16, 2020 | 1,100 (RV) | ± 3.0% | 45% | 45% | - | - | 10% | – |
| Univision | Mar 6–12, 2020 | 1,071 (RV) | ± 3.0% | 48% | 45% | - | - | – | 7% |
| Florida Atlantic University | Mar 5–7, 2020 | 1,216 (RV) | ± 2.7% | 51% | 49% | - | - | – | – |
| University of North Florida | Feb, 2020 | 696 (LV) | – | 45% | 45% | - | - | – | 10%[lower-alpha 130] |
| Saint Leo University | Feb 17–22, 2020 | 900 (LV) | ± 3.5% | 40% | 51% | - | - | – | 8% |
| University of North Florida | Feb 10–18, 2020 | 668 (RV) | – | 48% | 49% | - | - | – | 3% |
| Florida Atlantic University | Jan 9–12, 2020 | 1,285 (RV) | ± 2.6% | 49% | 51% | - | - | – | – |
| Cherry Communications/Florida Chamber of Commerce[upper-alpha 8] | Jan 3–12, 2020 | 608 (LV) | ± 4% | 49% | 45% | - | - | – | – |
| Mason-Dixon | Dec 11–16, 2019 | 625 (RV) | ± 4.0% | 45% | 47% | - | - | – | 8% |
| Siena College/NYT Upshot | Oct 13–26, 2019 | 650 (LV) | ± 4.4% | 44% | 46% | - | - | – | – |
| University of North Florida | Oct 14–20, 2019 | 643 (RV) | ± 3.8% | 43% | 48% | - | - | 6%[lower-alpha 131] | 3% |
| Florida Atlantic University | Sep 12–15, 2019 | 934 (RV) | ± 3.1% | 50.5% | 49.5% | - | - | – | – |
| Quinnipiac University | Jun 12–17, 2019 | 1,279 (RV) | ± 3.3% | 41% | 50% | - | - | 1% | 6% |
| St. Pete Polls | Jun 15–16, 2019 | 3,095 (LV) | ± 1.8% | 47% | 47% | - | - | – | 6% |
| Florida Atlantic University | May 16–19, 2019 | 1,007 (RV) | ± 3.0% | 50% | 50% | - | - | – | – |
| WPA Intelligence | Apr 27–30, 2019 | 200 (LV) | ± 6.9% | 48% | 44% | - | - | – | 7% |
Former candidates | ||||||||||||||||||||||||||||||||||||||||||||||||||||||||||||||||||||||||||||||||||||||||||||||||||||||||||||||||||||||||||||||||||||||||||||||||||||||||||||||||||||||||||||||||||||||||||||||||||||||||||||||||||||||||||||||||||||||||||||||||||||||||||||||||||||||||||||||||||||||||||||||||||||||||||||||||||||||||||||||||||||||||||||||||||||||||||||||||||||||||||||||||||||||||
|---|---|---|---|---|---|---|---|---|---|---|---|---|---|---|---|---|---|---|---|---|---|---|---|---|---|---|---|---|---|---|---|---|---|---|---|---|---|---|---|---|---|---|---|---|---|---|---|---|---|---|---|---|---|---|---|---|---|---|---|---|---|---|---|---|---|---|---|---|---|---|---|---|---|---|---|---|---|---|---|---|---|---|---|---|---|---|---|---|---|---|---|---|---|---|---|---|---|---|---|---|---|---|---|---|---|---|---|---|---|---|---|---|---|---|---|---|---|---|---|---|---|---|---|---|---|---|---|---|---|---|---|---|---|---|---|---|---|---|---|---|---|---|---|---|---|---|---|---|---|---|---|---|---|---|---|---|---|---|---|---|---|---|---|---|---|---|---|---|---|---|---|---|---|---|---|---|---|---|---|---|---|---|---|---|---|---|---|---|---|---|---|---|---|---|---|---|---|---|---|---|---|---|---|---|---|---|---|---|---|---|---|---|---|---|---|---|---|---|---|---|---|---|---|---|---|---|---|---|---|---|---|---|---|---|---|---|---|---|---|---|---|---|---|---|---|---|---|---|---|---|---|---|---|---|---|---|---|---|---|---|---|---|---|---|---|---|---|---|---|---|---|---|---|---|---|---|---|---|---|---|---|---|---|---|---|---|---|---|---|---|---|---|---|---|---|---|---|---|---|---|---|---|---|---|---|---|---|---|---|---|---|---|---|---|---|---|---|---|---|---|---|---|---|---|---|---|---|---|---|---|---|---|---|---|---|---|---|---|---|---|---|---|---|---|---|---|---|---|---|---|---|---|---|---|---|---|---|---|---|---|---|---|---|---|---|---|---|---|---|---|---|---|---|---|---|---|
|
Donald Trump vs. Michael Bloomberg
Donald Trump vs. Pete Buttigieg
Donald Trump vs. Kamala Harris
Donald Trump vs. Amy Klobuchar
Donald Trump vs. Beto O'Rourke
Donald Trump vs. Bernie Sanders
Donald Trump vs. Elizabeth Warren
|
Hypothetical polling | |||||||||||||||||||||||||||||||||||||||||||||||||||||||||||||||||||||||||||||||||||||||||||||||||
|---|---|---|---|---|---|---|---|---|---|---|---|---|---|---|---|---|---|---|---|---|---|---|---|---|---|---|---|---|---|---|---|---|---|---|---|---|---|---|---|---|---|---|---|---|---|---|---|---|---|---|---|---|---|---|---|---|---|---|---|---|---|---|---|---|---|---|---|---|---|---|---|---|---|---|---|---|---|---|---|---|---|---|---|---|---|---|---|---|---|---|---|---|---|---|---|---|---|
|
with Donald Trump and Oprah Winfrey
with Donald Trump and generic Democrat
with Donald Trump and generic Opponent
with Mike Pence and Joe Biden
with Mike Pence and Kamala Harris
with Mike Pence and Elizabeth Warren
|
Results
| Party | Candidate | Votes | % | ±% | |
|---|---|---|---|---|---|
| Republican | Donald Trump Mike Pence |
5,668,731 | 51.22% | +2.20% | |
| Democratic | Joe Biden Kamala Harris |
5,297,045 | 47.86% | +0.04% | |
| Libertarian | Jo Jorgensen Spike Cohen |
70,324 | 0.64% | -1.56% | |
| Green | Howie Hawkins Angela Walker |
14,721 | 0.13% | -0.55% | |
| Reform | Rocky De La Fuente Darcy Richardson |
5,966 | 0.05% | -0.05% | |
| Socialism and Liberation | Gloria La Riva Sunil Freeman |
5,712 | 0.05% | N/A | |
| Constitution | Don Blankenship William Mohr |
3,902 | 0.04% | -0.13% | |
| Write-in | 1,055 | 0.01% | -0.26% | ||
| Total votes | 11,067,456 | 100.00% | |||
By county
| County | Donald Trump | Joe Biden | Jo Jorgensen | Howie Hawkins | Rocky De La Fuente | Gloria La Riva | Don Blankenship | Other | Margin | Total votes cast | |||||||||
|---|---|---|---|---|---|---|---|---|---|---|---|---|---|---|---|---|---|---|---|
| # | % | # | % | # | % | # | % | # | % | # | % | # | % | # | % | ||||
| Alachua | 50,972 | 35.74% | 89,704 | 62.90% | 1,390 | 0.97% | 302 | 0.21% | 70 | 0.05% | 94 | 0.07% | 52 | 0.04% | 20 | 0.01% | -38,732 | -27.16% | 142,604 |
| Baker | 11,911 | 84.72% | 2,037 | 14.49% | 93 | 0.66% | 10 | 0.07% | 4 | 0.03% | 3 | 0.02% | 1 | 0.01% | 0 | 0.00% | 9,874 | 70.23% | 14,059 |
| Bay | 66,097 | 71.05% | 25,614 | 27.53% | 1,004 | 1.08% | 142 | 0.15% | 54 | 0.06% | 45 | 0.05% | 52 | 0.06% | 16 | 0.02% | 40,483 | 43.52% | 93,024 |
| Bradford | 10,334 | 75.81% | 3,160 | 23.18% | 110 | 0.81% | 11 | 0.08% | 7 | 0.05% | 3 | 0.02% | 6 | 0.04% | 1 | 0.01% | 7,174 | 52.63% | 13,632 |
| Brevard | 207,883 | 57.62% | 148,549 | 41.18% | 3,178 | 0.88% | 553 | 0.15% | 222 | 0.06% | 164 | 0.05% | 171 | 0.05% | 44 | 0.01% | 59,334 | 16.45% | 360,764 |
| Broward | 333,409 | 34.81% | 618,752 | 64.61% | 3,114 | 0.33% | 1,253 | 0.13% | 426 | 0.04% | 417 | 0.04% | 238 | 0.02% | 63 | 0.01% | -285,343 | -29.80% | 957,672 |
| Calhoun | 5,274 | 80.82% | 1,209 | 18.53% | 29 | 0.44% | 4 | 0.06% | 4 | 0.06% | 4 | 0.06% | 2 | 0.03% | 0 | 0.00% | 4,065 | 62.29% | 6,526 |
| Charlotte | 73,243 | 62.96% | 42,273 | 36.34% | 565 | 0.49% | 129 | 0.11% | 49 | 0.04% | 32 | 0.03% | 45 | 0.04% | 4 | 0.00% | 30,970 | 26.62% | 116,340 |
| Citrus | 65,352 | 70.11% | 27,092 | 29.07% | 548 | 0.59% | 86 | 0.09% | 42 | 0.05% | 30 | 0.03% | 49 | 0.05% | 9 | 0.01% | 38,260 | 41.05% | 93,208 |
| Clay | 84,480 | 67.91% | 38,317 | 30.80% | 1,286 | 1.03% | 153 | 0.12% | 45 | 0.04% | 55 | 0.04% | 57 | 0.05% | 12 | 0.01% | 46,163 | 37.11% | 124,405 |
| Collier | 128,950 | 62.05% | 77,621 | 37.35% | 889 | 0.43% | 186 | 0.09% | 64 | 0.03% | 50 | 0.02% | 39 | 0.02% | 19 | 0.01% | 51,329 | 24.70% | 207,818 |
| Columbia | 23,836 | 72.14% | 8,914 | 26.98% | 224 | 0.68% | 28 | 0.08% | 12 | 0.04% | 20 | 0.06% | 8 | 0.02% | 0 | 0.00% | 14,922 | 45.16% | 33,042 |
| DeSoto | 8,313 | 65.67% | 4,259 | 33.64% | 52 | 0.41% | 8 | 0.06% | 12 | 0.09% | 11 | 0.09% | 4 | 0.03% | 0 | 0.00% | 4,054 | 32.02% | 12,659 |
| Dixie | 6,759 | 82.76% | 1,365 | 16.71% | 27 | 0.33% | 5 | 0.06% | 5 | 0.06% | 2 | 0.02% | 4 | 0.05% | 0 | 0.00% | 5,394 | 66.05% | 8,167 |
| Duval | 233,762 | 47.43% | 252,556 | 51.25% | 4,788 | 0.97% | 772 | 0.16% | 319 | 0.06% | 328 | 0.07% | 218 | 0.04% | 77 | 0.02% | -18,794 | -3.81% | 492,820 |
| Escambia | 96,674 | 56.74% | 70,929 | 41.63% | 2,146 | 1.26% | 256 | 0.15% | 105 | 0.06% | 137 | 0.08% | 92 | 0.05% | 33 | 0.02% | 25,745 | 15.11% | 170,372 |
| Flagler | 43,043 | 60.02% | 28,161 | 39.27% | 359 | 0.50% | 69 | 0.10% | 30 | 0.04% | 29 | 0.04% | 20 | 0.03% | 5 | 0.01% | 14,882 | 20.75% | 71,716 |
| Franklin | 4,675 | 68.26% | 2,120 | 30.95% | 27 | 0.39% | 12 | 0.18% | 4 | 0.06% | 8 | 0.12% | 3 | 0.04% | 0 | 0.00% | 2,555 | 37.30% | 6,849 |
| Gadsden | 7,465 | 31.42% | 16,153 | 67.98% | 96 | 0.40% | 21 | 0.09% | 8 | 0.03% | 10 | 0.04% | 9 | 0.04% | 0 | 0.00% | -8,688 | -36.56% | 23,762 |
| Gilchrist | 7,895 | 81.52% | 1,700 | 17.55% | 61 | 0.63% | 13 | 0.13% | 6 | 0.06% | 2 | 0.02% | 5 | 0.05% | 3 | 0.03% | 6,195 | 63.96% | 9,685 |
| Glades | 3,782 | 72.83% | 1,385 | 26.67% | 21 | 0.40% | 4 | 0.08% | 0 | 0.00% | 1 | 0.02% | 0 | 0.00% | 0 | 0.00% | 2,397 | 46.16% | 5,193 |
| Gulf | 6,113 | 74.89% | 1,985 | 24.32% | 48 | 0.59% | 5 | 0.06% | 6 | 0.07% | 0 | 0.00% | 6 | 0.07% | 0 | 0.00% | 4,128 | 50.57% | 8,163 |
| Hamilton | 3,815 | 65.44% | 1,963 | 33.67% | 33 | 0.57% | 8 | 0.14% | 6 | 0.10% | 2 | 0.03% | 2 | 0.03% | 1 | 0.02% | 1,852 | 31.77% | 5,830 |
| Hardee | 6,122 | 72.15% | 2,298 | 27.08% | 40 | 0.47% | 8 | 0.09% | 10 | 0.12% | 6 | 0.07% | 1 | 0.01% | 0 | 0.00% | 3,824 | 45.07% | 8,485 |
| Hendry | 7,906 | 61.10% | 4,929 | 38.09% | 65 | 0.50% | 13 | 0.10% | 11 | 0.09% | 8 | 0.06% | 7 | 0.05% | 1 | 0.01% | 2,977 | 23.01% | 12,940 |
| Hernando | 70,412 | 64.64% | 37,519 | 34.45% | 686 | 0.63% | 151 | 0.14% | 62 | 0.06% | 44 | 0.04% | 40 | 0.04% | 8 | 0.01% | 32,893 | 30.20% | 108,922 |
| Highlands | 34,873 | 66.84% | 16,938 | 32.47% | 223 | 0.43% | 53 | 0.10% | 28 | 0.05% | 24 | 0.05% | 28 | 0.05% | 3 | 0.01% | 17,935 | 34.38% | 52,170 |
| Hillsborough | 327,398 | 45.98% | 376,367 | 52.86% | 5,665 | 0.80% | 1,187 | 0.17% | 574 | 0.08% | 529 | 0.07% | 270 | 0.04% | 73 | 0.01% | -48,969 | -6.88% | 712,063 |
| Holmes | 8,080 | 89.10% | 924 | 10.19% | 48 | 0.53% | 9 | 0.10% | 2 | 0.02% | 1 | 0.01% | 4 | 0.04% | 0 | 0.00% | 7,156 | 78.91% | 9,068 |
| Indian River | 58,872 | 60.39% | 37,844 | 38.82% | 534 | 0.55% | 117 | 0.12% | 43 | 0.04% | 33 | 0.03% | 38 | 0.04% | 3 | 0.00% | 21,028 | 21.57% | 97,484 |
| Jackson | 15,488 | 69.08% | 6,766 | 30.18% | 116 | 0.52% | 13 | 0.06% | 13 | 0.06% | 13 | 0.06% | 5 | 0.02% | 5 | 0.02% | 8,722 | 38.90% | 22,419 |
| Jefferson | 4,479 | 53.00% | 3,897 | 46.11% | 46 | 0.54% | 13 | 0.15% | 4 | 0.05% | 4 | 0.05% | 5 | 0.06% | 3 | 0.04% | 582 | 6.89% | 8,451 |
| Lafayette | 3,128 | 85.51% | 510 | 13.94% | 14 | 0.38% | 2 | 0.05% | 1 | 0.03% | 1 | 0.03% | 2 | 0.05% | 0 | 0.00% | 2,618 | 71.57% | 3,658 |
| Lake | 125,859 | 59.56% | 83,505 | 39.52% | 1,385 | 0.66% | 254 | 0.12% | 120 | 0.06% | 96 | 0.05% | 79 | 0.04% | 16 | 0.01% | 42,354 | 20.04% | 211,314 |
| Lee | 233,247 | 59.21% | 157,695 | 40.03% | 2,016 | 0.51% | 440 | 0.11% | 187 | 0.05% | 176 | 0.04% | 121 | 0.03% | 17 | 0.00% | 75,552 | 19.18% | 393,899 |
| Leon | 57,453 | 35.26% | 103,517 | 63.54% | 1,344 | 0.82% | 271 | 0.17% | 98 | 0.06% | 122 | 0.07% | 71 | 0.04% | 53 | 0.03% | -46,064 | -28.27% | 162,929 |
| Levy | 16,749 | 72.37% | 6,205 | 26.81% | 131 | 0.57% | 25 | 0.11% | 14 | 0.06% | 7 | 0.03% | 13 | 0.06% | 1 | 0.00% | 10,544 | 45.56% | 23,145 |
| Liberty | 2,846 | 79.92% | 694 | 19.49% | 14 | 0.39% | 2 | 0.06% | 2 | 0.06% | 2 | 0.06% | 1 | 0.03% | 0 | 0.00% | 2,152 | 60.43% | 3,561 |
| Madison | 5,576 | 59.45% | 3,747 | 39.95% | 32 | 0.34% | 13 | 0.14% | 3 | 0.03% | 4 | 0.04% | 5 | 0.05% | 0 | 0.00% | 1,829 | 19.50% | 9,380 |
| Manatee | 124,987 | 57.61% | 90,166 | 41.56% | 1,287 | 0.59% | 258 | 0.12% | 96 | 0.04% | 78 | 0.04% | 69 | 0.03% | 17 | 0.01% | 34,821 | 16.05% | 216,958 |
| Marion | 127,826 | 62.54% | 74,858 | 36.63% | 1,180 | 0.58% | 228 | 0.11% | 91 | 0.04% | 98 | 0.05% | 80 | 0.04% | 15 | 0.01% | 52,968 | 25.92% | 204,376 |
| Martin | 61,168 | 61.96% | 36,893 | 37.37% | 448 | 0.45% | 105 | 0.11% | 38 | 0.04% | 35 | 0.04% | 37 | 0.04% | 2 | 0.00% | 24,275 | 24.59% | 98,726 |
| Miami-Dade | 532,833 | 46.06% | 617,864 | 53.41% | 3,329 | 0.29% | 1,289 | 0.11% | 602 | 0.05% | 579 | 0.05% | 293 | 0.03% | 27 | 0.00% | -85,031 | -7.35% | 1,156,816 |
| Monroe | 25,693 | 53.49% | 21,881 | 45.56% | 348 | 0.72% | 51 | 0.11% | 26 | 0.05% | 14 | 0.03% | 12 | 0.02% | 4 | 0.01% | 3,812 | 7.94% | 48,029 |
| Nassau | 42,566 | 72.38% | 15,564 | 26.46% | 569 | 0.97% | 43 | 0.07% | 28 | 0.05% | 12 | 0.02% | 24 | 0.04% | 5 | 0.01% | 27,002 | 45.91% | 58,811 |
| Okaloosa | 79,798 | 68.57% | 34,248 | 29.43% | 1,881 | 1.62% | 183 | 0.16% | 76 | 0.07% | 73 | 0.06% | 79 | 0.07% | 35 | 0.03% | 45,550 | 39.14% | 116,373 |
| Okeechobee | 11,470 | 71.89% | 4,390 | 27.52% | 66 | 0.41% | 7 | 0.04% | 8 | 0.05% | 4 | 0.03% | 8 | 0.05% | 1 | 0.01% | 7,080 | 44.38% | 15,954 |
| Orange | 245,398 | 37.90% | 395,014 | 61.02% | 4,685 | 0.72% | 1,146 | 0.18% | 386 | 0.06% | 444 | 0.07% | 223 | 0.03% | 107 | 0.02% | -149,616 | -23.11% | 647,403 |
| Osceola | 73,480 | 42.61% | 97,297 | 56.42% | 964 | 0.56% | 290 | 0.17% | 166 | 0.10% | 140 | 0.08% | 70 | 0.04% | 29 | 0.02% | -23,817 | -13.81% | 172,436 |
| Palm Beach | 334,711 | 43.29% | 433,572 | 56.08% | 3,040 | 0.39% | 891 | 0.12% | 356 | 0.05% | 335 | 0.04% | 188 | 0.02% | 65 | 0.01% | -98,861 | -12.79% | 773,158 |
| Pasco | 179,621 | 59.48% | 119,073 | 39.43% | 2,265 | 0.75% | 467 | 0.15% | 200 | 0.07% | 169 | 0.06% | 142 | 0.05% | 33 | 0.01% | 60,548 | 20.05% | 301,970 |
| Pinellas | 276,209 | 49.35% | 277,450 | 49.57% | 4,268 | 0.76% | 912 | 0.16% | 305 | 0.05% | 311 | 0.06% | 199 | 0.04% | 61 | 0.01% | -1,241 | -0.22% | 559,715 |
| Polk | 194,586 | 56.69% | 145,049 | 42.26% | 2,595 | 0.76% | 425 | 0.12% | 204 | 0.06% | 217 | 0.06% | 140 | 0.04% | 40 | 0.01% | 49,537 | 14.43% | 343,256 |
| Putnam | 25,514 | 70.15% | 10,527 | 28.94% | 226 | 0.62% | 50 | 0.14% | 14 | 0.04% | 21 | 0.06% | 20 | 0.05% | 1 | 0.00% | 14,987 | 41.20% | 36,373 |
| Santa Rosa | 77,385 | 72.37% | 27,612 | 25.82% | 1,645 | 1.54% | 122 | 0.11% | 60 | 0.06% | 46 | 0.04% | 55 | 0.05% | 3 | 0.00% | 49,773 | 46.55% | 106,928 |
| Sarasota | 148,370 | 54.84% | 120,110 | 44.39% | 1,507 | 0.56% | 284 | 0.10% | 102 | 0.04% | 105 | 0.04% | 70 | 0.03% | 27 | 0.01% | 28,260 | 10.44% | 270,575 |
| Seminole | 125,241 | 48.02% | 132,528 | 50.81% | 2,215 | 0.85% | 406 | 0.16% | 135 | 0.05% | 137 | 0.05% | 103 | 0.04% | 50 | 0.02% | -7,287 | -2.79% | 260,815 |
| St. Johns | 110,946 | 62.82% | 63,850 | 36.15% | 1,413 | 0.80% | 210 | 0.12% | 101 | 0.06% | 54 | 0.03% | 44 | 0.02% | 4 | 0.00% | 47,096 | 26.66% | 176,622 |
| St. Lucie | 86,831 | 50.43% | 84,137 | 48.87% | 768 | 0.45% | 209 | 0.12% | 71 | 0.04% | 82 | 0.05% | 61 | 0.04% | 10 | 0.01% | 2,694 | 1.56% | 172,169 |
| Sumter | 62,761 | 67.86% | 29,341 | 31.73% | 269 | 0.29% | 39 | 0.04% | 25 | 0.03% | 20 | 0.02% | 29 | 0.03% | 1 | 0.00% | 33,420 | 36.14% | 92,485 |
| Suwannee | 16,410 | 77.93% | 4,485 | 21.30% | 119 | 0.57% | 23 | 0.11% | 6 | 0.03% | 8 | 0.04% | 6 | 0.03% | 0 | 0.00% | 11,925 | 56.63% | 21,057 |
| Taylor | 7,751 | 76.54% | 2,299 | 22.70% | 52 | 0.51% | 11 | 0.11% | 3 | 0.03% | 6 | 0.06% | 3 | 0.03% | 2 | 0.02% | 5,452 | 53.84% | 10,127 |
| Union | 5,133 | 82.19% | 1,053 | 16.86% | 42 | 0.67% | 5 | 0.08% | 4 | 0.06% | 3 | 0.05% | 5 | 0.08% | 0 | 0.00% | 4,080 | 65.33% | 6,245 |
| Volusia | 173,821 | 56.54% | 130,575 | 42.47% | 2,156 | 0.70% | 390 | 0.13% | 160 | 0.05% | 173 | 0.06% | 141 | 0.05% | 23 | 0.01% | 43,246 | 14.07% | 307,439 |
| Wakulla | 12,874 | 69.95% | 5,351 | 29.08% | 135 | 0.73% | 18 | 0.10% | 10 | 0.05% | 6 | 0.03% | 10 | 0.05% | 0 | 0.00% | 7,523 | 40.88% | 18,404 |
| Walton | 32,947 | 75.37% | 10,338 | 23.65% | 336 | 0.77% | 43 | 0.10% | 16 | 0.04% | 15 | 0.03% | 13 | 0.03% | 3 | 0.01% | 22,609 | 51.72% | 43,711 |
| Washington | 9,876 | 80.12% | 2,347 | 19.04% | 69 | 0.56% | 15 | 0.12% | 5 | 0.04% | 10 | 0.08% | 5 | 0.04% | 0 | 0.00% | 7,529 | 61.08% | 12,327 |
| Totals | 5,668,731 | 51.22% | 5,297,045 | 47.86% | 70,324 | 0.64% | 14,721 | 0.13% | 5,966 | 0.05% | 5,712 | 0.05% | 3,902 | 0.04% | 1,055 | 0.05% | 371,686 | 3.36% | 11,067,456 |
Counties that flipped from Republican to Democratic
- Duval (largest municipality: Jacksonville)
- Pinellas (largest municipality: St. Petersburg)
- Seminole (largest municipality: Sanford)
By congressional district
| District | Trump | Biden | Representative |
|---|
Ex-felons
United States Court of Appeals for the 11th Circuit, located in Atlanta, ruled that ex-felons could not vote in Florida unless they pay fines and fees. Florida voters approved amendment 4 in November 2018, which restored voting for felons upon completion of all terms of sentence including parole or probation, except for those who committed murders or were involved in sex-crimes.[37] The Republican-controlled legislature then passed a law which required ex-felons to settle their financial obligation in courts. United States District Court in Tallahassee ruled against it in May, but the circuit court overturned it in September, which was speculated to have created further problems for ex-felons when they voted in November. Civil rights organizations including American Civil Liberties Union opposed the decision by the court.[38]
Miami-Dade County
In Miami-Dade County, the majority of Trump support came from the west and the majority of Biden support came from the east. People of Mexican, Haitian, and African descent tended to vote for Biden, while people of Cuban, Chilean and Colombian descent did so for Trump, as well as the critical Venezuelan vote swinging Republican.[39] Trump won approximately two thirds of the vote in Hialeah, whereas it was nearly evenly split four years prior.[40] Sabrina Rodriguez of Politico wrote "a vote for Trump has become about more than just him, or even the Republican Party. It’s about patriotism."[41] Due to the heavy presence of the Cuban-American community, Hialeah traditionally, as of 2020, leaned towards Republican politics.[42] Trump's coattails played a role in the election of Miami Republicans Carlos A. Giménez and Maria Elvira Salazar to the House of Representatives.
Residents of Cuban descent often had an antagonism against leftist movements due to associations with Fidel Castro.[43] Trump sought to attract these voters by implementing anti-Cuba policies.[44]
Additionally Trump made efforts to target other Hispanic demographics.[40]
See also
Notes
- The other five states were California, Hawaii, Illinois, Nevada, and New York, including Washington DC.
- Calculated by taking the difference of 100% and all other candidates combined.
- Key:
A – all adults
RV – registered voters
LV – likely voters
V – unclear - Additional data sourced from FiveThirtyEight
- "Someone else" with 1%
- Overlapping sample with the previous SurveyMonkey/Axios poll, but more information available regarding sample size
- "Refused/would not vote" with 2%; "Another candidate" with 0%
- "Someone else" with 1%
- "Other candidate or write-in" with 0%
- Standard VI response
- West (B) with 1%; "Some other candidate" and would not vote with 0%
- If only Biden, Trump and "some other candidate" were available
- "Some other candidate" with 2%; would not vote with 0%
- Results considering those who lean towards a given candidate among those initially predisposed towards abstention, indecision or a candidate besides Biden or Trump in the response section immediately above
- "Some other candidate" with 2%
- "Someone else" with 3%
- "Someone else" and would not vote with 0%
- Includes "Refused"
- "Some other candidate" with 2%
- Results generated with high Democratic turnout model
- "Some other candidate" with 2%
- Results generated with high Republican turnout model
- "Some other candidate" with 2%
- "Not sure/Someone else/Undecided" with 2%
- "None of these" and "Other" with 0%; would not vote with no voters
- "Someone else" with 1%
- "Other candidate" with 1%; "No one" with 0%
- With a likely voter turnout model featuring high turnout
- With a likely voter turnout model featuring low turnout
- "Someone else" with 1%
- "Some other candidate" and West (B) with 1%; would not vote with 0%
- If only Biden, Trump and "some other candidate" were available
- "Some other candidate" with 3%; would not vote with 0%
- "Someone else" with 2%
- "Refused/would not vote" with 2%; "Another candidate" with 1%
- "Someone else" with 2%
- Not yet released
- "Refused" with 3%
- "Other third party" with 2%
- "Third Party" with 2%
- "Some other candidate" with 1%
- Results generated with high Democratic turnout model
- "Some other candidate" with 1%
- Results generated with high Republican turnout model
- "Some other candidate" with 1%
- "Some other candidate" with 3%
- "Some other candidate" and West (B) with 1%; would not vote with 0%
- If only Biden, Trump and "some other candidate" were available
- "Some other candidate" with 1%; would not vote with 0%
- "Someone else" with 1%
- "Other" and "None of these" with 0%
- "Someone else" with 1%
- "Some other candidate" with 2%; West (B) and would not vote with 0%
- If only Biden, Trump and "some other candidate" were available
- "Some other candidate" with 1%; would not vote with 0%
- "Someone else" with 1%
- "Third party" with 1%
- With voters who lean towards a given candidate
- "Someone else" with 1%
- "One of the other party or independent tickets" with 1%
- "Someone else" with 4%
- Under a +2 Democratic turnout model
- "Someone else" with 4%
- Under a conservative +2 Republican turnout model
- "Someone else" with 4%
- "Someone else" with 2%
- Results generated with high Democratic turnout model
- Results generated with high Republican turnout model
- "Some other candidate" with 1%; would not vote with 0%
- "Another Third Party/Write-in" with 1%
- "Someone else" with 1%
- No voters
- "Refused" with 2%; La Riva (PSOL) with 1%; Blankenship (C), Fuente (A) and "other" with no voters
- With the preferences of La Riva and Jorgensen voters in an election featuring only Biden and Trump
- "Refused" with 2%; "Other" with 0%
- "Someone else" with 1%
- Includes "Refused"
- "Someone else" and would not vote with 0%
- Includes "Refused"
- Includes "Refused"
- "Another Third Party/Write-in" with 1%
- "Third party" with 2%
- "Neither" with 1%; "other" and would not vote with no voters
- "Someone else/third party" with 1%
- "Some other candidate" with 2%; would not vote with 0%
- "Another Third Party/Write-in" with 1%
- "No one" with 1%
- With a likely voter turnout model featuring higher turnout than in the 2016 presidential election
- "Other" with 1%
- With a likely voter turnout model featuring lower turnout than in the 2016 presidential election
- "Other" with 1%
- "Someone else" with 2%; "Refused" and would not vote with 1%
- "Someone else" with 0%
- "Third party" with 2%
- Would not vote with 2%
- Overlapping sample with the previous Morning Consult poll, but more information available regarding sample size
- "Other/not sure" with 4%
- "Another Party Candidate" with 1%
- "Another Third Party/Write-in" with 1%
- "Someone else" with 1%
- "Another Third Party/Write-in" with 1%
- "Refused" with 1%
- Overlapping sample with the previous Morning Consult poll, but more information available regarding sample size
- Not yet released
- "Other" with 1%; "Neither" 1%
- "Another third party/write-in" with 1%
- "Someone else" with 4%; would not vote with 2%
- Not yet released
- "Third-party candidate" with 2%
- "Someone else/third party" with 2%; would not vote with 0%
- Not yet released
- "Other party candidate" with 5%
- Not yet released
- "Other" with 4%; would not vote with 2%
- "Another candidate" and would not vote with 2%
- "Another Third Party/Write-in" with 1%
- Not yet released
- "Libertarian Party candidate/Green Party candidate" with 3%
- Not yet released
- "Other" with 3%; "prefer not to answer" with 1%
- Not yet released
- "Third party candidate" with 3.3%
- "Third party" with 2.7%
- Overlapping sample with the previous Morning Consult poll, but more information available regarding sample size
- Not yet released
- "Libertarian nominee" with 1.2%
- "Green nominee" with 0.4%
- Not yet released
- "Third party/write-in" with 3%
- Includes "Refused"
- Wouldn't vote with 6%
- Wouldn't vote with 7%
- Wouldn't vote with 8%
- Wouldn't vote with 6%
- "Would definitely not vote for Trump" with 51%
- "Consider voting for Trump" with 14%; "don't know/no answer" with 4%
- Wouldn't vote with 8%
- Wouldn't vote with 8%
- Partisan clients
- The Center for American Greatness is a pro-Trump organization
- Compete Everywhere primarily supports Democratic candidates
- Climate Power 2020 was created by the League of Conservation Voters, which endorsed Biden prior to the sampling period
- Poll sponsored by the Defend Students Action Fund.
- The Human Rights Campaign endorsed Biden prior to this poll's sampling period
- The Consumer Energy Alliance is a pro-Keystone XL lobbying group
- Heritage Action is the sister organisation of the Heritage Foundation, which exclusively endorses Republican candidates
- Poll sponsored by the Florida Chamber of Commerce PAC
- Poll sponsored by the League of Conservation Voters
References
- November 3, 2020 General Election, Florida Department of State, Division of Elections.
- Kelly, Ben (August 13, 2018). "US elections key dates: When are the 2018 midterms and the 2020 presidential campaign?". The Independent. Retrieved January 3, 2019.
- "Distribution of Electoral Votes". National Archives and Records Administration. Retrieved January 3, 2019.
- "Cruise ship hotels, zoo parties and an NBA arena: Miami's Democratic convention pitch". miamiherald. Retrieved July 1, 2018.
- "City of Milwaukee 1 of 3 finalists to host 2020 Democratic National Convention". FOX6Now.com. June 20, 2018. Retrieved July 1, 2018.
- Glauber, Bill (August 22, 2018). "Selection committee for 2020 Democratic Convention will visit Milwaukee next week". Milwaukee Journal Sentinel. Retrieved August 24, 2018.
- Haberman, Maggie (November 4, 2019). "Trump, Lifelong New Yorker, Declares Himself a Resident of Florida". The New York Times.
- Nagourney, Adam; Goldmacher, Shane; Thrush, Glenn (November 4, 2020). "Big gains among Latinos in the Miami area power Trump to victory in Florida". The New York Times. ISSN 0362-4331. Retrieved November 9, 2020.
- "Florida Voter Surveys: How Different Groups Voted". The New York Times. November 3, 2020. ISSN 0362-4331. Retrieved November 9, 2020.
- "Florida 2020 President exit polls". www.cnn.com. Retrieved November 8, 2020.
- "Trump calls Biden a 'Trojan horse for socialism'". money.yahoo.com. Retrieved January 8, 2021.
- "The Political Graveyard: Duval County, Fla". politicalgraveyard.com. Retrieved November 20, 2020.
- "The Political Graveyard: Seminole County, Fla". politicalgraveyard.com. Retrieved November 20, 2020.
- "March 17, 2020 Primary Election". Florida Department of State. Florida Division of Elections. March 31, 2020. Retrieved April 8, 2020.
- "Florida Republican Delegation 2020". The Green Papers. Retrieved March 11, 2020.
- Taylor, Kate (February 9, 2019). "Elizabeth Warren Formally Announces 2020 Presidential Bid in Lawrence, Mass". The New York Times. Retrieved February 10, 2019.
- Zhou, Li (January 21, 2019). "Kamala Harris announces her historic 2020 presidential campaign". Vox. Retrieved February 10, 2019.
- Detrow, Scott (February 1, 2019). "Cory Booker Makes It Official: He's Running For President In 2020". NPR. Retrieved February 10, 2019.
- "First Democratic Debate 2019: Highlights, candidates and more". NBC News.
- "March 17, 2020 Primary Election: Democratic Primary". Florida Department of State Division of Elections. Retrieved October 14, 2020.
- "Delegate Tracker". interactives.ap.org. Associated Press. Retrieved March 20, 2020.
- "2020 POTUS Race ratings" (PDF). The Cook Political Report. Retrieved May 21, 2019.
- "POTUS Ratings | Inside Elections". insideelections.com. Retrieved May 21, 2019.
- "Larry J. Sabato's Crystal Ball » 2020 President". crystalball.centerforpolitics.org. Retrieved November 2, 2020.
- "2020 Election Forecast". Politico. November 19, 2019.
- "Battle for White House". RCP. April 19, 2019.
- 2020 Bitecofer Model Electoral College Predictions, Niskanen Center, March 24, 2020, retrieved: April 19, 2020.
- David Chalian; Terence Burlij. "Road to 270: CNN's debut Electoral College map for 2020". CNN. Retrieved June 16, 2020.
- "Forecasting the US elections". The Economist. Retrieved July 7, 2020.
- "2020 Election Battleground Tracker". CBS News. July 12, 2020. Retrieved July 13, 2020.
- "2020 Presidential Election Interactive Map". 270 to Win.
- "ABC News Race Ratings". CBS News. July 24, 2020. Retrieved July 24, 2020.
- "2020 Electoral Map Ratings: Trump Slides, Biden Advantage Expands Over 270 Votes". NPR.org. Retrieved August 3, 2020.
- "Biden dominates the electoral map, but here's how the race could tighten". NBC News. Retrieved August 6, 2020.
- "2020 Election Forecast". FiveThirtyEight. Retrieved August 14, 2020.
- "November 3, 2020 General Election Official Results". Florida Department of State. November 17, 2020. Retrieved November 17, 2020.
- "Initiative Information". Florida Division of Elections. Retrieved September 26, 2018.
- https://www.nytimes.com/live/2020/09/11/us/trump-vs-biden
- Viteri, Amy; Torres, Andrea (November 6, 2020). "Presidential election: Here is why eastern Miami-Dade is celebrating and western Miami-Dade is not". Local 10 Miami. Retrieved November 8, 2020.
- Daugherty, Alex; Smiley, David; Padró Ocasio, Bianca; Wieder, Ben (November 6, 2020). "How non-Cuban Hispanics in Miami helped deliver Florida for Donald Trump". Miami Herald. Retrieved November 8, 2020.
- "Will flag-waving Latinos win Florida for Trump?". Politico. October 16, 2020. Retrieved November 8, 2020.
- Smiley, David (September 21, 2020). "Why some Cuban-Americans in Florida are supporting Biden over Trump". Tampa Bay Times. Retrieved October 20, 2020.
- "Cuban Americans show strong support for Trump". University of Miami. October 2020. Retrieved November 8, 2020.
- Gomez Licon, Adriana (October 30, 2020). "With salsa, caravans, Cubans make last push to reelect Trump". Associated Press. Retrieved November 8, 2020.
Further reading
- David Weigel; Lauren Tierney (August 30, 2020), "The six political states of Florida", Washingtonpost.com, archived from the original on September 7, 2020
- Summary: State Laws on Presidential Electors (PDF), Washington DC: National Association of Secretaries of State, August 2020,
Florida
- Nick Corasaniti; Stephanie Saul; Patricia Mazzei (September 13, 2020), "Big Voting Decisions in Florida, Wisconsin, Texas: What They Mean for November", New York Times, archived from the original on September 13, 2020,
Both parties are waging legal battles around the country over who gets to vote and how
- Jonathan Martin; Patricia Mazzei (September 14, 2020), "A Tight Trump-Biden Race in Florida: Here's the State of Play", New York Times, archived from the original on September 14, 2020
- David Wasserman (October 6, 2020), "The 10 Bellwether Counties That Show How Trump Is in Serious Trouble", Nytimes.com. (Describes bellwether Pinellas County, Florida)
- Videos
External links
- Florida Elections Commission government website
- "League of Women Voters of Florida". (State affiliate of the U.S. League of Women Voters)
- Florida at Ballotpedia
- Government Documents Round Table of the American Library Association, "Florida", Voting & Elections Toolkits
- "Florida: Election Tools, Deadlines, Dates, Rules, and Links", Vote.org, Oakland, CA