2008 United States presidential election in Kansas
The 2008 United States presidential election in Kansas took place on November 4, 2008, and was part of the 2008 United States presidential election. Voters chose 6 representatives, or electors to the Electoral College, who voted for president and vice president.
| ||||||||||||||||||||||||||
| ||||||||||||||||||||||||||
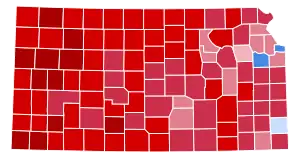 County Results
| ||||||||||||||||||||||||||
| ||||||||||||||||||||||||||
| Elections in Kansas |
|---|
 |
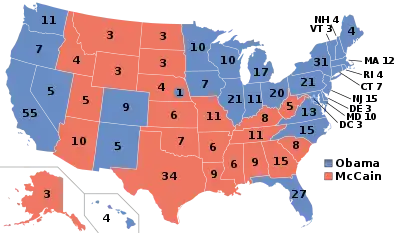
Kansas was won by Republican nominee John McCain by a 14.9% margin of victory. Prior to the election, all 17 news organizations considered this a state McCain would win, or otherwise considered as a safe red state. He won all but three counties and one congressional district in the state.
As of 2020, this is the last time that Crawford County went for the Democratic candidate in a presidential election.
Campaign
Predictions
There were 16 news organizations who made state-by-state predictions of the election. Here are their last predictions before election day:
- D.C. Political Report: Republican[1]
- Cook Political Report: Solid Republican[2]
- Takeaway: Solid McCain[3]
- Electoral-vote.com: Strong Republican[4]
- Washington Post: Solid McCain[5]
- Politico: Solid McCain[6]
- Real Clear Politics: Solid McCain[7]
- FiveThirtyEight.com: Solid McCain[5]
- CQ Politics: Safe Republican[8]
- New York Times: Solid Republican[9]
- CNN: Safe Republican[10]
- NPR: Solid Republican[5]
- MSNBC: Solid McCain[5]
- Fox News: Republican[11]
- Associated Press: Republican[12]
- Rasmussen Reports: Safe Republican[13]
Polling
McCain won every pre-election poll. Since March 16, McCain won each poll with a double-digit margin and at least 47% of the vote.[14]
Fundraising
John McCain raised a total of $1,219,074 in the state. Barack Obama raised $1,548,322.[15]
Analysis
Kansas has always been a Republican stronghold at the presidential level, voting for GOP nominees in all but seven elections since statehood. The last Democratic presidential nominee to carry the Sunflower State was Lyndon B. Johnson in his landslide in 1964. Although the state did receive attention from Barack Obama, whose mother was born in Kansas, it wasn't enough to overcome the deeply planted GOP roots in the state. John McCain carried Kansas by a comfortable 15-percent margin of victory. McCain's margin of victory in Kansas, however, was less than that of George W. Bush who carried the state in 2004 with 62% of the vote over John Kerry's 36.62% showing in the state - a 10-point swing to the Democrats in 2008.
Obama only won three counties - Crawford (home to Pittsburg), Douglas (home to Lawrence), and Wyandotte (home to Kansas City). The first two were home to large college populations, while Wyandotte had a significant African-American population. He did, however, succeed in winning 41% of the state's popular vote. Only two other Democrats have cracked the 40 percent barrier in the state since Johnson's 1964 landslide (Jimmy Carter in 1976 and Michael Dukakis in 1988).
To highlight its status as a reliably red state, former State Treasurer Lynn Jenkins, a Republican, ousted incumbent Democratic U.S. Representative Nancy Boyda to win back Kansas's 2nd Congressional District seat in the U.S. House of Representatives. Jenkins received 50.80% of the vote to Boyda's 45.97%. At the same time, incumbent Republican U.S. Senator Pat Roberts was reelected with 60.06% of the vote over former Democratic U.S. Representative Jim Slattery. Republicans also made gains in the Kansas Senate, picking up one seat.
As of the 2020 presidential election, this is the last election in which Crawford County voted for the Democratic candidate.
Results
| 2008 United States presidential election in Kansas[18] | ||||||
|---|---|---|---|---|---|---|
| Party | Candidate | Running mate | Votes | Percentage | Electoral votes | |
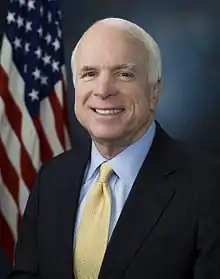
| Republican | John McCain | Sarah Palin | 699,655 | 56.48% | 6 | |
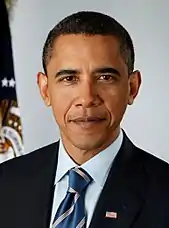
| Democratic | Barack Obama | Joe Biden | 514,765 | 41.55% | 0 | |
| Independent | Ralph Nader | Matt Gonzalez | 10,527 | 0.85% | 0 | |
| Libertarian | Bob Barr | Wayne Allyn Root | 6,706 | 0.54% | 0 | |
| Reform | Chuck Baldwin | Darrell Castle | 4,148 | 0.33% | 0 | |
| Write-ins | Write-ins | 3,037 | 0.24% | 0 | ||
| Green | Cynthia McKinney (write-in) | Rosa Clemente | 35 | 0.00% | 0 | |
| Totals | 1,238,873 | 100.00% | 6 | |||
| Voter turnout (Voting age population) | 60.8% | |||||
Results breakdown
By county
| County | Obama% | Obama# | McCain% | McCain# | Others% | Others# | Total |
|---|---|---|---|---|---|---|---|
| Allen | 37.36% | 2,189 | 60.62% | 3,552 | 2.01% | 118 | 5,859 |
| Anderson | 32.40% | 1,175 | 65.14% | 2,362 | 2.45% | 89 | 3,626 |
| Atchison | 45.07% | 3,241 | 52.72% | 3,791 | 2.21% | 159 | 7,191 |
| Barber | 24.29% | 598 | 74.45% | 1,833 | 1.26% | 31 | 2,462 |
| Barton | 27.38% | 3,027 | 70.56% | 7,802 | 2.06% | 228 | 11,057 |
| Bourbon | 35.30% | 2,394 | 62.53% | 4,240 | 2.17% | 147 | 6,781 |
| Brown | 30.10% | 1,317 | 68.21% | 2,985 | 1.69% | 74 | 4,376 |
| Butler | 32.86% | 9,159 | 65.13% | 18,155 | 2.01% | 559 | 27,873 |
| Chase | 27.67% | 383 | 70.52% | 976 | 1.81% | 25 | 1,384 |
| Chautauqua | 21.65% | 401 | 76.57% | 1,418 | 1.78% | 33 | 1,852 |
| Cherokee | 37.19% | 3,594 | 60.90% | 5,886 | 1.91% | 185 | 9,665 |
| Cheyenne | 21.56% | 323 | 76.64% | 1,148 | 1.80% | 27 | 1,498 |
| Clark | 21.14% | 245 | 77.39% | 897 | 1.47% | 17 | 1,159 |
| Clay | 24.89% | 1,009 | 73.95% | 2,998 | 1.16% | 47 | 4,054 |
| Cloud | 27.70% | 1,233 | 70.12% | 3,121 | 2.18% | 97 | 4,451 |
| Coffey | 26.49% | 1,121 | 72.16% | 3,054 | 1.35% | 57 | 4,232 |
| Comanche | 19.92% | 194 | 78.54% | 765 | 1.54% | 15 | 974 |
| Cowley | 36.35% | 5,012 | 61.59% | 8,492 | 2.05% | 283 | 13,787 |
| Crawford | 49.50% | 7,957 | 48.12% | 7,735 | 2.38% | 383 | 16,075 |
| Decatur | 22.16% | 343 | 76.81% | 1,189 | 1.03% | 16 | 1,548 |
| Dickinson | 27.95% | 2,422 | 70.16% | 6,081 | 1.89% | 164 | 8,667 |
| Doniphan | 31.29% | 1,115 | 66.55% | 2,372 | 2.16% | 77 | 3,564 |
| Douglas | 64.42% | 34,398 | 33.58% | 17,929 | 2.01% | 1,071 | 53,398 |
| Edwards | 24.54% | 333 | 73.32% | 995 | 2.14% | 29 | 1,357 |
| Elk | 25.31% | 363 | 72.66% | 1,042 | 2.02% | 29 | 1,434 |
| Ellis | 32.22% | 4,010 | 65.94% | 8,207 | 1.85% | 230 | 12,447 |
| Ellsworth | 28.97% | 851 | 68.79% | 2,021 | 2.25% | 66 | 2,938 |
| Finney | 31.63% | 3,275 | 66.89% | 6,926 | 1.48% | 153 | 10,354 |
| Ford | 33.74% | 2,991 | 64.64% | 5,730 | 1.61% | 143 | 8,864 |
| Franklin | 37.76% | 4,433 | 60.30% | 7,079 | 1.93% | 227 | 11,739 |
| Geary | 43.13% | 3,491 | 55.50% | 4,492 | 1.37% | 111 | 8,094 |
| Gove | 18.41% | 261 | 80.11% | 1,136 | 1.48% | 21 | 1,418 |
| Graham | 22.84% | 325 | 74.49% | 1,060 | 2.67% | 38 | 1,423 |
| Grant | 23.86% | 635 | 74.97% | 1,995 | 1.16% | 31 | 2,661 |
| Gray | 20.58% | 436 | 77.54% | 1,643 | 1.89% | 40 | 2,119 |
| Greeley | 20.27% | 151 | 79.33% | 591 | 0.40% | 3 | 745 |
| Greenwood | 27.29% | 622 | 71.04% | 1,619 | 1.67% | 38 | 2,279 |
| Hamilton | 21.26% | 233 | 77.01% | 844 | 1.73% | 19 | 1,096 |
| Harper | 26.32% | 736 | 71.49% | 1,999 | 2.18% | 61 | 2,796 |
| Harvey | 40.47% | 6,318 | 57.68% | 9,006 | 1.85% | 289 | 15,613 |
| Haskell | 17.71% | 278 | 81.34% | 1,277 | 0.96% | 15 | 1,570 |
| Hodgeman | 19.25% | 211 | 78.92% | 865 | 1.82% | 20 | 1,096 |
| Jackson | 36.91% | 2,308 | 60.95% | 3,811 | 2.14% | 134 | 6,253 |
| Jefferson | 39.58% | 3,542 | 58.32% | 5,220 | 2.10% | 188 | 8,950 |
| Jewell | 19.76% | 313 | 77.71% | 1,231 | 2.53% | 40 | 1,584 |
| Johnson | 44.84% | 127,091 | 53.85% | 152,627 | 1.31% | 3,714 | 283,432 |
| Kearny | 20.85% | 309 | 78.21% | 1,159 | 0.94% | 14 | 1,482 |
| Kingman | 26.28% | 963 | 71.04% | 2,603 | 2.67% | 98 | 3,664 |
| Kiowa | 17.62% | 200 | 80.35% | 912 | 2.03% | 23 | 1,135 |
| Labette | 42.51% | 3,839 | 55.38% | 5,001 | 2.11% | 191 | 9,031 |
| Lane | 18.79% | 193 | 79.26% | 814 | 1.95% | 20 | 1,027 |
| Leavenworth | 43.33% | 13,255 | 54.89% | 16,791 | 1.78% | 545 | 30,591 |
| Lincoln | 21.88% | 347 | 75.91% | 1,204 | 2.21% | 35 | 1,586 |
| Linn | 30.86% | 1,425 | 66.84% | 3,086 | 2.30% | 106 | 4,617 |
| Logan | 15.63% | 225 | 82.43% | 1,187 | 1.94% | 28 | 1,440 |
| Lyon | 45.88% | 5,924 | 51.88% | 6,698 | 2.24% | 289 | 12,911 |
| Marion | 29.72% | 1,801 | 68.64% | 4,159 | 1.63% | 99 | 6,059 |
| Marshall | 35.42% | 1,784 | 62.69% | 3,157 | 1.89% | 95 | 5,036 |
| McPherson | 31.51% | 4,218 | 66.77% | 8,937 | 1.72% | 230 | 13,385 |
| Meade | 18.49% | 357 | 79.75% | 1,540 | 1.76% | 34 | 1,931 |
| Miami | 37.34% | 5,742 | 61.01% | 9,382 | 1.65% | 253 | 15,377 |
| Mitchell | 21.89% | 701 | 76.18% | 2,440 | 1.94% | 62 | 3,203 |
| Montgomery | 31.19% | 4,338 | 66.94% | 9,309 | 1.87% | 260 | 13,907 |
| Morris | 31.93% | 907 | 66.00% | 1,875 | 2.08% | 59 | 2,841 |
| Morton | 16.33% | 229 | 82.24% | 1,153 | 1.43% | 20 | 1,402 |
| Nemaha | 26.72% | 1,432 | 71.23% | 3,817 | 2.05% | 110 | 5,359 |
| Neosho | 35.64% | 2,563 | 62.19% | 4,473 | 2.17% | 156 | 7,192 |
| Ness | 18.95% | 289 | 79.15% | 1,207 | 1.90% | 29 | 1,525 |
| Norton | 20.58% | 497 | 77.76% | 1,878 | 1.66% | 40 | 2,415 |
| Osage | 33.59% | 2,534 | 63.89% | 4,820 | 2.52% | 190 | 7,544 |
| Osborne | 20.88% | 403 | 77.20% | 1,490 | 1.92% | 37 | 1,930 |
| Ottawa | 22.81% | 704 | 75.28% | 2,323 | 1.91% | 59 | 3,086 |
| Pawnee | 30.64% | 882 | 67.59% | 1,946 | 1.77% | 51 | 2,879 |
| Phillips | 19.69% | 525 | 78.93% | 2,105 | 1.39% | 37 | 2,667 |
| Pottawatomie | 26.42% | 2,599 | 70.44% | 6,929 | 3.14% | 309 | 9,837 |
| Pratt | 30.88% | 1,294 | 67.35% | 2,822 | 1.77% | 74 | 4,190 |
| Rawlins | 17.62% | 273 | 80.50% | 1,247 | 1.87% | 29 | 1,549 |
| Reno | 37.40% | 9,916 | 60.77% | 16,112 | 1.83% | 484 | 26,512 |
| Republic | 23.96% | 640 | 74.05% | 1,978 | 1.98% | 53 | 2,671 |
| Rice | 28.92% | 1,163 | 69.14% | 2,780 | 1.94% | 78 | 4,021 |
| Riley | 45.64% | 10,495 | 52.66% | 12,111 | 1.70% | 391 | 22,997 |
| Rooks | 18.08% | 468 | 79.91% | 2,068 | 2.01% | 52 | 2,588 |
| Rush | 28.30% | 504 | 68.78% | 1,225 | 2.92% | 52 | 1,781 |
| Russell | 22.35% | 736 | 76.19% | 2,509 | 1.46% | 48 | 3,293 |
| Saline | 35.92% | 8,186 | 62.16% | 14,165 | 1.92% | 437 | 22,788 |
| Scott | 14.73% | 321 | 83.66% | 1,823 | 1.61% | 35 | 2,179 |
| Sedgwick | 42.72% | 82,337 | 55.44% | 106,849 | 1.83% | 3,530 | 192,716 |
| Seward | 27.98% | 1,493 | 71.05% | 3,791 | 0.97% | 52 | 5,336 |
| Shawnee | 48.99% | 41,235 | 49.27% | 41,476 | 1.74% | 1,466 | 84,177 |
| Sheridan | 18.46% | 254 | 80.52% | 1,108 | 1.02% | 14 | 1,376 |
| Sherman | 25.44% | 688 | 72.45% | 1,959 | 2.11% | 57 | 2,704 |
| Smith | 20.24% | 446 | 77.99% | 1,719 | 1.77% | 39 | 2,204 |
| Stafford | 26.13% | 542 | 72.08% | 1,495 | 1.78% | 37 | 2,074 |
| Stanton | 22.73% | 188 | 75.94% | 628 | 1.33% | 11 | 827 |
| Stevens | 13.31% | 283 | 85.33% | 1,815 | 1.36% | 29 | 2,127 |
| Sumner | 32.44% | 3,353 | 65.17% | 6,737 | 2.39% | 247 | 10,337 |
| Thomas | 21.43% | 787 | 77.24% | 2,837 | 1.33% | 49 | 3,673 |
| Trego | 25.13% | 420 | 73.31% | 1,225 | 1.56% | 26 | 1,671 |
| Wabaunsee | 29.42% | 1,036 | 68.02% | 2,395 | 2.56% | 90 | 3,521 |
| Wallace | 11.94% | 96 | 85.82% | 690 | 2.24% | 18 | 804 |
| Washington | 22.11% | 659 | 75.44% | 2,248 | 2.45% | 73 | 2,980 |
| Wichita | 16.00% | 163 | 82.43% | 840 | 1.57% | 16 | 1,019 |
| Wilson | 28.39% | 1,170 | 69.16% | 2,850 | 2.45% | 101 | 4,121 |
| Woodson | 32.02% | 512 | 65.98% | 1,055 | 2.00% | 32 | 1,599 |
| Wyandotte | 69.73% | 39,865 | 28.87% | 16,506 | 1.40% | 798 | 57,169 |
By congressional district
John McCain carried three of the state’s four congressional districts.
| District | McCain | Obama | Representative |
|---|---|---|---|
| 1st | 68.60% | 29.61% | Jerry Moran |
| 2nd | 54.87% | 43.20% | Nancy Boyda (110th Congress) |
| Lynn Jenkins (111th Congress) | |||
| 3rd | 48.01% | 50.59% | Dennis Moore |
| 4th | 58.38% | 39.72% | Todd Tiahrt |
Electors
Technically the voters of Kansas cast their ballots for electors: representatives to the Electoral College. Kansas is allocated 6 electors because it has 4 congressional districts and 2 senators. All candidates who appear on the ballot or qualify to receive write-in votes must submit a list of 6 electors, who pledge to vote for their candidate and his or her running mate. Whoever wins the majority of votes in the state is awarded all 6 electoral votes. Their chosen electors then vote for president and vice president. Although electors are pledged to their candidate and running mate, they are not obligated to vote for them.[19] An elector who votes for someone other than his or her candidate is known as a faithless elector.
The electors of each state and the District of Columbia met on December 15, 2008, to cast their votes for president and vice president. The Electoral College itself never meets as one body. Instead the electors from each state and the District of Columbia met in their respective capitols.
The following were the members of the Electoral College from the state. All 6 were pledged to John McCain and Sarah Palin:[20]
- Tom Arpke
- Jeff Colyer
- David Kensinger
- Kris Kobach
- Mike Pompeo
- Helen Van Etten
References
- "D.C.'s Political Report: The complete source for campaign summaries". Archived from the original on 2009-01-01. Retrieved 2009-12-20.
- Presidential | The Cook Political Report Archived May 5, 2015, at the Wayback Machine
- Adnaan (2008-09-20). "Track the Electoral College vote predictions". The Takeaway. Archived from the original on April 22, 2009. Retrieved 2009-11-14.
- Electoral-vote.com: President, Senate, House Updated Daily
- Based on Takeaway
- POLITICO's 2008 Swing State Map - POLITICO.com
- RealClearPolitics - Electoral Map
- CQ Politics | CQ Presidential Election Maps, 2008 Archived June 14, 2009, at the Wayback Machine
- "Electoral College Map". The New York Times. Retrieved May 26, 2010.
- "October – 2008 – CNN Political Ticker - CNN.com Blogs". CNN. Retrieved May 26, 2010.
- "Winning the Electoral College". Fox News. April 27, 2010.
- roadto270
- Election 2008: Electoral College Update - Rasmussen Reports™
- Election 2008 Polls - Dave Leip's Atlas of U.S. Presidential Elections
- "Presidential Campaign Finance". Archived from the original on 2009-03-24. Retrieved 2009-08-20.
- "Map: Campaign Ad Spending - Election Center 2008 from CNN.com". CNN. Retrieved May 26, 2010.
- "Map: Campaign Candidate Visits - Election Center 2008 from CNN.com". CNN. Retrieved May 26, 2010.
- "Atlas of U.S. Presidential Elections". Retrieved 2013-01-13.
- "Electoral College". California Secretary of State. Archived from the original on October 30, 2008. Retrieved 2008-11-01.
- Kansas Secretary of State - 2008 Presidential Electors