Clinton County, Kentucky
Clinton County is a county located in the U.S. state of Kentucky. As of the 2010 census, the population was 10,272.[1] Its county seat is Albany.[2] The county was formed in 1835 and named for DeWitt Clinton, the seventh Governor of New York.[3] It is a prohibition or dry county.
Clinton County | |
|---|---|
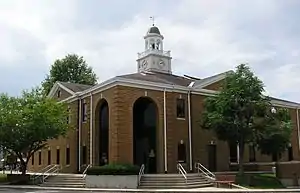 Clinton County courthouse in Albany | |
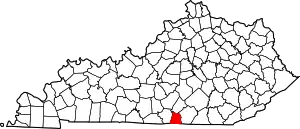 Location within the U.S. state of Kentucky | |
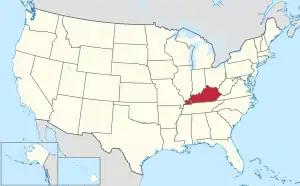 Kentucky's location within the U.S. | |
| Coordinates: 36°43′N 85°08′W | |
| Country | |
| State | |
| Founded | February 20, 1835 |
| Named for | DeWitt Clinton |
| Seat | Albany |
| Largest city | Albany |
| Area | |
| • Total | 205 sq mi (530 km2) |
| • Land | 197 sq mi (510 km2) |
| • Water | 8.2 sq mi (21 km2) 4.0%% |
| Population | |
| • Estimate (2018) | 10,206 |
| • Density | 52/sq mi (20/km2) |
| Time zone | UTC−6 (Central) |
| • Summer (DST) | UTC−5 (CDT) |
| Congressional district | 1st |
| Website | clintoncounty |
History
Clinton County was formed on February 20, 1835 from portions of Cumberland and Wayne counties. It was named for DeWitt Clinton, governor of New York and driving force behind the Erie Canal.[4]
Courthouse fires in 1864 (Civil War guerrillas) and 1980 resulted in the destruction of county records, but in the latter case, local volunteers' assistance successfully preserved almost all records.[5]
Geography
According to the U.S. Census Bureau, the county has a total area of 205 square miles (530 km2), of which 197 square miles (510 km2) is land and 8.2 square miles (21 km2) (4.0%) is water.[6]
Adjacent counties
- Russell County (north)
- Wayne County (east/EST border)
- Pickett County, Tennessee (south)
- Clay County, Tennessee (southwest)
- Cumberland County (west)
Demographics
| Historical population | |||
|---|---|---|---|
| Census | Pop. | %± | |
| 1840 | 3,863 | — | |
| 1850 | 4,889 | 26.6% | |
| 1860 | 5,781 | 18.2% | |
| 1870 | 6,497 | 12.4% | |
| 1880 | 7,212 | 11.0% | |
| 1890 | 7,047 | −2.3% | |
| 1900 | 7,871 | 11.7% | |
| 1910 | 8,153 | 3.6% | |
| 1920 | 8,589 | 5.3% | |
| 1930 | 9,004 | 4.8% | |
| 1940 | 10,279 | 14.2% | |
| 1950 | 10,650 | 3.6% | |
| 1960 | 8,886 | −16.6% | |
| 1970 | 8,174 | −8.0% | |
| 1980 | 9,321 | 14.0% | |
| 1990 | 9,135 | −2.0% | |
| 2000 | 9,634 | 5.5% | |
| 2010 | 10,272 | 6.6% | |
| 2018 (est.) | 10,206 | [7] | −0.6% |
| U.S. Decennial Census[8] 1790-1960[9] 1900-1990[10] 1990-2000[11] 2010-2013[1] | |||
As of the census[12] of 2000, there were 9,634 people, 4,086 households, and 2,811 families residing in the county. The population density was 49 per square mile (19/km2). There were 4,888 housing units at an average density of 25 per square mile (9.7/km2). The racial makeup of the county was 99.09% White, 0.10% Black or African American, 0.25% Native American, 0.04% Asian, 0.11% Pacific Islander, 0.08% from other races, and 0.32% from two or more races. 1.22% of the population were Hispanic or Latino of any race.
There were 4,086 households, out of which 29.80% had children under the age of 18 living with them, 55.50% were married couples living together, 9.70% had a female householder with no husband present, and 31.20% were non-families. 28.40% of all households were made up of individuals, and 12.80% had someone living alone who was 65 years of age or older. The average household size was 2.34 and the average family size was 2.85.
In the county, the population was spread out, with 22.70% under the age of 18, 8.60% from 18 to 24, 27.70% from 25 to 44, 26.00% from 45 to 64, and 15.00% who were 65 years of age or older. The median age was 39 years. For every 100 females there were 92.90 males. For every 100 females age 18 and over, there were 91.50 males.
The median income for a household in the county was $19,563, and the median income for a family was $25,919. Males had a median income of $21,193 versus $16,194 for females. The per capita income for the county was $13,286. About 20.20% of families and 25.80% of the population were below the poverty line, including 31.80% of those under age 18 and 29.90% of those age 65 or over.
Communities
- Aaron
- Abstons Corner
- Albany (county seat)
- Alpha
- Browns Crossroads
- Bug
- Cannons Mill
- Cartwright
- Cedar Knob
- Churntop
- Cumberland City
- Decide
- Dicken
- Five Springs
- Highway
- Hobart
- Hogback
- Huntersville
- Ida
- Jones Mill
- Lettered Oak
- Marlow
- Narvel
- Nora
- Ootens Store
- Pikeview
- Rolan
- Savage
- Seventy Six
- Shipley
- Snow
- Sparta
- Static‡
- Upchurch
- Wago
- Watauga
- Willis Creek
- Wolf River Dock
Politics
In presidential elections Clinton County has been overwhelmingly Republican ever since Reconstruction ended. Its Republican sympathies are rooted in the fact that, relative to population, Clinton County provided more soldiers for the Union Army than any free state,[13] and saw a proportion of its population volunteer for Union service only exceeded by the equally Republican Owsley County.[14]
The last Democrat to carry Clinton County was Horatio Seymour in 1868 – when the state was largely controlled by former Confederates – and the last Democrat to pass so much as thirty percent of the county's vote was Grover Cleveland in 1888. Nor has any Republican in this time span – even William Howard Taft during the divided 1912 election – fallen short of sixty percent. Jackson County to the northeast is the only other county in the United States that has seen no Democrat reach thirty percent since the beginning of the 1890s, and apart from these two only Hooker County, Nebraska has seen no Democrat reach thirty percent since 1940.
| Year | Republican | Democratic | Third parties |
|---|---|---|---|
| 2016 | 85.4% 3,809 | 12.3% 547 | 2.4% 106 |
| 2012 | 81.2% 3,569 | 17.1% 752 | 1.6% 72 |
| 2008 | 80.7% 3,366 | 18.2% 761 | 1.1% 45 |
| 2004 | 77.4% 3,369 | 21.9% 952 | 0.7% 31 |
| 2000 | 74.9% 3,224 | 24.0% 1,032 | 1.1% 49 |
| 1996 | 63.4% 2,521 | 27.0% 1,072 | 9.6% 383 |
| 1992 | 63.8% 2,830 | 28.0% 1,241 | 8.2% 365 |
| 1988 | 77.8% 3,248 | 21.5% 899 | 0.7% 28 |
| 1984 | 80.0% 3,459 | 19.4% 838 | 0.6% 25 |
| 1980 | 77.1% 3,539 | 21.8% 1,000 | 1.1% 51 |
| 1976 | 69.5% 2,354 | 29.1% 987 | 1.4% 48 |
| 1972 | 79.6% 2,632 | 19.9% 659 | 0.5% 16 |
| 1968 | 75.1% 2,572 | 16.6% 568 | 8.3% 285 |
| 1964 | 69.8% 2,351 | 29.5% 994 | 0.7% 24 |
| 1960 | 84.1% 3,524 | 15.9% 666 | |
| 1956 | 81.9% 3,396 | 18.0% 747 | 0.1% 4 |
| 1952 | 80.5% 2,856 | 19.1% 678 | 0.3% 12 |
| 1948 | 74.2% 2,295 | 22.9% 709 | 2.9% 88 |
| 1944 | 82.2% 2,618 | 17.7% 564 | 0.1% 3 |
| 1940 | 77.3% 2,573 | 22.7% 755 | 0.0% 0 |
| 1936 | 75.4% 2,147 | 24.6% 701 | 0.0% 0 |
| 1932 | 72.7% 2,422 | 27.3% 908 | 0.0% 0 |
| 1928 | 88.8% 2,580 | 11.2% 325 | 0.0% 0 |
| 1924 | 78.7% 2,069 | 20.7% 543 | 0.7% 17 |
| 1920 | 84.2% 2,356 | 15.4% 431 | 0.4% 11 |
| 1916 | 76.2% 1,260 | 22.9% 379 | 0.9% 14 |
| 1912 | 65.3% 828 | 24.4% 310 | 10.3% 131 |
See also
References
- "State & County QuickFacts". United States Census Bureau. Archived from the original on July 8, 2011. Retrieved March 6, 2014.
- "Find a County". National Association of Counties. Archived from the original on 2011-05-31. Retrieved 2011-06-07.
- "Clinton County". The Kentucky Encyclopedia. 2000. Retrieved August 21, 2014.
- The Register of the Kentucky State Historical Society, Volume 1. Kentucky State Historical Society. 1903. pp. 34.
- Hogan, Roseann Reinemuth (1992). Kentucky Ancestry: A Guide to Genealogical and Historical Research. Ancestry Publishing. p. 219. ISBN 9780916489496. Retrieved July 26, 2013.
- "2010 Census Gazetteer Files". United States Census Bureau. August 22, 2012. Archived from the original on August 12, 2014. Retrieved August 13, 2014.
- "Population and Housing Unit Estimates". Retrieved July 26, 2019.
- "U.S. Decennial Census". United States Census Bureau. Retrieved August 13, 2014.
- "Historical Census Browser". University of Virginia Library. Retrieved August 13, 2014.
- "Population of Counties by Decennial Census: 1900 to 1990". United States Census Bureau. Retrieved August 13, 2014.
- "Census 2000 PHC-T-4. Ranking Tables for Counties: 1990 and 2000" (PDF). United States Census Bureau. Retrieved August 13, 2014.
- "U.S. Census website". United States Census Bureau. Retrieved January 31, 2008.
- Marshall, Anne E.; Creating a Confederate Kentucky: The Lost Cause and Civil War Memory in a Border State, pp. 114-115 ISBN 1469609835
- Copeland, James E.; ‘Where Were the Kentucky Unionists and Secessionists’; The Register of the Kentucky Historical Society, volume 71, no. 4 (October 1973), pp. 344–363
- Leip, David. "Dave Leip's Atlas of U.S. Presidential Elections". USElectionAtlas.org. Retrieved July 29, 2017.
Municipalities and communities of Clinton County, Kentucky, United States | ||
|---|---|---|
| City | Location of Clinton County, Kentucky | |
| Unincorporated communities | ||
| Footnotes | ‡This populated place also has portions in an adjacent county or counties | |
| ||
| Authority control |
|---|