Magoffin County, Kentucky
Magoffin County is a county located in the U.S. state of Kentucky. As of the 2010 census, the population was 13,333.[1] Its county seat is Salyersville.[2] The county was formed in 1860 from adjacent portions of Floyd, Johnson, and Morgan Counties. It was named for Beriah Magoffin who was Governor of Kentucky (1859–62).[3][4]
Magoffin County | |
|---|---|
 Magoffin County justice center in Salyersville | |
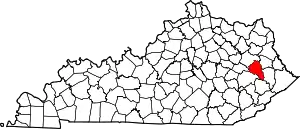 Location within the U.S. state of Kentucky | |
 Kentucky's location within the U.S. | |
| Coordinates: 37°42′N 83°04′W | |
| Country | |
| State | |
| Founded | 1860 |
| Named for | Beriah Magoffin |
| Seat | Salyersville |
| Largest city | Salyersville |
| Area | |
| • Total | 309 sq mi (800 km2) |
| • Land | 308 sq mi (800 km2) |
| • Water | 0.7 sq mi (2 km2) 0.2%% |
| Population | |
| • Estimate (2018) | 12,362 |
| • Density | 43/sq mi (17/km2) |
| Time zone | UTC−5 (Eastern) |
| • Summer (DST) | UTC−4 (EDT) |
| Congressional district | 5th |
| Website | magoffincounty |
History
The area now encompassed by Kentucky's Magoffin County was first bounded in 1772, when all of what is now the state of Kentucky was in the frontier county of Fincastle County, Virginia. Fincastle was divided in 1776, with the western portion named Kentucky County, Virginia.[5] In 1780, the Virginia legislature set aside all land in Kentucky County for soldiers who had served in the Revolutionary War. In 1780, Kentucky County was divided into 3 counties, Jefferson, Fayette, and Lincoln. Fayette County was divided in 1785, with part becoming Bourbon County.[6][7] In 1792, the lower part of Bourbon County was partitioned off to form Clark County.[8] The area was further divided in 1796 to form Montgomery County, with Fleming County being partitioned from the area in 1798. In 1800, Floyd County was created from portions of Fleming, Mason, and Montgomery Counties. In 1843, Johnson County was carved out of the previous Bath County area,[9] which was created in 1811 from Montgomery County, and which lost a portion of its territory in 1843 for the creation of Johnson County.
In 1860, the Kentucky Legislature partitioned parts of Johnson, Floyd, and Morgan Counties, to create Magoffin County. Its boundaries have remained unchanged since that time.
Geography
According to the U.S. Census Bureau, the county has a total area of 309 square miles (800 km2), of which 308 square miles (800 km2) is land and 0.7 square miles (1.8 km2) (0.2%) is water.[10] It is watered by Licking River.[11]
Adjacent counties
- Morgan County (northwest)
- Johnson County (northeast)
- Floyd County (southeast)
- Knott County (south)
- Breathitt County (southwest)
- Wolfe County (west)
Demographics
| Historical population | |||
|---|---|---|---|
| Census | Pop. | %± | |
| 1870 | 4,684 | — | |
| 1880 | 6,944 | 48.2% | |
| 1890 | 9,196 | 32.4% | |
| 1900 | 12,006 | 30.6% | |
| 1910 | 13,654 | 13.7% | |
| 1920 | 13,859 | 1.5% | |
| 1930 | 15,719 | 13.4% | |
| 1940 | 17,490 | 11.3% | |
| 1950 | 13,839 | −20.9% | |
| 1960 | 11,156 | −19.4% | |
| 1970 | 10,443 | −6.4% | |
| 1980 | 13,515 | 29.4% | |
| 1990 | 13,077 | −3.2% | |
| 2000 | 13,332 | 1.9% | |
| 2010 | 13,333 | 0.0% | |
| 2018 (est.) | 12,362 | [12] | −7.3% |
| U.S. Decennial Census[13] 1790-1960[14] 1900-1990[15] 1990-2000[16] 2010-2013[1] | |||
As of the 2010 United States Census, there were 13,333 people living in the county. 98.6% were White, 0.3% Native American, 0.1% Black or African American, 0.1% Asian, 0.2% of some other race and 0.7% of two or more races. 0.7% were Hispanic or Latino (of any race).
As of the census[17] of 2000, there were 13,332 people, 5,024 households, and 3,858 families living in the county. The population density was 43 per square mile (17/km2). There were 5,447 housing units at an average density of 18 per square mile (6.9/km2). The racial makeup of the county was 99.29% White, 0.15% Black or African American, 0.20% Native American, 0.08% Asian, 0.02% from other races, and 0.27% from two or more races. 0.42% of the population were Hispanic or Latino of any race. There is a significant Melungeon or mixed race group of Carmel Indians in Magoffin County. In a 2007 study by the U.S. Census Bureau, Magoffin County, along with Mitchell County in Iowa, was cited as the U.S. county having the largest percentage of individuals in the demographic category of "Non-Hispanic white alone."[18]
There were 5,024 households, out of which 37.50% had children under the age of 18 living with them, 61.90% were married couples living together, 11.20% had a female householder with no husband present, and 23.20% were non-families. 21.40% of all households were made up of individuals, and 8.20% had someone living alone who was 65 years of age or older. The average household size was 2.62 and the average family size was 3.04.
In the county, the population was spread out, with 26.80% under the age of 18, 10.10% from 18 to 24, 30.20% from 25 to 44, 22.40% from 45 to 64, and 10.60% who were 65 years of age or older. The median age was 34 years. For every 100 females there were 97.20 males. For every 100 females age 18 and over, there were 94.40 males.
The median income for a household in the county was $19,421, and the median income for a family was $24,031. Males had a median income of $27,745 versus $18,354 for females. The per capita income for the county was $10,685. About 31.20% of families and 36.60% of the population were below the poverty line, including 45.90% of those under age 18 and 29.10% of those age 65 or over.
Politics
Between 1932 and 2004, Magoffin County generally voted Democratic in presidential elections, however it has voted Republican since then. It voted for Democrat Andy Beshear for Governor in the 2019 election, but Republican for all other statewide offices.
| Year | Republican | Democratic | Third parties |
|---|---|---|---|
| 2020 | 76.6% 4,174 | 22.3% 1,213 | 1.1% 59 |
| 2016 | 74.8% 3,824 | 22.9% 1,172 | 2.4% 120 |
| 2012 | 69.1% 3,391 | 29.2% 1,433 | 1.7% 82 |
| 2008 | 52.3% 2,434 | 45.3% 2,105 | 2.4% 112 |
| 2004 | 49.6% 2,836 | 49.7% 2,843 | 0.7% 39 |
| 2000 | 51.1% 2,785 | 47.7% 2,603 | 1.2% 65 |
| 1996 | 35.5% 1,434 | 55.6% 2,249 | 9.0% 362 |
| 1992 | 34.9% 1,992 | 57.1% 3,261 | 8.0% 458 |
| 1988 | 42.5% 2,158 | 57.0% 2,895 | 0.5% 27 |
| 1984 | 44.2% 2,343 | 55.5% 2,942 | 0.3% 13 |
| 1980 | 42.8% 2,265 | 56.4% 2,986 | 0.9% 46 |
| 1976 | 42.1% 1,793 | 57.5% 2,451 | 0.5% 19 |
| 1972 | 52.4% 2,243 | 47.3% 2,024 | 0.3% 14 |
| 1968 | 46.7% 1,927 | 47.7% 1,967 | 5.6% 229 |
| 1964 | 64.8% 2,498 | 34.4% 1,327 | 0.7% 28 |
| 1960 | 52.5% 2,736 | 47.5% 2,471 | 0.0% 0 |
| 1956 | 52.0% 2,343 | 48.0% 2,162 | 0.1% 4 |
| 1952 | 48.2% 2,093 | 51.7% 2,243 | 0.1% 6 |
| 1948 | 45.5% 1,882 | 54.5% 2,253 | 0.0% 0 |
| 1944 | 51.3% 2,135 | 48.8% 2,031 | 0.0% 0 |
| 1940 | 48.7% 2,668 | 51.3% 2,812 | 0.0% 1 |
| 1936 | 50.2% 2,577 | 49.7% 2,554 | 0.1% 6 |
| 1932 | 49.3% 2,661 | 50.4% 2,721 | 0.2% 13 |
| 1928 | 60.9% 2,816 | 39.1% 1,806 | 0.0% 0 |
| 1924 | 55.3% 2,196 | 44.2% 1,757 | 0.6% 22 |
| 1920 | 63.2% 2,347 | 36.4% 1,352 | 0.4% 16 |
| 1916 | 51.2% 1,535 | 47.8% 1,433 | 0.9% 28 |
| 1912 | 43.5% 1,004 | 38.6% 891 | 17.9% 413 |
Economy
The last active coal mine in Magoffin County closed in 2015. Major employers now include several coal truck businesses.[20]
Communities
Notable people
- Jimmy Flynt, Co-Founder of Hustler magazine
- Larry Flynt, publisher of Hustler magazine
See also
References
- "State & County QuickFacts". United States Census Bureau. Archived from the original on June 7, 2011. Retrieved March 6, 2014.
- "Find a County". National Association of Counties. Retrieved June 7, 2011.
- E., Kleber, John; Kentucky, University Press of; Policy, Institute for Regional Analysis and Public; Library, Camden-Carroll; University, Morehead State (January 1, 2000). "The Kentucky Encyclopedia".
- The Register of the Kentucky State Historical Society, Vol. 1. Kentucky State Historical Society. 1903. p. 36.
- "About Kentucky". Ezilon Search. Archived from the original on November 10, 2006. Retrieved November 29, 2006.
- The Register of the Kentucky State Historical Society, Vol. 1. Kentucky State Historical Society. 1903. p. 35.
- Gannett, Henry (1905). The Origin of Certain Place Names in the United States. Govt. Print. Off. p. 124.
- "Clark County". The Kentucky Encyclopedia. 2000. Archived from the original on August 22, 2014. Retrieved August 21, 2014.
- The Register of the Kentucky State Historical Society, Vol. 1. Kentucky State Historical Society. 1903. p. 35.
- "2010 Census Gazetteer Files". United States Census Bureau. August 22, 2012. Archived from the original on August 12, 2014. Retrieved August 17, 2014.
- Ripley, George; Dana, Charles A., eds. (1879). . The American Cyclopædia.
- "Population and Housing Unit Estimates". Retrieved July 29, 2019.
- "U.S. Decennial Census". United States Census Bureau. Retrieved August 17, 2014.
- "Historical Census Browser". University of Virginia Library. Retrieved August 17, 2014.
- "Population of Counties by Decennial Census: 1900 to 1990". United States Census Bureau. Retrieved August 17, 2014.
- "Census 2000 PHC-T-4. Ranking Tables for Counties: 1990 and 2000" (PDF). United States Census Bureau. Retrieved August 17, 2014.
- "U.S. Census website". United States Census Bureau. Retrieved January 31, 2008.
- "Minority Population is Booming Nationally and in Utah - Science News". redOrbit. August 9, 2007. Retrieved March 6, 2012.
- Leip, David. "Dave Leip's Atlas of U.S. Presidential Elections". uselectionatlas.org. Retrieved July 4, 2018.
- "Top 10 of 2015 - Salyersville Independent".
External links
- Magoffin County Schools
- The Magoffin County Historical Society
- Sandy Valley Transportation Services, Inc.
- Magoffin History & Ancestry
Municipalities and communities of Magoffin County, Kentucky, United States | ||
|---|---|---|
| City | Location of Magoffin County, Kentucky | |
| Unincorporated communities | ||
| ||
| Authority control |
|---|