LaRue County, Kentucky
LaRue County is a county in the central region of the U.S. state of Kentucky, outside the Bluegrass Region and larger population centers. As of the 2010 United States Census, its population was 14,193.[1] Its county seat is Hodgenville,[2] which is best known as the birthplace of United States President Abraham Lincoln. The county was formed on March 4, 1843, from the southeast portion of Hardin County. It was named for John P. LaRue, an early settler.[3][4]
LaRue County | |
|---|---|
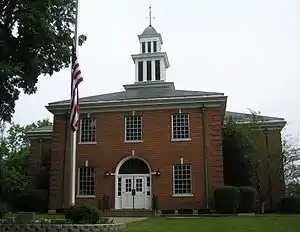 LaRue County courthouse in Hodgenville | |
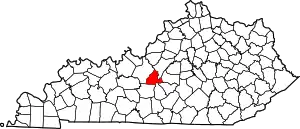 Location within the U.S. state of Kentucky | |
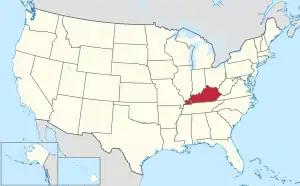 Kentucky's location within the U.S. | |
| Coordinates: 37°34′36″N 85°41′12″W | |
| Country | |
| State | |
| Founded | 4 March 1843 (created) |
| Named for | John LaRue |
| Seat | Hodgenville |
| Largest city | Hodgenville |
| Area | |
| • Total | 264 sq mi (680 km2) |
| • Land | 262 sq mi (680 km2) |
| • Water | 2.1 sq mi (5 km2) 0.8%% |
| Population | |
| • Estimate (2018) | 14,307 |
| • Density | 54.6/sq mi (21.1/km2) |
| Congressional district | 2nd |
| Website | www |
LaRue County is included in the Elizabethtown-Fort Knox, KY Metropolitan Statistical Area, which is also included in the Louisville/Jefferson County-Elizabethtown-Bardstown, KY-IN Combined Statistical Area. It is a prohibition or dry county.
Geography
The low rolling hills of LaRue County have been largely cleared and devoted to agriculture or urban development, with only the drainages of the eastern portions still wooded.[5] The highest point (1100 feet/335 meters ASL) is a small hill near its border with Taylor County.[6]
According to the US Census Bureau, the county has a total area of 264 square miles (680 km2), of which 262 square miles (680 km2) is land and 2.1 square miles (5.4 km2) (0.8%) is water.[7]
Adjacent counties
- Nelson County − northeast
- Marion County − east
- Taylor County − southeast
- Green County − south/CST Border
- Hart County − southwest/CST Border
- Hardin County − northwest
National protected area
Demographics
| Historical population | |||
|---|---|---|---|
| Census | Pop. | %± | |
| 1850 | 5,859 | — | |
| 1860 | 6,891 | 17.6% | |
| 1870 | 8,235 | 19.5% | |
| 1880 | 9,793 | 18.9% | |
| 1890 | 9,433 | −3.7% | |
| 1900 | 10,764 | 14.1% | |
| 1910 | 10,701 | −0.6% | |
| 1920 | 10,004 | −6.5% | |
| 1930 | 9,093 | −9.1% | |
| 1940 | 9,622 | 5.8% | |
| 1950 | 9,956 | 3.5% | |
| 1960 | 10,346 | 3.9% | |
| 1970 | 10,672 | 3.2% | |
| 1980 | 11,922 | 11.7% | |
| 1990 | 11,679 | −2.0% | |
| 2000 | 13,373 | 14.5% | |
| 2010 | 14,193 | 6.1% | |
| 2018 (est.) | 14,307 | [8] | 0.8% |
| US Decennial Census[9] 1790-1960[10] 1900-1990[11] 1990-2000[12] 2010-2013[1] | |||
2000 census
As of the 2000 United States Census,[13] there were 13,373 people, 5,275 households, and 3,866 families in the county. The population density was 51 people per square mile (20/km²). There were 5,860 housing units at an average density of 22 per square mile (9/km²). The racial makeup of the county was 94.65% White, 3.54% Black or African American, 0.19% Native American, 0.16% Asian, 0.03% Pacific Islander, 0.34% from other races, and 1.10% from two or more races. 1.05% of the population were Hispanic or Latino of any race.
There were 5,275 households, out of which 32.50% had children under the age of 18 living with them, 59.20% were married couples living together, 10.50% had a female householder with no husband present, and 26.70% were non-families. 23.70% of all households were made up of individuals, and 11.20% had someone living alone who was 65 years of age or older. The average household size was 2.49 and the average family size was 2.94.
The county population contained 25.00% under the age of 18, 7.70% from 18 to 24, 28.20% from 25 to 44, 24.00% from 45 to 64, and 15.00% who were 65 years of age or older. The median age was 38 years. For every 100 females, there were 95.40 males. For every 100 females age 18 and over, there were 92.90 males.
The median income for a household in the county was $32,056, and the median income for a family was $37,786. Males had a median income of $30,907 versus $20,091 for females. The per capita income for the county was $15,865. 15.40% of the population and 12.60% of families were below the poverty line. Out of the total people living in poverty, 18.90% are under the age of 18 and 16.40% are 65 or older.
Communities
Cities
- Hodgenville (county seat)
- Upton – (partly in Hardin County)
Unincorporated communities
- Athertonville
- Buffalo
- Ginseng
- Gleanings[14]
- Lyons
- Magnolia
- Malt
- Mount Sherman
- Tanner
- Tonieville
- White City
Churches
- Hodgenville Pentecostal Church (HPC)
- Hodgenville United Methodist Church
- Our Lady of Mercy Catholic Church
- LaRue Baptist Church, an Independent Baptist church
- Victory Baptist Church
- First Baptist Church of Hodgenville (relocated from Downtown Hodgenville to near Lincoln Parkway on the edge of the city limits.)
- First Baptist Church on Lincoln Blvd, Hodgenville
- Buffalo Baptist Church, Buffalo
- Mt. Tabor Baptist Church
- Union Christian Church
- Magnolia Baptist Church
- Roanoke House of Prayer
- Lane Lincoln Baptist Church
- Athertonville Baptist Church
- Oakhill Baptist Church
- South Fork Baptist Church
- Wesley Meadows United Methodist Church
- Levelwoods United Methodist Church
- Parkway Baptist Church
- Steadfast Baptist Church
Lincoln Days
The county sponsors the annual Lincoln Days celebration on the first full weekend of October, Friday through Sunday. Highlights include the Lincoln Look-A-Like contests, rail-splitting competitions, a parade, shopping booths and concerts by local talent (mostly country, bluegrass and Southern gospel).
Politics
LaRue County has leaned heavily Republican in presidential elections since the turn of the century. Three-quarters of the county's overall vote went to Donald Trump in the 2016 election.
| Year | Republican | Democratic | Third parties |
|---|---|---|---|
| 2016 | 75.4% 4,799 | 20.1% 1,278 | 4.6% 290 |
| 2012 | 67.9% 3,911 | 30.1% 1,733 | 2.1% 120 |
| 2008 | 67.2% 4,153 | 31.0% 1,913 | 1.8% 112 |
| 2004 | 68.9% 4,111 | 30.6% 1,823 | 0.6% 34 |
| 2000 | 65.3% 3,384 | 33.4% 1,727 | 1.3% 68 |
| 1996 | 45.9% 2,140 | 43.8% 2,040 | 10.3% 478 |
| 1992 | 43.7% 2,154 | 44.4% 2,190 | 11.9% 586 |
| 1988 | 58.6% 2,590 | 41.2% 1,822 | 0.3% 11 |
| 1984 | 65.3% 2,873 | 34.4% 1,514 | 0.3% 13 |
| 1980 | 47.1% 2,000 | 51.4% 2,183 | 1.6% 66 |
| 1976 | 38.6% 1,409 | 60.4% 2,207 | 1.1% 39 |
| 1972 | 61.5% 2,449 | 37.3% 1,483 | 1.2% 48 |
| 1968 | 47.8% 1,862 | 32.1% 1,251 | 20.1% 784 |
| 1964 | 30.2% 1,195 | 69.3% 2,742 | 0.5% 20 |
| 1960 | 60.9% 2,668 | 39.1% 1,713 | 0.0% 0 |
| 1956 | 56.1% 2,387 | 43.7% 1,859 | 0.3% 13 |
| 1952 | 56.0% 2,161 | 44.0% 1,701 | 0.0% 0 |
| 1948 | 39.0% 1,277 | 57.0% 1,864 | 4.0% 130 |
| 1944 | 42.6% 1,550 | 56.7% 2,065 | 0.7% 26 |
| 1940 | 34.6% 1,309 | 65.1% 2,463 | 0.2% 9 |
| 1936 | 33.2% 1,151 | 66.5% 2,305 | 0.3% 11 |
| 1932 | 31.7% 1,235 | 68.0% 2,650 | 0.4% 14 |
| 1928 | 52.2% 1,892 | 47.6% 1,727 | 0.2% 6 |
| 1924 | 40.4% 1,372 | 58.7% 1,993 | 0.9% 29 |
| 1920 | 43.7% 1,838 | 56.1% 2,361 | 0.3% 12 |
| 1916 | 40.7% 936 | 58.7% 1,350 | 0.6% 13 |
| 1912 | 17.4% 390 | 56.4% 1,265 | 26.3% 590 |
See also
References
- "State & County QuickFacts". US Census Bureau. Retrieved March 6, 2014.
- "Find a County". National Association of Counties. Retrieved 7 June 2011.
- E., Kleber, John; Kentucky, University Press of; Policy, Institute for Regional Analysis and Public; Library, Camden-Carroll; University, Morehead State (2000). "The Kentucky Encyclopedia". www.kyenc.org. Retrieved 3 July 2018.
- The Register of the Kentucky State Historical Society, Vol. 1. Kentucky State Historical Society. 1903. p. 35.
- LaRue County KY (Google Maps, accessed 10 October 2020)
- LaRue County High Point, Kentucky (PeakBagger.com, accessed 10 October 2020)
- "2010 Census Gazetteer Files". US Census Bureau. August 22, 2012. Archived from the original on August 12, 2014. Retrieved August 17, 2014.
- "Population and Housing Unit Estimates". Retrieved July 29, 2019.
- "U.S. Decennial Census". US Census Bureau. Retrieved August 17, 2014.
- "Historical Census Browser". University of Virginia Library. Retrieved August 17, 2014.
- "Population of Counties by Decennial Census: 1900 to 1990". US Census Bureau. Retrieved August 17, 2014.
- "Census 2000 PHC-T-4. Ranking Tables for Counties: 1990 and 2000" (PDF). US Census Bureau. Retrieved August 17, 2014.
- "US Census website". US Census Bureau. Retrieved 31 January 2008.
- Gleanings KY (Google Maps, accessed 10 October 2020)
- Leip, David. "Atlas of US Presidential Elections". uselectionatlas.org. Retrieved 3 July 2018.
Municipalities and communities of LaRue County, Kentucky, United States | ||
|---|---|---|
| Cities | Location of LaRue County, Kentucky | |
| CDPs | ||
| Other unincorporated communities | ||
| Footnotes | ‡This populated place also has portions in an adjacent county or counties | |
| ||
| Authority control |
|---|