Edmonton—St. Albert
Edmonton—St. Albert was a federal electoral district in Alberta, Canada, that was represented in the House of Commons of Canada from 2004 to 2015.
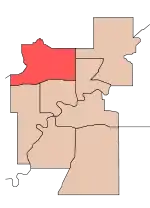
Edmonton–St. Albert in relation to other federal electoral districts in Edmonton | |
| Defunct federal electoral district | |
| Legislature | House of Commons |
| District created | 2003 |
| District abolished | 2013 |
| First contested | 2004 |
| Last contested | 2011 |
| District webpage | profile, map |
| Demographics | |
| Population (2011)[1] | 136,688 |
| Electors (2011) | 95,226 |
| Area (km²)[2] | 107.01 |
| Census division(s) | Division No. 11 |
| Census subdivision(s) | Edmonton, St. Albert |
Geography
The riding included the city of St. Albert and the neighbourhoods of Elsinore, Baturyn, Canossa, Lorelei, Beaumaris, Dunluce, Oxford, Griesbach, Carlisle, Caernarvon, Baranow, Cumberland, The Palisades, Pembina, Mooncrest Park, Wellington, Athlone, Kensington, Calder, Rosslyn and Lauderdale in the City of Edmonton.
History
The electoral district was created in 2003 from Edmonton North, St. Albert, and a small part of Edmonton West ridings.
Member of Parliament
This riding has elected the following Members of Parliament:
| Parliament | Years | Member | Party | |
|---|---|---|---|---|
| Riding created from Edmonton North, St. Albert and Edmonton West | ||||
| 38th | 2004–2006 | John G. Williams | Conservative | |
| 39th | 2006–2008 | |||
| 40th | 2008–2011 | Brent Rathgeber | ||
| 41st | 2011–2013 | |||
| 2013–2015 | Independent | |||
| Riding dissolved into St. Albert—Edmonton, Edmonton Griesbach and Edmonton Manning |
||||
Elections results
| 2011 Canadian federal election | ||||||||
|---|---|---|---|---|---|---|---|---|
| Party | Candidate | Votes | % | ±% | Expenditures | |||
| Conservative | Brent Rathgeber | 34,468 | 63.46 | +1.82 | $44,689 | |||
| New Democratic | Brian LaBelle | 11,644 | 21.44 | +5.67 | $13 | |||
| Liberal | Kevin Taron | 5,796 | 10.67 | -3.92 | $10,294 | |||
| Green | Peter Johnston | 2,409 | 4.44 | -3.54 | $2,741 | |||
| Total valid votes/Expense limit | 54,317 | 100.00 | – | |||||
| Total rejected ballots | 151 | 0.28 | +0.05 | |||||
| Turnout | 54,468 | 56.26 | +2.59 | |||||
| Eligible voters | 96,815 | – | – | |||||
| 2008 Canadian federal election | ||||||||
|---|---|---|---|---|---|---|---|---|
| Party | Candidate | Votes | % | ±% | Expenditures | |||
| Conservative | Brent Rathgeber | 31,436 | 61.64 | +1.95 | $57,856 | |||
| New Democratic | Dave Burkhart | 8,045 | 15.77 | +1.75 | $1,945 | |||
| Liberal | Sam Sleiman | 7,441 | 14.59 | -5.70 | $17,082 | |||
| Green | Peter Johnston | 4,072 | 7.98 | +1.98 | $1,058 | |||
| Total valid votes/Expense limit | 50,994 | 100 | $94,898 | |||||
| Total rejected ballots | 118 | 0.23 | ||||||
| Turnout | 51,112 | 53.67 | ||||||
| 2006 Canadian federal election | ||||||||
|---|---|---|---|---|---|---|---|---|
| Party | Candidate | Votes | % | ±% | ||||
| Conservative | John G. Williams | 34,997 | 59.69 | +2.04 | ||||
| Liberal | Stanley Haroun | 11,893 | 20.29 | -3.85 | ||||
| New Democratic | Mike Melymick | 8,218 | 14.02 | +2.44 | ||||
| Green | Peter Johnston | 3,520 | 6.00 | -0.61 | ||||
| Total valid votes | 58,628 | 100.00 | ||||||
| 2004 Canadian federal election | ||||||||
|---|---|---|---|---|---|---|---|---|
| Party | Candidate | Votes | % | ±% | Expenditures | |||
| Conservative | John G. Williams | 29,508 | 57.65 | – | $45,165 | |||
| Liberal | Moe Saeed | 12,359 | 24.14 | – | $80,480 | |||
| New Democratic | Mike Melymick | 5,927 | 11.58 | – | $2,082 | |||
| Green | Conrad Bitangcol | 3,387 | 6.61 | – | $25 | |||
| Total valid votes | 51,181 | 100.00 | ||||||
| Total rejected ballots | 136 | 0.27 | ||||||
| Turnout | 51,317 | 60.04 | ||||||
See also
References
- "(Code 48015) Census Profile". 2011 census. Statistics Canada. 2012. Retrieved 2011-03-06.
Notes
- Statistics Canada: 2012
- Statistics Canada: 2012
External links
- Riding history for Edmonton—St. Albert from the Library of Parliament
- Expenditures - 2008
- Expenditures - 2004
- Website of the Parliament of Canada
.png.webp)
.png.webp)
This article is issued from Wikipedia. The text is licensed under Creative Commons - Attribution - Sharealike. Additional terms may apply for the media files.