Genetic history of Europe
The genetic history of Europe since the Upper Paleolithic is inseparable from that of wider Western Eurasia. By about 50-40,000 years ago (50-40 ka) a basal West Eurasian lineage had emerged (alongside a separate East Asian lineage) out of the undifferentiated "non-African" lineage of 70-50 ka.[3][4][5][6] Both basal East and West Eurasians acquired Neanderthal admixture in Europe and Asia.[7]
_PC_analysis.png.webp)
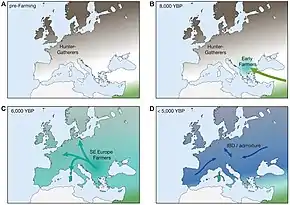
European early modern humans (EEMH) lineages between 40 and 26 ka (Aurignacian) were still part of a large Western Eurasian "meta-population", related to Central and Western Asian populations.[3] Divergence into genetically distinct sub-populations within Western Eurasia is a result of increased selection pressure and founder effects during the Last Glacial Maximum (LGM, Gravettian).[8] By the end of the LGM, after 20 ka, A Western European lineage, dubbed West European Hunter-Gatherer (WHG) emerges from the Solutrean refugium during the European Mesolithic.[9] These mesolithic hunter-gatherer cultures are substantially replaced in the Neolithic Revolution by the arrival of Early European Farmers (EEF) lineages derived from mesolithic populations of West Asia (Anatolia and the Caucasus).[10] In the European Bronze Age, there were again substantial population replacements in parts of Europe by the intrusion of Ancient North Eurasian (ANE) lineages from the Pontic–Caspian steppes. These Bronze Age population replacements are associated with the Beaker culture archaeologically and with the Indo-European expansion linguistically.[11]
As a result of the population movements during the Mesolithic to Bronze Age, modern European populations are distinguished by differences in WHG, EEF and ANE ancestry.[12][13][14] Admixture rates varied geographically; in the late Neolithic, WHG ancestry in farmers in Hungary was at around 10%, in Germany around 25% and in Iberia as high as 50%.[15] The contribution of EEF is more significant in Mediterranean Europe, and declines towards northern and northeastern Europe, where WHG ancestry is stronger; the Sardinians are considered to be the closest European group to the population of the EEF. ANE ancestry is found throughout Europe, with maxima of about 20% found in Baltic people and Finns.
Ethnogenesis of the modern ethnic groups of Europe in the historical period is associated with numerous admixture events, primarily those associated with the Roman, Germanic, Norse, Slavic, Arab and Turkish expansions.
Research into the genetic history of Europe became possible in the second half of the 20th century, but did not yield results with high resolution before the 1990s. In the 1990s, preliminary results became possible, but they remained mostly limited to studies of mitochondrial and Y-chromosomal lineages. Autosomal DNA became more easily accessible in the 2000s, and since the mid-2010s, results of previously unattainable resolution, many of them based on full-genome analysis of ancient DNA, have been published at an accelerated pace.[16][17]
Prehistory
The prehistory of the European peoples can be traced by the examination of archaeological sites, linguistic studies and by the examination of the DNA of the people who live in Europe or from ancient DNA. The research continues and so theories rise and fall. Although it is possible to track migrations of people across Europe using founder analysis of DNA, most information on these movements comes from archaeology.[18]
It is important to note that the settlement of Europe did not occur in discrete migrations, as might appear to be suggested. Rather, the settlement process was complex and "likely to have occurred in multiple waves from the east and to have been subsequently obscured by millennia of recurrent gene flow".[18]
Due to natural selection, the percentage of Neanderthal DNA in ancient Europeans gradually decreased over time. From 45,000 BP to 7,000 BP, the percentage dropped from around 3–6% to 2%.[17] The removal of Neanderthal-derived alleles occurred more frequently around genes than other parts of the genome.[17]
Palaeolithic
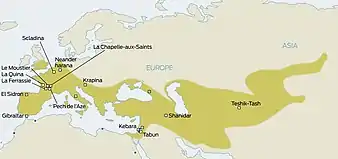
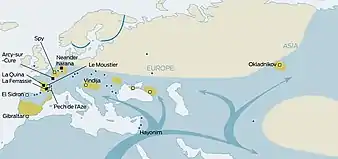
Neanderthals inhabited much of Europe and western Asia from as far back as 130,000 years ago. They existed in Europe as late as 30,000 years ago. They were eventually replaced by anatomically modern humans (AMH; sometimes known as Cro-Magnons), who began to appear in Europe circa 40,000 years ago. Given that the two hominid species likely coexisted in Europe, anthropologists have long wondered whether the two interacted.[19] The question was resolved only in 2010, when it was established that Eurasian populations exhibit Neanderthal admixture, estimated at 1.5–2.1% on average.[20] The question now became whether this admixture had taken place in Europe, or rather in the Levant, prior to AMH migration into Europe.
There has also been speculation about the inheritance of specific genes from Neanderthals. For example, one MAPT locus 17q21.3 which is split into deep genetic lineages H1 and H2. Since the H2 lineage seems restricted to European populations, several authors had argued for inheritance from Neanderthals beginning in 2005.[21][22][23][24][25] However the preliminary results from the sequencing of the full Neanderthal Genome at that time (2009), failed to uncover evidence of interbreeding between Neanderthals and modern humans.[26][27] By 2010, findings by Svante Pääbo (Max Planck Institute for Evolutionary Anthropology at Leipzig, Germany), Richard E. Green (University of California, Santa Cruz), and David Reich (Harvard Medical School), comparing the genetic material from the bones of three Neanderthals with that from five modern humans, did show a relationship between Neanderthals and modern people outside Africa.
Upper Paleolithic
It is thought that modern humans began to inhabit Europe during the Upper Paleolithic about 40,000 years ago. Some evidence shows the spread of the Aurignacian culture.[28]
From a purely patrilineal, Y-chromosome perspective, it is possible that the old Haplogroup C1a2, F and/or E may be those with the oldest presence in Europe. They have been found in some very old human remains in Europe. However, other haplogroup are far more common among living European males.
Haplogroup I (M170), which is now relatively common and widespread within Europe, may represent a Palaeolithic marker – its age has been estimated at ~ 22,000 BP. While it is now concentrated in Europe, it probably arose in a male from the Middle East or Caucasus, or their near descendants, c. 20–25,000 years BP, when it diverged from its immediate ancestor, haplogroup IJ. At about this time, an Upper Palaeolithic culture also appeared, known as the Gravettian.[29]
Earlier research into Y-DNA had instead focused on haplogroup R1 (M173): the most populous lineage among living European males; R1 was also believed to have emerged ~ 40,000 BP in Central Asia.[30][31] However, it is now estimated that R1 emerged substantially more recently: a 2008 study dated the most recent common ancestor of haplogroup IJ to 38,500 and haplogroup R1 to 18,000 BP. This suggested that haplogroup IJ colonists formed the first wave and haplogroup R1 arrived much later.[32]
Thus the genetic data suggests that, at least from the perspective of patrilineal ancestry, separate groups of modern humans took two routes into Europe: from the Middle East via the Balkans and another from Central Asia via the Eurasian Steppe, to the north of the Black Sea.
Martin Richards et al. found that 15–40% of extant mtDNA lineages trace back to the Palaeolithic migrations (depending on whether one allows for multiple founder events).[33] MtDNA haplogroup U5, dated to be ~ 40–50 kYa, arrived during the first early upper Palaeolithic colonisation. Individually, it accounts for 5–15% of total mtDNA lineages. Middle U.P. movements are marked by the haplogroups HV, I and U4. HV split into Pre-V (around 26,000 years old) and the larger branch H, both of which spread over Europe, possibly via Gravettian contacts.[29][34]
Haplogroup H accounts for about half the gene lines in Europe, with many subgroups. The above mtDNA lineages or their precursors, are most likely to have arrived into Europe via the Middle East. This contrasts with Y DNA evidence, whereby some 50%-plus of male lineages are characterised by the R1 superfamily, which is of possible central Asian origin. Ornella Semino postulates that these differences "may be due in part to the apparent more recent molecular age of Y chromosomes relative to other loci, suggesting more rapid replacement of previous Y chromosomes. Gender-based differential migratory demographic behaviors will also influence the observed patterns of mtDNA and Y variation".
Last Glacial Maximum
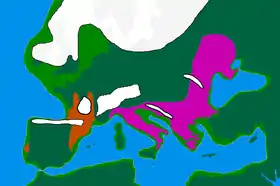
The Last Glacial Maximum ("LGM") started c. 30 ka BCE, at the end of MIS 3, leading to a depopulation of Northern Europe. According to the classical model, people took refuge in climatic sanctuaries (or refugia) as follows:
- Northern Iberia and Southwest France, together making up the "Franco-Cantabrian" refugium
- The Balkans
- Ukraine and more generally the northern coast of the Black Sea[29]
- Italy.[35]
This event decreased the overall genetic diversity in Europe, a "result of drift, consistent with an inferred population bottleneck during the Last Glacial Maximum".[36] As the glaciers receded from about 16,000–13,000 years ago, Europe began to be slowly repopulated by people from refugia, leaving genetic signatures.[37]
Some Y haplogroup I clades appear to have diverged from their parental haplogroups sometime during or shortly after the LGM.[38] Haplogroup I2 is prevalent in the western Balkans, as well as the rest of southeastern and central-eastern Europe in more moderate frequencies. Its frequency drops rapidly in central Europe, suggesting that the survivors bearing I2 lineages expanded predominantly through south-eastern and central-eastern Europe.[39]
Cinnioglu sees evidence for the existence of an Anatolian refuge, which also harboured Hg R1b1b2.[40] Today, R1b dominates the y chromosome landscape of western Europe, including the British Isles, suggesting that there could have been large population composition changes based on migrations after the LGM.
Semino, Passarino and Pericic place the origins of haplogroup R1a within the Ukrainian ice-age refuge. Its current distribution in eastern Europe and parts of Scandinavia are in part reflective of a re-peopling of Europe from the southern Russian/Ukrainian steppes after the Late Glacial Maximum.[41][42][43]
From an mtDNA perspective, Richards et al. found that the majority of mtDNA diversity in Europe is accounted for by post-glacial re-expansions during the late upper Palaeolithic/ Mesolithic. "The regional analyses lend some support to the suggestion that much of western and central Europe was repopulated largely from the southwest when the climate improved. The lineages involved include much of the most common haplogroup, H, as well as much of K, T, W, and X." The study could not determine whether there were new migrations of mtDNA lineages from the near east during this period; a significant input was deemed unlikely.[18]
The alternative model of more refugees was discussed by Bilton et al.[44]
From a study of 51 individuals, researchers were able to identify five separate genetic clusters of ancient Europeans during the LGM: the Věstonice Cluster (34,000–26,000 years ago), associated with the Gravettian culture; the Mal'ta Cluster (24,000–17,000), associated with the Mal'ta-Buret' culture, the El Mirón Cluster (19,000–14,000 years ago), associated with the Magdalenian culture; the Villabruna Cluster (14,000–7,000 years ago) and the Satsurblia Cluster (13,000 to 10,000 years ago).[17]
From around 37,000 years ago, all ancient Europeans began to share some ancestry with modern Europeans.[17] This founding population is represented by GoyetQ116-1, a 35,000 year old specimen from Belgium.[17] This lineage disappears from the record and is not found again until 19,000 BP in Spain at El Mirón, which shows strong affinities to GoyetQ116-1.[17] During this interval, the distinct Věstonice Cluster is predominant in Europe, even at Goyet.[17] The re-expansion of the El Mirón Cluster coincided with warming temperatures following the retreat of the glaciers during the Last Glacial Maximum.[17] From 37,000 to 14,000 years ago, the population of Europe consisted of an isolated population descended from a founding population that didn't interbreed significantly with other populations.[45]
Mesolithic
Mesolithic (post-LGM) populations had diverged significantly due to their relative isolation over several millennia, due to the harsh selection pressures during the LGM, and due to the founder effects caused by the rapid expansion from LGM refugia in the beginning Mesolithic.[8] By the end of the LGM, around 19 to 11 ka, the familiar varieties of Eurasian phenotypes had emerged. However, the lineage of Mesolithic hunter-gatherers of Western Europe (WHG) does not survive as a majority contribution in any modern population. They were most likely blue eyed, and retained the dark skin pigmentation of pre-LGM EEMH.[46] The HERC2 and OCA2 variations for blue eyes are derived from the WHG lineage were also found in the Yamnaya people.[46]
Around 14,000 years ago, the Villabruna Cluster shifted away from GoyetQ116-1 affinity and started to show more affinity with the Near East, a shift which coincided with the warming temperatures of the Bølling-Allerød interstadial.[17] This genetic shift shows that Near East populations had probably already begun moving into Europe during the end of the Upper Paleolithic, about 6,000 years earlier than previously thought, before the introduction of farming.[45] A few specimens from the Villabruna Cluster also show genetic affinities for East Asians that are derived from gene flow.[17][45] The HERC2 variation for blue eyes first appears around 13,000 to 14,000 years ago in Italy and the Caucasus.[17] The light skin pigmentation characteristic of modern Europeans is estimated to have spread across Europe in a "selective sweep" during the Mesolithic (19 to 11 ka). The associated TYRP1 SLC24A5 and SLC45A2 alleles emerge around 19 ka, still during the LGM, most likely in the Caucasus.[47][48]
Neolithic
_and_modern_Western_Eurasian_populations.jpg.webp)
A big cline in genetic variation that has long been recognised in Europe seems to show important dispersals from the direction of the Middle East. This has often been linked to the spread of farming technology during the Neolithic, which has been argued to be one of the most important periods in determining modern European genetic diversity.
The Neolithic started with the introduction of farming, beginning in SE Europe approximately 10,000–3000 BCE, and extending into NW Europe between 4500–1700 BCE. During this era, the Neolithic revolution led to drastic economic as well as socio-cultural changes in Europe and this is also thought to have had a big effect on Europe's genetic diversity, especially concerning genetic lineages entering Europe from the Middle East into the Balkans. There were several phases of this period:
- In a late European Mesolithic prelude to the Neolithic, it appears that Near Eastern peoples from areas that already had farming, and who also had sea-faring technology, had a transient presence in Greece (for example at Franchthi Cave).[51][52]
- There is consensus that agricultural technology and the main breeds of animals and plants which are farmed entered Europe from somewhere in the area of the Fertile Crescent and specifically the Levant region from the Sinai to Southern Anatolia.[53][54] (Less certainly, this agricultural revolution is sometimes argued to have in turn been partly triggered by movements of people and technology coming across the Sinai from Africa.) For more see Fertile Crescent: Cosmopolitan diffusion.
- A later stage of the Neolithic, the so-called Pottery Neolithic, saw an introduction of pottery into the Levant, Balkans and Southern Italy (it had been present in the area of modern Sudan for some time before it is found in the Eastern Mediterranean, but it is thought to have developed independently), and this may have also been a period of cultural transfer from the Levant into the Balkans.
An important issue regarding the genetic impact of neolithic technologies in Europe is the manner by which they were transferred into Europe. Farming was introduced by a significant migration of farmers from the Near East (Cavalli-Sforza's biological demic diffusion model) or a "cultural diffusion" or a combination of the two, and population geneticists have tried to clarify whether any genetic signatures of Near Eastern origin correspond to the expansion routes postulated by the archaeological evidence.[55]
Martin Richards estimated that only 11% of European mtDNA is due to immigration in this period, suggesting that farming was spread primarily due to being adopted by indigenous Mesolithic populations, rather than due to immigration from Near East. Gene flow from SE to NW Europe seems to have continued in the Neolithic, the percentage significantly declining towards the British Isles. Classical genetics also suggested that the largest admixture to the European Paleolithic/Mesolithic stock was due to the Neolithic revolution of the 7th to 5th millennia BCE.[56] Three main mtDNA gene groups have been identified as contributing Neolithic entrants into Europe: J, T1 and U3 (in that order of importance). With others, they amount up to around 20% of the gene pool.[33]
In 2000, Semino's study on Y DNA revealed the presence of haplotypes belonging to the large clade E1b1b1 (E-M35). These were predominantly found in the southern Balkans, southern Italy and parts of Iberia. Semino connected this pattern, along with J haplogroup subclades, to be the Y-DNA component of Cavalli-Sforza's Neolithic demic-diffusion of farmers from the Near East.[57] Rosser et al. rather saw it as a (direct) 'North African component' in European genealogy, although they did not propose a timing and mechanism to account for it.[58] Underhill and Kivisild (2007) also described E1b1b as representing a late-Pleistocene migration from Africa to Europe over the Sinai Peninsula in Egypt, evidence for which does not show up in mitochondrial DNA.[59]
Concerning timing the distribution and diversity of V13 however, Battaglia et al. (2008) proposed an earlier movement whereby the E-M78* lineage ancestral to all modern E-V13 men moved rapidly out of a Southern Egyptian homeland and arrived in Europe with only Mesolithic technologies. They then suggest that the E-V13 sub-clade of E-M78 only expanded subsequently as native Balkan 'foragers-cum-farmers' adopted Neolithic technologies from the Near East. They propose that the first major dispersal of E-V13 from the Balkans may have been in the direction of the Adriatic Sea with the Neolithic Impressed Ware culture often referred to as Impressa or Cardial. Peričic et al. (2005), rather propose that the main route of E-V13 spread was along the Vardar-Morava-Danube river 'highway' system.
In contrast to Battaglia, Cruciani et al. (2007) tentatively suggested (i) a different point where the V13 mutation happened on its way from Egypt to the Balkans via the Middle East, and (ii) a later dispersal time. The authors proposed that the V13 mutation first appeared in western Asia, where it is found in low but significant frequencies, whence it entered the Balkans sometime after 11 kYa. It later experienced a rapid dispersal which he dated to c. 5300 years ago in Europe, coinciding with the Balkan Bronze Age. Like Peričic et al. they consider that "the dispersion of the E-V13 and J-M12 haplogroups seems to have mainly followed the river waterways connecting the southern Balkans to north-central Europe".
More recently, Lacan et al. (2011) announced that a 7000-year-old skeleton in a Neolithic context in a Spanish funeral cave, was an E-V13 man. (The other specimens tested from the same site were in haplogroup G2a, which has been found in Neolithic contexts throughout Europe.) Using 7 STR markers, this specimen was identified as being similar to modern individuals tested in Albania, Bosnia, Greece, Corsica, and Provence. The authors therefore proposed that, whether or not the modern distribution of E-V13 of today is a result of more recent events, E-V13 was already in Europe within the Neolithic, carried by early farmers from the Eastern Mediterranean to the Western Mediterranean, much earlier than the Bronze Age. This supports the proposals of Battaglia et al. rather than Cruciani et al. at least concerning earliest European dispersals, but E-V13 may have dispersed more than once. Even more recent than the Bronze Age, it has also been proposed that modern E-V13's modern distribution in Europe is at least partly caused by Roman era movements of people.[60] (See below.)
The migration of Neolithic farmers into Europe brought along several new adaptations.[46] The variation for light skin colour was introduced to Europe by the neolithic farmers.[46] After the arrival of the neolithic farmers, a SLC22A4 mutation was selected for, a mutation which probably arose to deal with ergothioneine deficiency but increases the risk of ulcerative colitis, coeliac disease, and irritable bowel syndrome.
Bronze Age
The Bronze Age saw the development of long-distance trading networks, particularly along the Atlantic Coast and in the Danube valley. There was migration from Norway to Orkney and Shetland in this period (and to a lesser extent to mainland Scotland and Ireland). There was also migration from Germany to eastern England. Martin Richards estimated that there was about 4% mtDNA immigration to Europe in the Bronze Age.
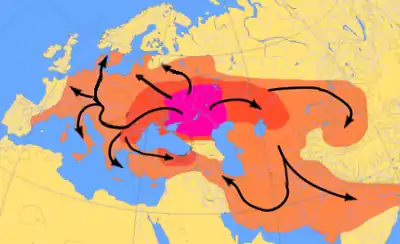
Another theory about the origin of the Indo-European language centres around a hypothetical Proto-Indo-European people, who, according to the Kurgan hypothesis, can be traced to north of the Black and Caspian Seas at about 4500 BCE.[61] They domesticated the horse and possibly invented the wooden disk wheel, and are considered to have spread their culture and genes across Europe.[62] The Y haplogroup R1a is a proposed marker of these "Kurgan" genes, as is the Y Haplogroup R1b, although these haplogroups as a whole may be much older than the language family.[63]
In the far north, carriers of the Y-haplogroup N arrived to Europe from Siberia, eventually expanding as far as Finland, though the specific timing of their arrival is uncertain. The most common North European subclade N1c1 is estimated to be around 8,000 years old. There is evidence of human settlement in Finland dating back to 8500 BCE, linked with the Kunda culture and its putative ancestor, the Swiderian culture, but the latter is thought to have a European origin. The geographical spread of haplogroup N in Europe is well aligned with the Pit–Comb Ware culture, whose emergence is commonly dated c. 4200 BCE, and with the distribution of Uralic languages. Mitochondrial DNA studies of Sami people, haplogroup U5 are consistent with multiple migrations to Scandinavia from Volga-Ural region, starting 6,000 to 7,000 years before present.[64]
The relationship between roles of European and Asian colonists in the prehistory of Finland is a point of some contention, and some scholars insist that Finns are "predominantly Eastern European and made up of people who trekked north from the Ukrainian refuge during the Ice Age".[65] Farther east, the issue is less contentious. Haplogroup N carriers account for a significant part of all non-Slavic ethnic groups in northern Russia, including 37% of Karelians, 35% of Komi people (65% according to another study[66]), 67% of Mari people, as many as 98% of Nenets people, 94% of Nganasans, and 86% to 94% of Yakuts.[67]
The Yamnaya component contains partial ancestry from an Ancient North Eurasian component first identified in Mal'ta.[68] According to Iosif Lazaridis, "the Ancient North Eurasian ancestry is proportionally the smallest component everywhere in Europe, never more than 20 percent, but we find it in nearly every European group we’ve studied."[69] This genetic component does not come directly from the Mal'ta lineage itself, but a related lineage that separated from the Mal'ta lineage.[17]
Up to a half of the Yamnaya component may have come from a Caucasus hunter-gatherer strand.[68] On November 16, 2015, in a study published in the journal Nature Communications,[68] geneticists announced that they had found a new fourth ancestral "tribe" or "strand" which had contributed to the modern European gene pool. They analysed genomes from two hunter-gatherers from Georgia which were 13,300 and 9,700 years old, and found that these Caucasus hunter-gatherers were probably the source of the farmer-like DNA in the Yamna. According to co-author Dr Andrea Manica of the University of Cambridge: "The question of where the Yamnaya come from has been something of a mystery up to now....we can now answer that as we've found that their genetic make-up is a mix of Eastern European Hunter-Gatherers and a population from this pocket of Caucasus hunter-gatherers who weathered much of the last Ice Age in apparent isolation."[70]
According to Lazaridis et al. (2016), a population related to the people of the Chalcolithic Iran contributed to roughly half of the ancestry of Yamnaya populations of the Pontic–Caspian steppe. These Iranian Chalcolithic people were a mixture of "the Neolithic people of western Iran, the Levant, and Caucasus Hunter Gatherers."[71]
The genetic variations for lactase persistence and greater height came with the Yamnaya people.[46] The derived allele of the KITLG gene (SNP rs12821256) that is associated with – and likely causal for – blond hair in Europeans is found in populations with Eastern but not Western Hunter-Gatherers ancestry, suggesting that its origin is in the Ancient North Eurasian (ANE) population and may have been spread in Europe by individuals with steppe ancestry. Consistent with this, the earliest known individual with the derived allele is an ANE individual from the Late Upper Paleolithic Afontova Gora archaeological complex in central Siberia.[72]
Recent history
During the period of the Roman Empire, historical sources show that there were many movements of people around Europe, both within and outside the Empire. Historic sources sometimes cite instances of genocide inflicted by the Romans upon rebellious provincial tribes. If this did in fact occur, it would have been limited given that modern populations show considerable genetic continuity in their respective regions. The process of 'Romanisation' appears to have been accomplished by the colonisation of provinces by a few Latin speaking administrators, military personnel, settled veterans, and private citizens (merchants, traders) who emanated from the Empire's various regions (and not merely from Roman Italy). They served as a nucleus for the acculturation of local notables.[74]
Given their small numbers and varied origins, Romanization does not appear to have left distinct genetic signatures in Europe. Indeed, Romance-speaking populations in the Balkans, like Romanians, Aromanians, Moldovans, etc. have been found to genetically resemble neighbouring Greek and South Slavic-speaking peoples rather than modern Italians, proving that they were genetically speaking, mainly through I2a2 M-423 and E1b1b1, V-13 Haplogroups native to this area.[75][76]
Steven Bird has speculated that E1b1b1a was spread during the Roman era through Thracian and Dacian populations from the Balkans into the rest of Europe.[60]
Concerning the late Roman period of (not only) Germanic "Völkerwanderung", some suggestions have been made, at least for Britain, with Y haplogroup I1a being associated with Anglo-Saxon immigration in eastern England, and R1a being associated with Norse immigration in northern Scotland.[77]
Genetics of modern European populations
Patrilineal studies
There are four main Y-chromosome DNA haplogroups that account for most of Europe's patrilineal descent.[78]
- Haplogroup I is found in the form of various sub-clades throughout Europe and is found at highest frequencies in the Nordic Countries as I1 (Norway, Denmark, Sweden, Finland) and in the Balkan Peninsula as I2a (Bosnia and Herzegovina 65%,[79] Croatia and Serbia). I1 is also frequent in Germany, Great Britain and Netherlands, while I2a is frequent also in Sardinia, Romania/Moldova, Bulgaria and Ukraine. This clade is found at its highest expression by far in Europe and may have been there since before the LGM.[38]
- Haplogroup E1b1b (formerly known as E3b) represents the last major direct migration from Africa into Europe. It is believed to have first appeared in the Horn of Africa approximately 26,000 years ago and dispersed to North Africa and the Near East during the late Paleolithic and Mesolithic periods. E1b1b lineages are closely linked to the diffusion of Afroasiatic languages. Although present throughout Europe, it peaks in the western Balkan region amongst Albanians and their neighbors. It is also common in Italy and the Iberian peninsula. Haplogroup E1b1b1, mainly in the form of its E1b1b1a2 (E-V13) sub-clade, reaches frequencies above 47% around the area of Kosovo.[80] This clade is thought to have arrived in Europe from western Asia either in the later Mesolithic,[81] or the Neolithic.[82] North Africa subclade E-M81 is also present in Sicily and Andalusia.
- Haplogroup R1b is common all over Europe, with R1b1a1a2 especially common in Western Europe.[83][84][85] Nearly all of this R1b in Europe is in the form of the R1b1a2 (2011 name) (R-M269) sub-clade, specifically within the R-L23 sub-sub-clade whereas R1b found in Central Asia, western Asia and Africa tends to be in other clades. It has also been pointed out that outlier types are present in Europe and are particularly notable in some areas such as Sardinia and Armenia.[86] Haplogroup R1b frequencies vary from highs in western Europe in a steadily decreasing cline with growing distance from the Atlantic: 80–90% (Welsh, Basque, Irish, Scots, Bretons) around 70–80% in other areas of Spain, Britain and France and around 40–60% in most other parts of western Europe like eastern Germany, and northern-central Italy. It drops outside this area and is around 30% or less in areas such as southern Italy, Sweden, Poland, the Balkans and Cyprus. R1b remains the most common clade as one moves east to Germany, while farther east, in Poland, R1a is more common (see below).[87] In southeastern Europe, R1b drops behind R1a in the area in and around Hungary and Serbia but is more common both to the south and north of this region.[88] R1b in Western Europe is dominated by at least two sub-clades, R-U106, which is distributed from the east side of the Rhine into northern and central Europe (with a strong presence in England) and R-P312, which is most common west of the Rhine, including the British Isles.[84][85] Some have posited that this haplogroup's presence in Europe dates back to the LGM, while others link it to the spread of the Centum branch of the Indo-European languages.
- The oldest human remains found to carry R1b so far are an individual from the Epigravettian culture context in Italy (Villabruna) who lived c. 12,000 BCE and reportedly belonged to R1b1a (L754), and the 7,000 year-old remains of a hunter-gatherer, belonging to the Samara culture of the Volga River area who carried R1b1* (R-L278*).
- Haplogroup R1a, almost entirely in the R1a1a sub-clade, is prevalent in much of Eastern and Central Europe (also in South and Central Asia). For example, there is a sharp increase in R1a1 and decrease in R1b1b2 as one goes east from Germany to Poland.[87] It also has a substantial presence in Scandinavia (particularly Norway).[89][90] In the Baltic countries R1a frequencies decrease from Lithuania (45%) to Estonia (around 30%).[91]
Putting aside small enclaves, there are also several haplogroups apart from the above four that are less prominent or most common only in certain areas of Europe.
- Haplogroup G, the original Neolithic Europeans (Caucasians), is common in most parts of Europe at a low frequency, reaching peaks above 70% around Georgia and among the Madjars (although living in Asia they border the eastern perimeter of Europe), up to 10% in Sardinia, 12% in Corsica and Uppsala (Sweden), 11% in the Balkans and Portugal, 10% in Spain and 9% in European Russia. This clade is also found in the Near East.
- Haplogroup N, is common only in the northeast of Europe and in the form of its N1c1 sub-clade reaches frequencies of approximately 60% among Finns and approximately 40% among Estonians, Latvians, and Lithuanians.
- Haplogroup J2, in various sub-clades (J2a, J2b), is found in levels of around 15–30% in parts of the Balkans and Italy and is common all over Europe and especially the Mediterranean basin[92]
Matrilineal studies
There have been a number of studies about the mitochondrial DNA haplogroups (mtDNA) in Europe. In contrast to Y DNA haplogroups, mtDNA haplogroups did not show as much geographical patterning, but were more evenly ubiquitous. Apart from the outlying Saami, all Europeans are characterised by the predominance of haplogroups H, U and T. The lack of observable geographic structuring of mtDNA may be due to socio-cultural factors, namely the phenomena of polygyny and patrilocality.[93]
Genetic studies suggest some maternal gene flow to eastern Europe from eastern Asia or southern Siberia 13,000 – 6,600 years BP.[94] Analysis of Neolithic skeletons in the Great Hungarian Plain found a high frequency of eastern Asian mtDNA haplogroups, some of which survive in modern eastern European populations.[94] Maternal gene flow to Europe from sub-Saharan Africa began as early as 11,000 years BP, although the majority of lineages, approximately 65%, are estimated to have arrived more recently, including during the Romanization period, the Arab conquests of southern Europe, and during the Atlantic slave trade.[95]
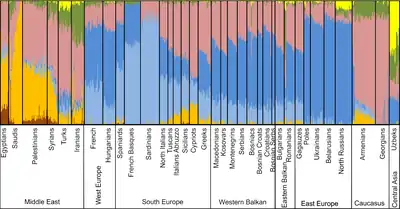
European population sub-structure
Genetically, Europe is relatively homogeneous, but distinct sub-population patterns of various types of genetic markers have been found,[96] particularly along a southeast-northwest cline.[97] For example, Cavalli-Sforza's principal component analyses revealed five major clinal patterns throughout Europe, and similar patterns have continued to be found in more recent studies.[98]
- A cline of genes with highest frequencies in the Middle East, spreading to lowest levels northwest. Cavalli-Sforza originally described this as faithfully reflecting the spread of agriculture in Neolithic times. This has been the general tendency in interpretation of all genes with this pattern.
- A cline of genes with highest frequencies among Finnish and Sami in the extreme north east, and spreading to lowest frequencies in the south west.
- A cline of genes with highest frequencies in the area of the lower Don and Volga rivers in southern Russia, and spreading to lowest frequencies in Spain, Southern Italy, Greece and the areas inhabited by Saami speakers in the extreme north of Scandinavia. Cavalli-Sforza associated this with the spread of Indo-European languages, which he links in turn to a "secondary expansion" after the spread of agriculture, associated with animal grazing.
- A cline of genes with highest frequencies in the Balkans and Southern Italy, spreading to lowest levels in Britain and the Basque country. Cavalli-Sforza associates this with "the Greek expansion, which reached its peak in historical times around 1000 and 500 BCE but which certainly began earlier".
- A cline of genes with highest frequencies in the Basque country, and lower levels beyond the area of Iberia and Southern France. In perhaps the most well-known conclusion from Cavalli-Sforza, this weakest of the five patterns was described as isolated remnants of the pre-Neolithic population of Europe, "who at least partially withstood the expansion of the cultivators". It corresponds roughly to the geographical spread of rhesus negative blood types. In particular, the conclusion that the Basques are a genetic isolate has become widely discussed, but also a controversial conclusion.
He also created a phylogenetic tree to analyse the internal relationships among Europeans. He found four major 'outliers'- Basques, Sami, Sardinians and Icelanders;[99] a result he attributed to their relative isolation (note: the Icelanders and the Sardinians speak Indo-European languages, while the other two groups do not). Greeks and Yugoslavs represented a second group of less extreme outliers. The remaining populations clustered into several groups : "Celtic", "Germanic", "south-western Europeans", "Scandinavians" and "eastern Europeans".[100]
A study in May 2009[101] of 19 populations from Europe using 270,000 SNPs highlighted the genetic diversity of European populations corresponding to the northwest to southeast gradient and distinguished "four several distinct regions" within Europe:
- Finland, showing the greatest distance to the rest of Europeans.
- the Baltic region (Estonia, Latvia and Lithuania), western Russia and eastern Poland.
- Central and Western Europe.
- Italy, "with the southern Italians being more distant".
In this study, barrier analysis revealed "genetic barriers" between Finland, Italy and other countries and that barriers could also be demonstrated within Finland (between Helsinki and Kuusamo) and Italy (between northern and southern part, Fst=0.0050). Fst (Fixation index) was found to correlate considerably with geographic distances ranging from ≤0.0010 for neighbouring populations to 0.0200–0.0230 for Southern Italy and Finland. For comparisons, pair-wise Fst of non-European samples were as follows: Europeans – Africans (Yoruba) 0.1530; Europeans – Chinese 0.1100; Africans (Yoruba) – Chinese 0.1900.[102]
A study by Chao Tian in August 2009 extended the analysis of European population genetic structure to include additional southern European groups and Arab populations (Palestinians, Druzes...) from the Near-East. This study determined autosomal Fst between 18 population groups and concluded that, in general, genetic distances corresponded to geographical relationships with smaller values between population groups with origins in neighbouring countries/regions (for example, Greeks/Tuscans: Fst=0.0010, Greeks/Palestinians: Fst=0.0057) compared with those from very different regions in Europe (for example Greeks/Swedish: Fst=0.0087, Greeks/Russians: Fst=0.0108).[103][104]
Autosomal DNA
Seldin (2006) used over 5,000 autosomal SNPs. It showed "a consistent and reproducible distinction between ‘northern’ and ‘southern’ European population groups". Most individual participants with southern European ancestry (Italians, Greeks, Portuguese, Spaniards), and Ashkenazi Jews have >85% membership in the southern population; and most northern, western, central, and eastern Europeans (Swedes, English, Irish, Germans, and Ukrainians) have >90% in the northern population group. However, many of the participants in this study were actually American citizens who self-identified with different European ethnicities based on self-reported familial pedigree.[105]
A similar study in 2007 using samples predominantly from Europe found that the most important genetic differentiation in Europe occurs on a line from the north to the south-east (northern Europe to the Balkans), with another east-west axis of differentiation across Europe. Its findings were consistent with earlier results based on mtDNA and Y-chromosomal DNA that support the theory that modern Iberians (Spanish and Portuguese) hold the most ancient European genetic ancestry, as well as separating Basques and Sami from other European populations.[106]
It suggested that the English and Irish cluster with other Northern and Eastern Europeans such as Germans and Poles, while some Basque and Italian individuals also clustered with Northern Europeans. Despite these stratifications, it noted that "there is low apparent diversity in Europe with the entire continent-wide samples only marginally more dispersed than single population samples elsewhere in the world".[106]
In 2008, two international research teams published analyses of large-scale genotyping of large samples of Europeans, using over 300,000 autosomal SNPs. With the exception of usual isolates such as Basques, Finns and Sardinians, the European population lacked sharp discontinuities (clustering) as previous studies have found (see Seldin et al. 2006 and Bauchet et al. 2007[106]), although there was a discernible south to north gradient. Overall, they found only a low level of genetic differentiation between subpopulations, and differences which did exist were characterised by a strong continent-wide correlation between geographic and genetic distance. In addition, they found that diversity was greatest in southern Europe due a larger effective population size and/or population expansion from southern to northern Europe.[107] The researchers take this observation to imply that genetically, Europeans are not distributed into discrete populations.[108][109]
A study on north-eastern populations, published in March 2013, found that Komi peoples formed a pole of genetic diversity that is distinct from other populations.[110]
Autosomal genetic distances (Fst) based on SNPs (2009)
The genetic distance between populations is often measured by Fixation index (Fst), based on genetic polymorphism data, such as single-nucleotide polymorphisms (SNPs) or microsatellites. Fst is a special case of F-statistics, the concept developed in the 1920s by Sewall Wright. Fst is simply the correlation of randomly chosen alleles within the same sub-population relative to that found in the entire population. It is often expressed as the proportion of genetic diversity due to allele frequency differences among populations.
The values range from 0 to 1. A zero value implies that the two populations are panmictic, that they are interbreeding freely. A value of one would imply that the two populations are completely separate. The greater the Fst value, the greater the genetic distance. Essentially, these low Fst values suggest that the majority of genetic variation is at the level of individuals within the same population group (~ 85%); whilst belonging to a different population group within same ‘race’/ continent, and even to different racial/ continental groups added a much smaller degree of variation (3–8%; 6–11%, respectively).
| Italian Americans | Palestinians | Swedes | Druzes | Spaniards | Germans | Russians | Irish | Greek Americans | Ashkenazi Jews | Circassians | |
|---|---|---|---|---|---|---|---|---|---|---|---|
| Italian Americans | 0.0064 | 0.0064 | 0.0057 | 0.0010 | 0.0029 | 0.0088 | 0.0048 | 0.0000 | 0.0040 | 0.0067 | |
| Palestinians | 0.0064 | 0.0191 | 0.0064 | 0.0101 | 0.0136 | 0.0202 | 0.0170 | 0.0057 | 0.0093 | 0.0108 | |
| Swedes | 0.0064 | 0.0191 | 0.0167 | 0.0040 | 0.0007 | 0.0030 | 0.0020 | 0.0084 | 0.0120 | 0.0117 | |
| Druzes | 0.0057 | 0.0064 | 0.0167 | 0.0096 | 0.0121 | 0.0194 | 0.0154 | 0.0052 | 0.0088 | 0.0092 | |
| Spaniards | 0.0010 | 0.0101 | 0.0040 | 0.0096 | 0.0015 | 0.0070 | 0.0037 | 0.0035 | 0.0056 | 0.0090 | |
| Germans | 0.0029 | 0.0136 | 0.0007 | 0.0121 | 0.0015 | 0.0030 | 0.0010 | 0.0039 | 0.0072 | 0.0089 | |
| Russians | 0.0088 | 0.0202 | 0.0030 | 0.0194 | 0.0070 | 0.0030 | 0.0038 | 0.0108 | 0.0137 | 0.0120 | |
| Irish | 0.0048 | 0.0170 | 0.0020 | 0.0154 | 0.0037 | 0.0010 | 0.0038 | 0.0067 | 0.0109 | 0.0110 | |
| Greek Americans | 0.0000 | 0.0057 | 0.0084 | 0.0052 | 0.0035 | 0.0039 | 0.0108 | 0.0067 | 0.0042 | 0.0054 | |
| Ashkenazi Jews | 0.0040 | 0.0093 | 0.0120 | 0.0088 | 0.0056 | 0.0072 | 0.0137 | 0.0109 | 0.0042 | 0.0107 | |
| Circassians | 0.0067 | 0.0108 | 0.0117 | 0.0092 | 0.0090 | 0.0089 | 0.0120 | 0.0110 | 0.0054 | 0.0107 |
CEU – Utah residents with ancestry from Northern and Western Europe.
| Austria | Bulgaria | Czech Republic | Estonia | Finland (Helsinki) | Finland (Kuusamo) | France | Northern Germany | Southern Germany | Hungary | Northern Italy | Southern Italy | Latvia | Lithuania | Poland | Russia | Spain | Sweden | Switzerland | CEU | ||
|---|---|---|---|---|---|---|---|---|---|---|---|---|---|---|---|---|---|---|---|---|---|
| Austria | 1.14 | 1.08 | 1.58 | 2.24 | 3.30 | 1.16 | 1.10 | 1.04 | 1.04 | 1.49 | 1.79 | 1.85 | 1.70 | 1.19 | 1.47 | 1.41 | 1.21 | 1.19 | 1.12 | Austria | |
| Bulgaria | 1.14 | 1.21 | 1.70 | 2.19 | 2.91 | 1.22 | 1.32 | 1.19 | 1.10 | 1.32 | 1.38 | 1.86 | 1.73 | 1.29 | 1.53 | 1.30 | 1.47 | 1.13 | 1.29 | Bulgaria | |
| Czech Republic | 1.08 | 1.21 | 1.42 | 2.20 | 3.26 | 1.35 | 1.15 | 1.16 | 1.06 | 1.69 | 2.04 | 1.62 | 1.48 | 1.09 | 1.27 | 1.63 | 1.26 | 1.37 | 1.21 | Czech Republic | |
| Estonia | 1.58 | 1.70 | 1.42 | 1.71 | 2.80 | 2.08 | 1.53 | 1.70 | 1.41 | 2.42 | 2.93 | 1.24 | 1.28 | 1.17 | 1.21 | 2.54 | 1.49 | 2.16 | 1.59 | Estonia | |
| Finland (Helsinki) | 2.24 | 2.19 | 2.20 | 1.71 | 1.86 | 2.69 | 2.17 | 2.35 | 1.87 | 2.82 | 3.37 | 2.31 | 2.33 | 1.75 | 2.10 | 3.14 | 1.89 | 2.77 | 1.99 | Finland (Helsinki) | |
| Finland (Kuusamo) | 3.30 | 2.91 | 3.26 | 2.80 | 1.86 | 3.72 | 3.27 | 3.46 | 2.68 | 3.64 | 4.18 | 3.33 | 3.37 | 2.49 | 3.16 | 4.21 | 2.87 | 3.83 | 2.89 | Finland (Kuusamo) | |
| France | 1.16 | 1.22 | 1.35 | 2.08 | 2.69 | 3.72 | 1.25 | 1.12 | 1.16 | 1.38 | 1.68 | 2.40 | 2.20 | 1.44 | 1.94 | 1.13 | 1.38 | 1.10 | 1.13 | France | |
| Northern Germany | 1.10 | 1.32 | 1.15 | 1.53 | 2.17 | 3.27 | 1.25 | 1.08 | 1.11 | 1.72 | 2.14 | 1.84 | 1.66 | 1.18 | 1.49 | 1.62 | 1.12 | 1.36 | 1.06 | Northern Germany | |
| Southern Germany | 1.04 | 1.19 | 1.16 | 1.70 | 2.35 | 3.46 | 1.12 | 1.08 | 1.08 | 1.53 | 1.85 | 1.20 | 1.84 | 1.23 | 1.58 | 1.40 | 1.21 | 1.17 | 1.07 | Southern Germany | |
| Hungary | 1.04 | 1.10 | 1.06 | 1.41 | 1.87 | 2.68 | 1.16 | 1.11 | 1.08 | 1.42 | 1.63 | 1.58 | 1.46 | 1.14 | 1.28 | 1.32 | 1.22 | 1.16 | 1.13 | Hungary | |
| Northern Italy | 1.49 | 1.32 | 1.69 | 2.42 | 2.82 | 3.64 | 1.38 | 1.72 | 1.53 | 1.42 | 1.54 | 2.64 | 2.48 | 1.75 | 2.24 | 1.42 | 1.86 | 1.36 | 1.56 | Northern Italy | |
| Southern Italy | 1.79 | 1.38 | 2.04 | 2.93 | 3.37 | 4.18 | 1.68 | 2.14 | 1.85 | 1.63 | 1.54 | 3.14 | 2.96 | 1.99 | 2.68 | 1.67 | 2.28 | 1.54 | 1.84 | Southern Italy | |
| Latvia | 1.85 | 1.86 | 1.62 | 1.24 | 2.31 | 3.33 | 2.40 | 1.84 | 1.20 | 1.58 | 2.64 | 3.14 | 1.20 | 1.26 | 1.84 | 2.82 | 1.89 | 2.52 | 1.87 | Latvia | |
| Lithuania | 1.70 | 1.73 | 1.48 | 1.28 | 2.33 | 3.37 | 2.20 | 1.66 | 1.84 | 1.46 | 2.48 | 2.96 | 1.20 | 1.20 | 1.26 | 2.62 | 1.74 | 2.29 | 1.74 | Lithuania | |
| Poland | 1.19 | 1.29 | 1.09 | 1.17 | 1.75 | 2.49 | 1.44 | 1.18 | 1.23 | 1.14 | 1.75 | 1.99 | 1.26 | 1.20 | 1.18 | 1.66 | 1.30 | 1.46 | 1.28 | Poland | |
| Russia | 1.47 | 1.53 | 1.27 | 1.21 | 2.10 | 3.16 | 1.94 | 1.49 | 1.58 | 1.28 | 2.24 | 2.68 | 1.84 | 1.26 | 1.18 | 2.32 | 1.59 | 1.20 | 1.56 | Russia | |
| Spain | 1.41 | 1.30 | 1.63 | 2.54 | 3.14 | 4.21 | 1.13 | 1.62 | 1.40 | 1.32 | 1.42 | 1.67 | 2.82 | 2.62 | 1.66 | 2.32 | 1.73 | 1.16 | 1.34 | Spain | |
| Sweden | 1.21 | 1.47 | 1.26 | 1.49 | 1.89 | 2.87 | 1.38 | 1.12 | 1.21 | 1.22 | 1.86 | 2.28 | 1.89 | 1.74 | 1.30 | 1.59 | 1.73 | 1.50 | 1.09 | Sweden | |
| Switzerland | 1.19 | 1.13 | 1.37 | 2.16 | 2.77 | 3.83 | 1.10 | 1.36 | 1.17 | 1.16 | 1.36 | 1.54 | 2.52 | 2.29 | 1.46 | 1.20 | 1.16 | 1.50 | 1.21 | Switzerland | |
| CEU | 1.12 | 1.29 | 1.21 | 1.59 | 1.99 | 2.89 | 1.13 | 1.06 | 1.07 | 1.13 | 1.56 | 1.84 | 1.87 | 1.74 | 1.28 | 1.56 | 1.34 | 1.09 | 1.21 | CEU | |
| Austria | Bulgaria | Czech Republic | Estonia | Finland (Helsinki) | Finland (Kuusamo) | France | Northern Germany | Southern Germany | Hungary | Northern Italy | Southern Italy | Latvia | Lithuania | Poland | Russia | Spain | Sweden | Switzerland | CEU | ||
History of research
Classical genetic markers (by proxy)
One of the first scholars to perform genetic studies was Luigi Luca Cavalli-Sforza. He used classical genetic markers to analyse DNA by proxy. This method studies differences in the frequencies of particular allelic traits, namely polymorphisms from proteins found within human blood (such as the ABO blood groups, Rhesus blood antigens, HLA loci, immunoglobulins, G6PD isoenzymes, among others). Subsequently, his team calculated genetic distance between populations, based on the principle that two populations that share similar frequencies of a trait are more closely related than populations that have more divergent frequencies of the trait.[114]
From this, he constructed phylogenetic trees that showed genetic distances diagrammatically. His team also performed principal component analyses, which is good at analysing multivariate data with minimal loss of information. The information that is lost can be partly restored by generating a second principal component, and so on.[115] In turn, the information from each individual principal component (PC) can be presented graphically in synthetic maps. These maps show peaks and troughs, which represent populations whose gene frequencies take extreme values compared to others in the studied area.[114]
Peaks and troughs usually connected by smooth gradients are called clines. Genetic clines can be generated by adaptation to environment (natural selection), continuous gene flow between two initially different populations or a demographic expansion into a scarcely populated environment, with little initial admixture with existing populations.[116] Cavalli-Sforza connected these gradients with postulated pre-historic population movements, based on archaeological and linguistic theories. However, given that the time depths of such patterns are not known, "associating them with particular demographic events is usually speculative".[93]
Direct DNA analysis
Studies using direct DNA analysis are now abundant and may use mitochondrial DNA (mtDNA), the non-recombining portion of the Y chromosome (NRY), or even autosomal DNA. MtDNA and NRY DNA share some similar features, which have made them particularly useful in genetic anthropology. These properties include the direct, unaltered inheritance of mtDNA and NRY DNA from mother to offspring and father to son, respectively, without the 'scrambling' effects of genetic recombination. We also presume that these genetic loci are not affected by natural selection and that the major process responsible for changes in base pairs has been mutation (which can be calculated).[117]
The smaller effective population size of the NRY and mtDNA enhances the consequences of drift and founder effect, relative to the autosomes, making NRY and mtDNA variation a potentially sensitive index of population composition.[93][33][118] These biologically plausible assumptions are not concrete; Rosser suggests that climatic conditions may affect the fertility of certain lineages.[93]
The underlying mutation rate used by the geneticists is more questionable. They often use different mutation rates and studies frequently arrive at vastly different conclusions.[93] NRY and mtDNA may be so susceptible to drift that some ancient patterns may have become obscured. Another assumption is that population genealogies are approximated by allele genealogies. Guido Barbujani points out that this only holds if population groups develop from a genetically monomorphic set of founders. Barbujani argues that there is no reason to believe that Europe was colonised by monomorphic populations. This would result in an overestimation of haplogroup age, thus falsely extending the demographic history of Europe into the Late Paleolithic rather than the Neolithic era.[119] Greater certainty about chronology may be obtained from studies of ancient DNA (see below), but so far these have been comparatively few.
Whereas Y-DNA and mtDNA haplogroups represent but a small component of a person's DNA pool, autosomal DNA has the advantage of containing hundreds of thousands of examinable genetic loci, thus giving a more complete picture of genetic composition. Descent relationships can only be determined on a statistical basis, because autosomal DNA undergoes recombination. A single chromosome can record a history for each gene. Autosomal studies are much more reliable for showing the relationships between existing populations, but do not offer the possibilities for unravelling their histories in the same way as mtDNA and NRY DNA studies promise, despite their many complications.
Genetic studies operate on numerous assumptions and suffer from methodological limitations, such as selection bias and confounding phenomena like genetic drift, foundation and bottleneck effects cause large errors, particularly in haplogroup studies. No matter how accurate the methodology, conclusions derived from such studies are compiled on the basis of how the author envisages their data fits with established archaeological or linguistic theories.
See also
| Wikimedia Commons has media related to Genetic studies on European populations. |
References
Inline citations
- Paschou, Peristera; Kovacevic, Lejla; Tambets, Kristiina; Ilumäe, Anne-Mai; Kushniarevich, Alena; Yunusbayev, Bayazit; Solnik, Anu; Bego, Tamer; Primorac, Dragan; Skaro, Vedrana; Leskovac, Andreja; Jakovski, Zlatko; Drobnic, Katja; Tolk, Helle-Viivi; Kovacevic, Sandra; Rudan, Pavao; Metspalu, Ene; Marjanovic, Damir (2014). "Standing at the Gateway to Europe - The Genetic Structure of Western Balkan Populations Based on Autosomal and Haploid Markers". PLOS ONE. 9 (8): e105090. Bibcode:2014PLoSO...9j5090K. doi:10.1371/journal.pone.0105090. ISSN 1932-6203. PMC 4141785. PMID 25148043.
- Fleischer, Robert C.; Nelis, Mari; Esko, Tõnu; Mägi, Reedik; Zimprich, Fritz; Zimprich, Alexander; Toncheva, Draga; Karachanak, Sena; Piskáčková, Tereza; Balaščák, Ivan; Peltonen, Leena; Jakkula, Eveliina; Rehnström, Karola; Lathrop, Mark; Heath, Simon; Galan, Pilar; Schreiber, Stefan; Meitinger, Thomas; Pfeufer, Arne; Wichmann, H-Erich; Melegh, Béla; Polgár, Noémi; Toniolo, Daniela; Gasparini, Paolo; D'Adamo, Pio; Klovins, Janis; Nikitina-Zake, Liene; Kučinskas, Vaidutis; Kasnauskienė, Jūratė; Lubinski, Jan; Debniak, Tadeusz; Limborska, Svetlana; Khrunin, Andrey; Estivill, Xavier; Rabionet, Raquel; Marsal, Sara; Julià, Antonio; Antonarakis, Stylianos E.; Deutsch, Samuel; Borel, Christelle; Attar, Homa; Gagnebin, Maryline; Macek, Milan; Krawczak, Michael; Remm, Maido; Metspalu, Andres (2009). "Genetic Structure of Europeans: A View from the North–East". PLOS ONE. 4 (5): e5472. Bibcode:2009PLoSO...4.5472N. doi:10.1371/journal.pone.0005472. ISSN 1932-6203. PMC 2675054. PMID 19424496.
- Seguin-Orlando, Andaine; Korneliussen, Thorfinn S.; Sikora, Martin; Malaspinas, Anna-Sapfo; Manica, Andrea; Moltke, Ida; Albrechtsen, Anders; Ko, Amy; Margaryan, Ashot; Moiseyev, Vyacheslav; Goebel, Ted; Westaway, Michael; Lambert, David; Khartanovich, Valeri; Wall, Jeffrey D.; Nigst, Philip R.; Foley, Robert A.; Lahr, Marta Mirazon; Nielsen, Rasmus; Orlando, Ludovic; Willerslev, Eske (2014). "Genomic structure in Europeans dating back at least 36,200 years". Science. 346 (6213): 1113–1118. Bibcode:2014Sci...346.1113S. doi:10.1126/science.aaa0114. ISSN 0036-8075. PMID 25378462. S2CID 206632421.
- Posth C, Renaud G, Mittnik M, Drucker DG, Rougier H, Cupillard C, Valentin F, Thevenet C, Furtwängler A, Wißing C, Francken M, Malina M, Bolus M, Lari M, Gigli E, Capecchi G, Crevecoeur I, Beauval C, Flas D, Germonpré M, van der Plicht J, Cottiaux R, Gély B, Ronchitelli A, Wehrberger K, Grigorescu D, Svoboda J, Semal P, Caramelli D, Bocherens H, Harvati K, Conard NJ, Haak W, Powell A, Krause J (2016). "Pleistocene Mitochondrial Genomes Suggest a Single Major Dispersal of Non-Africans and a Late Glacial Population Turnover in Europe". Current Biology. 26 (6): 827–833. doi:10.1016/j.cub.2016.01.037. hdl:2440/114930. PMID 26853362. S2CID 140098861.
- Vai S, Sarno S, Lari M, Luiselli D, Manzi G, Gallinaro M, Mataich S, Hübner A, Modi A, Pilli E, Tafuri MA, Caramelli D, di Lernia S (March 2019). "Ancestral mitochondrial N lineage from the Neolithic 'green' Sahara". Sci Rep. 9 (1): 3530. Bibcode:2019NatSR...9.3530V. doi:10.1038/s41598-019-39802-1. PMC 6401177. PMID 30837540.
- Haber M, Jones AL, Connel BA, Asan, Arciero E, Huanming Y, Thomas MG, Xue Y, Tyler-Smith C (June 2019). "A Rare Deep-Rooting D0 African Y-chromosomal Haplogroup and its Implications for the Expansion of Modern Humans Out of Africa". Genetics. 212 (4): 1421–1428. doi:10.1534/genetics.119.302368. PMC 6707464. PMID 31196864.
- Villanea & Schraibner (2019). "Multiple episodes of interbreeding between Neanderthal and modern humans". Nature Ecology & Evolution. 3 (1): 39–44. doi:10.1038/s41559-018-0735-8. PMC 6309227. PMID 30478305.
- Beleza, Sandra; Santos, António M.; McEvoy, Brian; Alves, Isabel; Martinho, Cláudia; Cameron, Emily; Shriver, Mark D.; Parra, Esteban J.; Rocha, Jorge (2013). "The Timing of Pigmentation Lightening in Europeans". Molecular Biology and Evolution. 30 (1): 24–35. doi:10.1093/molbev/mss207. PMC 3525146. PMID 22923467.
- Jones, Eppie R.; Gonzalez-Fortes, Gloria; Connell, Sarah; Siska, Veronika; Eriksson, Anders; Martiniano, Rui; McLaughlin, Russell L.; Gallego Llorente, Marcos; Cassidy, Lara M.; Gamba, Cristina; Meshveliani, Tengiz; Bar-Yosef, Ofer; Müller, Werner; Belfer-Cohen, Anna; Matskevich, Zinovi; Jakeli, Nino; Higham, Thomas F. G.; Currat, Mathias; Lordkipanidze, David; Hofreiter, Michael; Manica, Andrea; Pinhasi, Ron; Bradley, Daniel G. (2015). "Upper Palaeolithic genomes reveal deep roots of modern Eurasians". Nature Communications. 6 (1): 8912. Bibcode:2015NatCo...6.8912J. doi:10.1038/ncomms9912. ISSN 2041-1723. PMC 4660371. PMID 26567969.
- Population replacement in the Neolithic, and again in the Bronze Age, was nearly complete in Prehistoric Britain, the Mesolithic WHG population accounting for just about 10% of the ancestry of the modern indigenous British population. Olalde, Iñigo; Brace, Selina; Allentoft, Morten E.; Armit, Ian; Kristiansen, Kristian; Booth, Thomas; Rohland, Nadin; Mallick, Swapan; Szécsényi-Nagy, Anna; Mittnik, Alissa; Altena, Eveline; Lipson, Mark; Lazaridis, Iosif; Harper, Thomas K.; Patterson, Nick; Broomandkhoshbacht, Nasreen; Diekmann, Yoan; Faltyskova, Zuzana; Fernandes, Daniel; Ferry, Matthew; Harney, Eadaoin; de Knijff, Peter; Michel, Megan; Oppenheimer, Jonas; Stewardson, Kristin; Barclay, Alistair; Alt, Kurt Werner; Liesau, Corina; Ríos, Patricia; et al. (2018). "The Beaker phenomenon and the genomic transformation of northwest Europe". Nature. 555 (7695): 190–196. Bibcode:2018Natur.555..190O. doi:10.1038/nature25738. ISSN 0028-0836. PMC 5973796. PMID 29466337.
- Lazaridis, Iosif; Patterson, Nick; Mittnik, Alissa; Renaud, Gabriel; Mallick, Swapan; Kirsanow, Karola; Sudmant, Peter H.; Schraiber, Joshua G.; Castellano, Sergi; Lipson, Mark; Berger, Bonnie; Economou, Christos; Bollongino, Ruth; Fu, Qiaomei; Bos, Kirsten I.; Nordenfelt, Susanne; Li, Heng; de Filippo, Cesare; Prüfer, Kay; Sawyer, Susanna; Posth, Cosimo; Haak, Wolfgang; Hallgren, Fredrik; Fornander, Elin; Rohland, Nadin; Delsate, Dominique; Francken, Michael; Guinet, Jean-Michel; Wahl, Joachim; et al. (2014). "Ancient human genomes suggest three ancestral populations for present-day Europeans". Nature. 513 (7518): 409–413. arXiv:1312.6639. Bibcode:2014Natur.513..409L. doi:10.1038/nature13673. ISSN 0028-0836. PMC 4170574. PMID 25230663.
- Since Lazaridis et al. (2014), further studies have refined the picture of interbreeding between EEF and WHG. In a 2017 analysis of 180 ancient DNA datasets of the Chalcolithic and Neolithic periods from Hungary, Germany and Spain evidence was found of a prolonged period of EEF-WHG interbreeding. Admixture took place regionally, from local hunter-gatherer populations, so that populations from the three regions (Germany, Iberia and Hungary) were genetically distinguishable at all stages of the Neolithic period, with a gradually increasing ratio of WHG ancestry of farming populations over time. This suggests that after the initial expansion of early farmers, there were no further long-range migrations substantial enough to homogenize the farming population, and that farming and hunter-gatherer populations existed side by side for many centuries, with ongoing gradual admixture throughout the 5th to 4th millennia BCE (rather than a single admixture event on initial contact). Lipson, Mark; Szécsényi-Nagy, Anna; Mallick, Swapan; Pósa, Annamária; Stégmár, Balázs; Keerl, Victoria; Rohland, Nadin; Stewardson, Kristin; Ferry, Matthew; Michel, Megan; Oppenheimer, Jonas; Broomandkhoshbacht, Nasreen; Harney, Eadaoin; Nordenfelt, Susanne; Llamas, Bastien; Gusztáv Mende, Balázs; Köhler, Kitti; Oross, Krisztián; Bondár, Mária; Marton, Tibor; Osztás, Anett; Jakucs, János; Paluch, Tibor; Horváth, Ferenc; Csengeri, Piroska; Koós, Judit; Sebők, Katalin; Anders, Alexandra; Raczky, Pál; Regenye, Judit; Barna, Judit P.; Fábián, Szilvia; Serlegi, Gábor; Toldi, Zoltán; Gyöngyvér Nagy, Emese; Dani, János; Molnár, Erika; Pálfi, György; Márk, László; Melegh, Béla; Bánfai, Zsolt; Domboróczki, László; Fernández-Eraso, Javier; Antonio Mujika-Alustiza, José; Alonso Fernández, Carmen; Jiménez Echevarría, Javier; Bollongino, Ruth; Orschiedt, Jörg; Schierhold, Kerstin; Meller, Harald; Cooper, Alan; Burger, Joachim; Bánffy, Eszter; Alt, Kurt W.; Lalueza-Fox, Carles; Haak, Wolfgang; Reich, David (2017). "Parallel palaeogenomic transects reveal complex genetic history of early European farmers". Nature. 551 (7680): 368–372. Bibcode:2017Natur.551..368L. doi:10.1038/nature24476. ISSN 0028-0836. PMC 5973800. PMID 29144465.
- "There's no such thing as a 'pure' European—or anyone else". Science | AAAS. May 15, 2017.
- Andrew Curry (2019). "Genetic testing reveals that Europe is a melting pot, made of immigrants". National Geographic.
- Lipson et al. (2017), Fig 2.
- Dutchen, Stephanie (November 23, 2015). "Farming's in Their DNA". Harvard Medical School. Retrieved 25 November 2015.
- Fu, Qiaomei; Posth, Cosimo (May 2, 2016). "The genetic history of Ice Age Europe". Nature. 534 (7606): 200–05. Bibcode:2016Natur.534..200F. doi:10.1038/nature17993. PMC 4943878. PMID 27135931.
- Richards et al. 2000
- Even before the advent of genetic studies, some anthropologists believed they had discovered skeletons representing Neanderthal-modern human 'hybrids'. These results were deemed 'ambiguous'. Archaeological evidence points to an abrupt change from Neanderthal artefacts to those related to AMH during the Upper Palaeolithic.Klein RG (March 2003), "Paleoanthropology. Whither the Neanderthals?", Science, 299 (5612): 1525–27, doi:10.1126/science.1082025, PMID 12624250, S2CID 161836323
- Prüfer, K.; Racimo, F.; Patterson, N.; Jay, F.; Sankararaman, S.; Sawyer, S.; et al. (2014) [Online 2013]. "The complete genome sequence of a Neanderthal from the Altai Mountains". Nature. 505 (7481): 43–49. Bibcode:2014Natur.505...43P. doi:10.1038/nature12886. PMC 4031459. PMID 24352235.
- J. Hardy; A. Pittman; A. Myers; K. Gwinn-Hardy; H.C. Fung; R. de Silva; M. Hutton; J. Duckworth (2005), "Evidence suggesting that Homo neanderthalensis contributed the H2 MAPT haplotype to Homo sapiens", Biochemical Society Transactions, 33 (4): 582–85, doi:10.1042/bst0330582, PMID 16042549,
We suggest that the H2 haplotype is derived from Homo neanderthalensis and entered H. sapiens populations during the coexistence of these species in Europe from approx. 45 000 to 18 000 years ago and that the H2 haplotype has been under selection pressure since that time, possibly because of the role of this H1 haplotype in neurodegenerative disease."..."The tau (MAPT ) locus is very unusual. Over a region of approx. 1.8 Mb, there are two haplotype clades in European populations, H1 and H2 [6,7]. In other populations, only the H1 occurs and shows a normal pattern of recombination
- Shaw-Smith, C; Pittman, Am; Willatt, L; Martin, H; Rickman, L; Gribble, S; Curley, R; Cumming, S; Dunn, C; Kalaitzopoulos, D; Porter, K; Prigmore, E; Krepischi-Santos, AC; Varela, MC; Koiffmann, CP; Lees, AJ; Rosenberg, C; Firth, Hv; De Silva, R; Carter, NP (September 2006), "Microdeletion encompassing MAPT at chromosome 17q21.3 is associated with developmental delay and learning disability", Nature Genetics, 38 (9): 1032–37, doi:10.1038/ng1858, ISSN 1061-4036, PMID 16906163, S2CID 38047848
- Zody, Mc; Jiang, Z; Fung, Hc; Antonacci, F; Hillier, Lw; Cardone, Mf; Graves, Ta; Kidd, Jm; Cheng, Z; Abouelleil, A; Chen, L; Wallis, J; Glasscock, J; Wilson, RK; Reily, Ad; Duckworth, J; Ventura, M; Hardy, J; Warren, WC; Eichler, EE (August 2008), "Evolutionary toggling of the MAPT 17q21.31 inversion region", Nature Genetics, 40 (9): 1076–83, doi:10.1038/ng.193, ISSN 1061-4036, PMC 2684794, PMID 19165922
- Introgression and microcephalin FAQ John Hawks
- Almos, Pz; Horváth, S; Czibula, A; Raskó, I; Sipos, B; Bihari, P; Béres, J; Juhász, A; Janka, Z; Kálmán, J (November 2008), "H1 tau haplotype-related genomic variation at 17q21.3 as an Asian heritage of the European Gypsy population", Heredity, 101 (5): 416–19, doi:10.1038/hdy.2008.70, ISSN 0018-067X, PMID 18648385,
In this study, we examine the frequency of a 900 kb inversion at 17q21.3 in the Gypsy and Caucasian populations of Hungary, which may reflect the Asian origin of Gypsy populations. Of the two haplotypes (H1 and H2), H2 is thought to be exclusively of Caucasian origin, and its occurrence in other racial groups is likely to reflect admixture. In our sample, the H1 haplotype was significantly more frequent in the Gypsy population (89.8 vs 75.5%, P<0.001) and was in Hardy–Weinberg disequilibrium (P=0.017). The 17q21.3 region includes the gene of microtubule-associated protein tau, and this result might imply higher sensitivity to H1 haplotype-related multifactorial tauopathies among Gypsies.
- Wade, Nicholas (2009-12-02), "Scientists in Germany Draft Neanderthal Genome", The New York Times, New York Times, retrieved 2010-05-03
- "Neanderthals 'distinct from us'", BBC, 2009-12-02
- Milisauskas (2002, p. 59)
- Semino 2000
- Semino 2000.
- Wells 2001. Eurasian heartland.
- Tatiana M. Karafet; et al. (2008). "New binary polymorphisms reshape and increase resolution of the human Y chromosomal haplogroup tree". Genome Res. 18 (5): 830–38. doi:10.1101/gr.7172008. PMC 2336805. PMID 18385274.
- Richards et al (2000)
- Torroni A, Bandelt HJ, Macaulay V, et al. (October 2001), "A signal, from human mtDNA, of postglacial recolonization in Europe", Am. J. Hum. Genet., 69 (4): 844–52, doi:10.1086/323485, PMC 1226069, PMID 11517423
- Pala, Maria; Achilli, Alessandro; Olivieri, Anna; Kashani, Baharak Hooshiar; Perego, Ugo A; Sanna, Daria; Metspalu, Ene; Tambets, Kristiina; Tamm, Erika; et al. (2009), "Mitochondrial Haplogroup U5b3: A Distant Echo of the Epipaleolithic in Italy and the Legacy of the Early Sardinians", The American Journal of Human Genetics, 84 (6): 814–21, doi:10.1016/j.ajhg.2009.05.004, PMC 2694970, PMID 19500771, retrieved 2014-12-29
- R Wells et al. The Eurasian Heartland: A continental perspective on Y-chromosome diversity
- Semino et al. (2000)
- Rootsi S, Magri C, Kivisild T, Benuzzi G, Help H, Bermisheva M, Kutuev I, Barać L, Peričić M, et al. (2004), "Phylogeography of Y-Chromosome Haplogroup I Reveals Distinct Domains of Prehistoric Gene Flow in Europe" (PDF), American Journal of Human Genetics, 75 (1): 128–37, doi:10.1086/422196, PMC 1181996, PMID 15162323, archived from the original (PDF) on 2009-06-24, retrieved 2009-07-04.
- Pericic et al. 2005
- Cinnioglu et al. Excavating Y-chromosome haplotype strata in Anatolia. 2003
- Pericic et al (2005) For discussion of eastern European dispersal of R1a1
- Passarino et al (2001) For Scandinavian data
- Semino (2000) general introduction
- Bilton DT, Mirol PM, Mascheretti S, Fredga K, Zima J, Searle JB (July 1998), "Mediterranean Europe as an area of endemism for small mammals rather than a source for northwards postglacial colonization", Proceedings of the Royal Society B, 265 (1402): 1219–26, doi:10.1098/rspb.1998.0423, PMC 1689182, PMID 9699314
- Dutchen, Stephanie (May 2, 2016). "History on Ice". Harvard Medical School. Retrieved 11 May 2016.
- Mathieson, Iain; Lazaridis, Iosif (23 November 2015). "Genome-wide patterns of selection in 230 ancient Eurasians". Nature. 528 (7583): 499–503. Bibcode:2015Natur.528..499M. doi:10.1038/nature16152. PMC 4918750. PMID 26595274.
- Beleza, Sandra; Santos, António M.; McEvoy, Brian; Alves, Isabel; Martinho, Cláudia; Cameron, Emily; Shriver, Mark D.; Parra, Esteban J.; Rocha, Jorge (January 2013). "The Timing of Pigmentation Lightening in Europeans". Molecular Biology and Evolution. 30 (1): 24–35. doi:10.1093/molbev/mss207. PMC 3525146. PMID 22923467.
- Jones, Eppie R.; Gonzalez-Fortes, Gloria; Connell, Sarah; Siska, Veronika; Eriksson, Anders; Martiniano, Rui; McLaughlin, Russell L.; Gallego Llorente, Marcos; Cassidy, Lara M.; Gamba, Cristina; Meshveliani, Tengiz; Bar-Yosef, Ofer; Müller, Werner; Belfer-Cohen, Anna; Matskevich, Zinovi; Jakeli, Nino; Higham, Thomas F. G.; Currat, Mathias; Lordkipanidze, David; Hofreiter, Michael; Manica, Andrea; Pinhasi, Ron; Bradley, Daniel G. (16 November 2015). "Upper Palaeolithic genomes reveal deep roots of modern Eurasians". Nature Communications. 6 (1): 8912. Bibcode:2015NatCo...6.8912J. doi:10.1038/ncomms9912. PMC 4660371. PMID 26567969.
- Bustamante, Carlos D.; Cucca, Francesco (8 May 2014). "Population Genomic Analysis of Ancient and Modern Genomes Yields New Insights into the Genetic Ancestry of the Tyrolean Iceman and the Genetic Structure of Europe". PLOS Genetics. 10 (5): e1004353. doi:10.1371/journal.pgen.1004353. ISSN 1553-7404. PMC 4014435. PMID 24809476.
- Consortium, the Genographic; Cooper, Alan (9 November 2010). "Ancient DNA from European Early Neolithic Farmers Reveals Their Near Eastern Affinities". PLOS Biology. 8 (11): e1000536. doi:10.1371/journal.pbio.1000536. ISSN 1545-7885. PMC 2976717. PMID 21085689.
- Perlès C, Monthel G ( 2001) The Early Neolithic in Greece: The First Farming Communities in Europe. Cambridge University Press, Cambridge.
- Runnels C (2003) The origins of the Greek Neolithic: a personal view, in Ammerman and Biagi (2003 eds).
- Milisauskas (2002, pp. 1143, 1150)
- Zeder MA (2008), "Domestication and early agriculture in the Mediterranean Basin: Origins, diffusion, and impact", PNAS, 105 (33): 11597–604, Bibcode:2008PNAS..10511597Z, doi:10.1073/pnas.0801317105, PMC 2575338, PMID 18697943.
- Milisauskas, 2002 & Geneticists have joined the debate with studies concerning the genetic patterns of modern European populations as they related to the origin of Neolithic populations:146)
- Piazza, Alberto; Cavalli-Sforza, L.L.; Menozzi, Paolo (1994), The history and geography of human genes, Princeton, N.J: Princeton University Press, ISBN 978-0-691-08750-4
- Semino 2000. Here, the clade E-M35 is referred to as "Eu 4".
- Rosser et al. 2000
- Y chromosome data show a signal for a separate late-Pleistocene migration from Africa to Europe via Sinai as evidenced through the distribution of haplogroup E3b lineages, which is not manifested in mtDNA haplogroup distributions.
- Bird, Steven (2007), "Haplogroup E3b1a2 as a Possible Indicator of Settlement in Roman Britain by Soldiers of Balkan Origin", Journal of Genetic Genealogy, 3 (2)
- Haak, W.; Lazaridis, I.; Patterson, N.; Rohland, N.; Mallick, S.; Llamas, B.; Brandt, G.; Nordenfelt, S.; Harney, E.; Stewardson, K.; Fu, Q.; Mittnik, A.; Bánffy, E.; Economou, C.; Francken, M.; Friederich, S.; Pena, R.G.; Hallgren, F.; Khartanovich, V.; Khokhlov, A.; Kunst, M.; Kuznetsov, P.; Meller, H.; Mochalov, O.; Moiseyev, V.; Nicklisch, N.; Pichler, S.L.; Risch, R.; Rojo Guerra, M.A.; et al. (2015). "Massive migration from the steppe was a source for Indo-European languages in Europe". Nature. 522 (7555): 207–11. arXiv:1502.02783. Bibcode:2015Natur.522..207H. doi:10.1038/nature14317. PMC 5048219. PMID 25731166.
- Callaway, Ewen (12 February 2015). "European languages linked to migration from the east". Nature. doi:10.1038/nature.2015.16919. S2CID 184180681.
- Underhill, Peter A; Myres, Natalie M; Rootsi, Siiri; Metspalu, Mait; Zhivotovsky, Lev A; King, Roy J; Lin, Alice A; Chow, Cheryl-Emiliane T; Semino, Ornella; et al. (2009), "Separating the post-Glacial coancestry of European and Asian Y chromosomes within haplogroup R1a", European Journal of Human Genetics, 18 (4): 479–84, doi:10.1038/ejhg.2009.194, PMC 2987245, PMID 19888303
- Max Ingman; Ulf Gyllensten (2007). "A recent genetic link between Sami and the Volga-Ural region of Russia". European Journal of Human Genetics. 15 (1): 115–20. doi:10.1038/sj.ejhg.5201712. PMID 16985502.
- Kalevi Wiik. "Who Are the Finns?" (PDF). Retrieved 2016-03-16. Cite journal requires
|journal=(help) - Mirabal et al. 2009
- S Rootsi; et al. (2006). "A counter-clockwise northern route of the Y-chromosome haplogroup N from Southeast Asia towards Europe". European Journal of Human Genetics. 15 (2): 204–11. doi:10.1038/sj.ejhg.5201748. PMID 17149388., Supplemental table 1
- Eppie R. Jones; Gloria Gonzalez-Fortes; Sarah Connell; Veronika Siska; Anders Eriksson; Rui Martiniano; Russell L. McLaughlin; Marcos Gallego Llorente; Lara M. Cassidy; Cristina Gamba; Tengiz Meshveliani; Ofer Bar-Yosef; Werner Müller; Anna Belfer-Cohen; Zinovi Matskevich; Nino Jakeli; Thomas F.G. Higham; Mathias Currat; David Lordkipanidze; Michael Hofreiter; Andrea Manica; Ron Pinhasi; Daniel G. Bradley (2015). "Upper Palaeolithic genomes reveal deep roots of modern Eurasians". Nature Communications. 6 (8912): 8912. Bibcode:2015NatCo...6.8912J. doi:10.1038/ncomms9912. PMC 4660371. PMID 26567969.
- Dutchen, Stephanie (September 17, 2014). "New Branch Added to European Family Tree". Harvard Medical School. Archived from the original on 2014-10-01. Retrieved 25 November 2015.
- "Mystery ancestral 'tribe' revealed". BBC News. 16 November 2015.
- Iosif Lazaridis; et al. (2016). "The genetic structure of the world's first farmers". bioRxiv 10.1101/059311.
- Iain Mathieson; et al. (2017). "The Genomic History Of Southeastern Europe". bioRxiv 10.1101/135616.
- Busby et al., Current Biology Volume 25, Issue 19, pp. 2518–26, 5 October 2015.
- "Pannonia and Upper Moesia. A History of the Middle Danube Provinces of the Roman Empire. Andras Mocsy. London and Boston, Routledge and Kegan Paul. ISBN 0-7100-7714-9
- Comas, D.; Schmid, H.; Braeuer, S.; Flaiz, C.; Busquets, A.; Calafell, F.; Bertranpetit, J.; Scheil, H.-G.; Huckenbeck, W.; Efremovska, L.; Schmidt, H. (March 2004). "Alu insertion polymorphisms in the Balkans and the origins of the Aromuns". Annals of Human Genetics. 68 (2): 120–127. doi:10.1046/j.1529-8817.2003.00080.x. PMID 15008791. S2CID 21773796.
- Bosch E, Calafell F, González-Neira A, et al. (July 2006), "Paternal and maternal lineages in the Balkans show a homogeneous landscape over linguistic barriers, except for the isolated Aromuns", Annals of Human Genetics, 70 (Pt 4): 459–87, doi:10.1111/j.1469-1809.2005.00251.x, PMID 16759179, S2CID 23156886
- Capelli et al. (2003).
- Semino O, et al. (November 2000), "The genetic legacy of Paleolithic Homo sapiens sapiens in extant Europeans: a Y chromosome perspective", Science, 290 (5494): 1155–59, Bibcode:2000Sci...290.1155S, doi:10.1126/science.290.5494.1155, PMID 11073453 Note: Haplogroup names are different in this article. For example: Haplogroup I is referred as M170
- Mirabal, Sheyla; Varljen, Tatjana; Gayden, Tenzin; Regueiro, Maria; Vujovic, Slavica; Popovic, Danica; Djuric, Marija; Stojkovic, Oliver; Herrera, Rene J. (2010). "Human Y-chromosome short tandem repeats: A tale of acculturation and migrations as mechanisms for the diffusion of agriculture in the Balkan Peninsula". American Journal of Physical Anthropology. 142 (3): 380–90. doi:10.1002/ajpa.21235. PMID 20091845.
- Peričić, Marijana; Lauc, Lovorka Barać; Klarić, Irena Martinović; Rootsi, Siiri; Janićijević, Branka; Rudan, Igor; Terzić, Rifet; Čolak, Ivanka; Kvesić, Ante; Popović, Dan; Šijački, Ana; Behluli, Ibrahim; Đorđević, Dobrivoje; Efremovska, Ljudmila; Bajec, Đorđe D.; Stefanović, Branislav D.; Villems, Richard; Rudan, Pavao (October 2005). "High-Resolution Phylogenetic Analysis of Southeastern Europe Traces Major Episodes of Paternal Gene Flow Among Slavic Populations". Molecular Biology and Evolution. 22 (10): 1964–1975. doi:10.1093/molbev/msi185. PMID 15944443.
- Battaglia, Vincenza; Fornarino, Simona; Al-Zahery, Nadia; Olivieri, Anna; Pala, Maria; Myres, Natalie M; King, Roy J; Rootsi, Siiri; Marjanovic, Damir; et al. (2008), "Y-chromosomal evidence of the cultural diffusion of agriculture in southeast Europe", European Journal of Human Genetics, 17 (6): 820–30, doi:10.1038/ejhg.2008.249, PMC 2947100, PMID 19107149
- Cruciani, Fulvio; La Fratta, Roberta; Santolamazza, Piero; Sellitto, Daniele; Pascone, Roberto; Moral, Pedro; Watson, Elizabeth; Guida, Valentina; Colomb, Eliane Beraud; Zaharova, Boriana; Lavinha, João; Vona, Giuseppe; Aman, Rashid; Calì, Francesco; Akar, Nejat; Richards, Martin; Torroni, Antonio; Novelletto, Andrea; Scozzari, Rosaria (May 2004). "Phylogeographic Analysis of Haplogroup E3b (E-M215) Y Chromosomes Reveals Multiple Migratory Events Within and Out Of Africa". The American Journal of Human Genetics. 74 (5): 1014–1022. doi:10.1086/386294. PMC 1181964. PMID 15042509.
- Balaresque, Patricia; Bowden, Georgina R.; Adams, Susan M.; Leung, Ho-Yee; King, Turi E.; Rosser, Zoë H.; Goodwin, Jane; Moisan, Jean-Paul; Richard, Christelle; Millward, Ann; Demaine, Andrew G.; Barbujani, Guido; Previderè, Carlo; Wilson, Ian J.; Tyler-Smith, Chris; Jobling, Mark A.; Penny, David (19 January 2010). "A Predominantly Neolithic Origin for European Paternal Lineages". PLOS Biology. 8 (1): e1000285. doi:10.1371/journal.pbio.1000285. PMC 2799514. PMID 20087410.
- Myres, Natalie; Rootsi, Siiri; Lin, Alice A; Järve, Mari; King, Roy J; Kutuev, Ildus; Cabrera, Vicente M; Khusnutdinova, Elza K; Pshenichnov, Andrey; Yunusbayev, Bayazit; Balanovsky, Oleg; Balanovska, Elena; Rudan, Pavao; Baldovic, Marian; Herrera, Rene J; Chiaroni, Jacques; Di Cristofaro, Julie; Villems, Richard; Kivisild, Toomas; Underhill, Peter A (2010), "A major Y-chromosome haplogroup R1b Holocene effect in Central and Western Europe", European Journal of Human Genetics, 19 (1): 95–101, doi:10.1038/ejhg.2010.146, PMC 3039512, PMID 20736979
- Cruciani, Fulvio; Trombetta, Beniamino; Antonelli, Cheyenne; Pascone, Roberto; Valesini, Guido; Scalzi, Valentina; Vona, Giuseppe; Melegh, Bela; Zagradisnik, Boris; et al. (2010), "Strong intra- and inter-continental differentiation revealed by Y chromosome SNPs M269, U106 and U152", Forensic Science International: Genetics, 5 (3): e49–e52, doi:10.1016/j.fsigen.2010.07.006, PMID 20732840
- Morelli; Contu, D; Santoni, F; Whalen, M. B.; Francalacci, P; Cucca, F (2010), "A Comparison of Y-Chromosome Variation in Sardinia and Anatolia Is More Consistent with Cultural Rather than Demic Diffusion of Agriculture", PLOS ONE, 5 (4): e10419, Bibcode:2010PLoSO...510419M, doi:10.1371/journal.pone.0010419, PMC 2861676, PMID 20454687
- Kayser, M; Lao, O; Anslinger, K; Augustin, C; Bargel, G; Edelmann, J; Elias, S; Heinrich, M; Henke, J; et al. (2005), "Significant genetic differentiation between Poland and Germany follows contemporary political borders, as revealed by Y-chromosome analysis", Human Genetics, 117 (5): 428–43, doi:10.1007/s00439-005-1333-9, PMID 15959808, S2CID 11066186 A copy can be found here "Significant genetic differentiation between Poland and Germany follows present-day political borders, as revealed by Y-chromosome analysis" (PDF). Archived from the original (PDF) on 2009-03-04. Retrieved 2008-11-02..
- Pericic et al. (2005)
- Bowden et al. (2008)
- Dupuy et al. (2005)
- Kasperaviciūte et al. (2005)
- Semino et al. (2004)
- Rosser et al. (2000)
- Derenko, Miroslava; Malyarchuk, Boris; Denisova, Galina; Perkova, Maria; Rogalla, Urszula; Grzybowski, Tomasz; Khusnutdinova, Elza; Dambueva, Irina; Zakharov, Ilia (2012). "Complete Mitochondrial DNA Analysis of Eastern Eurasian Haplogroups Rarely Found in Populations of Northern Asia and Eastern Europe". PLOS ONE. 7 (2): e32179. Bibcode:2012PLoSO...732179D. doi:10.1371/journal.pone.0032179. PMC 3283723. PMID 22363811.
- Cerezo, María; Achilli, Alessandro; Olivieri, A.; Perego, U.A.; Gomez-Carballa, A.; Brisighelli, F.; Lancioni, H.; Woodward, S.R.; Lopez-Soto, M.; Carracedo, A.; Capelli, C.; Torroni, A.; Salas, A. (2012). "Reconstructing ancient mitochondrial DNA links between Africa and Europe". Genome Research. 22 (5): 821–26. doi:10.1101/gr.134452.111. PMC 3337428. PMID 22454235.
- Cavalli-Sforza (1993)
- Lao et al (2008)
- Cavalli-Sforza (1993, pp. 291–96)
- Cavalli-Sforza, Luca; Menozzi, Paolo; Piazza, Alberto (1994). The History and Geography of Human Genes. Princeton University Press, p. 272
- Cavalli-Sforza (1993, p. 268)
- Genetic Structure of Europeans: A View from the North–East, Nelis et al. 2009
- "Pair-wise Fst between European samples". doi:10.1371/journal.pone.0005472.s003. Cite journal requires
|journal=(help) - Tian, C; Kosoy, R; Nassir, R; et al. (2009). "European population genetic substructure: further definition of ancestry informative markers for distinguishing among diverse European ethnic groups". Mol. Med. 15 (11–12): 371–83. doi:10.2119/molmed.2009.00094. PMC 2730349. PMID 19707526.
- Tian, C; Kosoy, R; Nassir, R; et al. (2009). "European population genetic substructure: further definition of ancestry informative markers for distinguishing among diverse European ethnic groups". Mol. Med. 15 (11–12): 371–83. doi:10.2119/molmed.2009.00094. PMC 2730349. PMID 19707526.
- Seldin, Michael F.; Shigeta, Russell; Villoslada, Pablo; Selmi, Carlo; Tuomilehto, Jaakko; Silva, Gabriel; Belmont, John W.; Klareskog, Lars; Gregersen, Peter K. (2006). "European Population Substructure: Clustering of Northern and Southern Populations". PLOS Genetics. 2 (9): e143. doi:10.1371/journal.pgen.0020143. PMC 1564423. PMID 17044734.
- Bauchet, Marc; McEvoy, Brian; Pearson, Laurel N.; Quillen, Ellen E.; Sarkisian, Tamara; Hovhannesyan, Kristine; Deka, Ranjan; Bradley, Daniel G.; Shriver, Mark D. (May 2007). "Measuring European Population Stratification with Microarray Genotype Data". The American Journal of Human Genetics. 80 (5): 948–956. doi:10.1086/513477. PMC 1852743. PMID 17436249.
- Lao 2008
- Novembre, J; et al. (November 2008), "Genes mirror geography within Europe", Nature, 456 (7218): 98–101, Bibcode:2008Natur.456...98N, doi:10.1038/nature07331, PMC 2735096, PMID 18758442
- Lao, Oscar; Lu, Timothy T.; Nothnagel, Michael; Junge, Olaf; Freitag-Wolf, Sandra; Caliebe, Amke; Balascakova, Miroslava; Bertranpetit, Jaume; Bindoff, Laurence A.; Comas, David; Holmlund, Gunilla; Kouvatsi, Anastasia; Macek, Milan; Mollet, Isabelle; Parson, Walther; Palo, Jukka; Ploski, Rafal; Sajantila, Antti; Tagliabracci, Adriano; Gether, Ulrik; Werge, Thomas; Rivadeneira, Fernando; Hofman, Albert; Uitterlinden, André G.; Gieger, Christian; Wichmann, Heinz-Erich; Rüther, Andreas; Schreiber, Stefan; Becker, Christian; Nürnberg, Peter; Nelson, Matthew R.; Krawczak, Michael; Kayser, Manfred (August 2008). "Correlation between Genetic and Geographic Structure in Europe". Current Biology. 18 (16): 1241–1248. doi:10.1016/j.cub.2008.07.049. PMID 18691889. S2CID 16945780.
- Khrunin, Andrey V.; Khokhrin, Denis V.; Filippova, Irina N.; Esko, Tõnu; Nelis, Mari; Bebyakova, Natalia A.; Bolotova, Natalia L.; Klovins, Janis; Nikitina-Zake, Liene; Rehnström, Karola; Ripatti, Samuli; Schreiber, Stefan; Franke, Andre; Macek, Milan; Krulišová, Veronika; Lubinski, Jan; Metspalu, Andres; Limborska, Svetlana A. (March 7, 2013). "A Genome-Wide Analysis of Populations from European Russia Reveals a New Pole of Genetic Diversity in Northern Europe". PLOS ONE. 8 (3): e58552. Bibcode:2013PLoSO...858552K. doi:10.1371/journal.pone.0058552. PMC 3591355. PMID 23505534.
- Tian, C; Kosoy, R; Nassir, R; et al. (2009). "PubMed Central, Table 1: Mol Med". Mol. Med. 15 (11–12): 371–83. doi:10.2119/molmed.2009.00094. PMC 2730349. PMID 19707526.
- Nelis, Mari; Esko, Tõnu; Mägi, Reedik; Zimprich, Fritz; Zimprich, Alexander; Toncheva, Draga; Karachanak, Sena; Piskáčková, Tereza; Balaščák, Ivan; Peltonen, Leena; Jakkula, Eveliina; Rehnström, Karola; Lathrop, Mark; Heath, Simon; Galan, Pilar; Schreiber, Stefan; Meitinger, Thomas; Pfeufer, Arne; Wichmann, H-Erich; Melegh, Béla; Polgár, Noémi; Toniolo, Daniela; Gasparini, Paolo; D'Adamo, Pio; Klovins, Janis; Nikitina-Zake, Liene; Kučinskas, Vaidutis; Kasnauskienė, Jūratė; Lubinski, Jan; Debniak, Tadeusz; Limborska, Svetlana; Khrunin, Andrey; Estivill, Xavier; Rabionet, Raquel; Marsal, Sara; Julià, Antonio; Antonarakis, Stylianos E.; Deutsch, Samuel; Borel, Christelle; Attar, Homa; Gagnebin, Maryline; Macek, Milan; Krawczak, Michael; Remm, Maido; Metspalu, Andres; Fleischer, Robert C. (8 May 2009). "Genetic Structure of Europeans: A View from the North–East". PLOS ONE. 4 (5): e5472. Bibcode:2009PLoSO...4.5472N. doi:10.1371/journal.pone.0005472. PMC 2675054. PMID 19424496.
- Nelis, M; Esko, T; Mägi, R; Zimprich, F; Zimprich, A; Toncheva, D; Karachanak, S; Piskácková, T; Balascák, I; Peltonen, L; Jakkula, E; Rehnström, K; Lathrop, M; Heath, S; Galan, P; Schreiber, S; Meitinger, T; Pfeufer, A; Wichmann, H.E.; Melegh, B; Polgár, N; Toniolo, D; Gasparini, P; d'Adamo, P; Klovins, J; Nikitina-Zake, L; Kucinskas, V; Kasnauskiene, J; Lubinski, J; et al. (2009), "European Population Genetic Substructure: Further Definition of Ancestry Informative Markers for Distinguishing among Diverse European Ethnic Groups", PLOS ONE, 4 (5): e5472, table 2, Bibcode:2009PLoSO...4.5472N, doi:10.1371/journal.pone.0005472, PMC 2675054, PMID 19424496
- Cavalli-Sforza (1993, p. 51)
- Cavalli-Sforza (1993, p. 39)
- Arredi, Poloni & Tyler-Smith (2007, p. 390)
- Milisauskas (2002, p. 58)
- Semino (2000)
- Barbujani & Bertorelle (2001:22–25)
Sources referenced
- Adams, Susan M.; Bosch, Elena; Balaresque, Patricia L.; Ballereau, StéPhane J.; Lee, Andrew C.; Arroyo, Eduardo; López-Parra, Ana M.; Aler, Mercedes; Grifo, Marina S. Gisbert; et al. (2008), "The Genetic Legacy of Religious Diversity and Intolerance: Paternal Lineages of Christians, Jews, and Muslims in the Iberian Peninsula", The American Journal of Human Genetics, 83 (6): 725–36, doi:10.1016/j.ajhg.2008.11.007, PMC 2668061, PMID 19061982, retrieved 2009-07-22
- Arredi B, Poloni ES, Paracchini S, et al. (August 2004), "A predominantly neolithic origin for Y-chromosomal DNA variation in North Africa", The American Journal of Human Genetics, 75 (2): 338–45, doi:10.1086/423147, PMC 1216069, PMID 15202071
- Arredi, B; Poloni, E; Tyler-Smith, C (2007), "The Peopling of Europe", Anthropological Genetics: Theory, Methods and Applications, Cambridge University Press, ISBN 978-0-521-54697-3
- Auton, A; Bryc, K; Boyko, AR; Lohmueller, KE; Novembre, J; Reynolds, A; Indap, A; Wright, MH; Degenhardt, JD; et al. (2009), "Global distribution of genomic diversity underscores rich complex history of continental human populations", Genome Research, 19 (5): 795–803, doi:10.1101/gr.088898.108, PMC 2675968, PMID 19218534
- Barbujani, Guido; Bertorelle, Giorgio (2001), "Genetics and the Population History of Europe", PNAS, 98 (1): 22–25, Bibcode:2001PNAS...98...22B, doi:10.1073/pnas.98.1.22, PMC 33353, PMID 11136246
- Battaglia, Vincenza; Fornarino, Simona; Al-Zahery, Nadia; Olivieri, Anna; Pala, Maria; Myres, Natalie M; King, Roy J; Rootsi, Siiri; Marjanovic, Damir; et al. (2008), "Y-chromosomal evidence of the cultural diffusion of agriculture in southeast Europe", European Journal of Human Genetics, 17 (6): 820–30, doi:10.1038/ejhg.2008.249, PMC 2947100, PMID 19107149
- Bauchet, Marc; McEvoy, Brian; Pearson, L.N.; Quillen, E.E.; Sarkisian, T; Hovhannesyan, K; Deka, R; Bradley, D.G.; Shriver, M.D. (2007), "Measuring European Population Stratification using Microarray Genotype Data", The American Journal of Human Genetics, 80 (5): 948–56, doi:10.1086/513477, PMC 1852743, PMID 17436249
- Beleza, S; Gusmão, L; Lopes, A; Alves, C; Gomes, I; Giouzeli, M; Calafell, F; Carracedo, A; Amorim, A (2005), "Micro-Phylogeographic and Demographic History of Portuguese Male Lineages", Annals of Human Genetics, 70 (Pt 2): 181–94, doi:10.1111/j.1529-8817.2005.00221.x, PMID 16626329, S2CID 4652154
- Bosch E, Calafell F, Comas D, Oefner PJ, Underhill PA, Bertranpetit J (April 2001), "High-resolution analysis of human Y-chromosome variation shows a sharp discontinuity and limited gene flow between northwestern Africa and the Iberian Peninsula", American Journal of Human Genetics, 68 (4): 1019–29, doi:10.1086/319521, PMC 1275654, PMID 11254456
- Brace, C.L.; et al. (2005), "The questionable contribution of the Neolithic and the Bronze Age to European craniofacial form", Proceedings of the National Academy of Sciences, 103 (1): 242–47, Bibcode:2006PNAS..103..242B, doi:10.1073/pnas.0509801102, PMC 1325007, PMID 16371462
- Capelli, C; Redhead, N; Abernethy, JK; Gratrix, F; Wilson, JF; Moen, T; Hervig, T; Richards, M; Stumpf, MP; et al. (2003), "A Y Chromosome Census of the British Isles", Current Biology, 13 (11): 979–84, doi:10.1016/S0960-9822(03)00373-7, PMID 12781138 also at "030705U491" (PDF). Retrieved 2011-06-01. Cite journal requires
|journal=(help) - Capelli, Cristian; Onofri, Valerio; Brisighelli, Francesca; Boschi, Ilaria; Scarnicci, Francesca; Masullo, Mara; Ferri, Gianmarco; Tofanelli, Sergio; Tagliabracci, Adriano; et al. (2009), "Moors and Saracens in Europe: estimating the medieval North African male legacy in southern Europe", European Journal of Human Genetics, 17 (6): 848–52, doi:10.1038/ejhg.2008.258, PMC 2947089, PMID 19156170
- Cavalli-Sforza, Luigi L.; Menozzi, Paolo; Piazza, Alberto (1993), The History and Geography of Human Genes, Princeton University Press, ISBN 978-0-691-08750-4, retrieved 2009-07-22
- Cavalli-Sforza, Luigi L. (1997), "Genes, Peoples and Languages", PNAS, 94 (15): 7719–24, Bibcode:1997PNAS...94.7719C, doi:10.1073/pnas.94.15.7719, PMC 33682, PMID 9223254
- Cruciani, F; Santolamazza, P; Shen, P; MacAulay, V; Moral, P; Olckers, A; Modiano, D; Holmes, S; Destro-Bisol, G; et al. (2002), "A Back Migration from Asia to Sub-Saharan Africa Is Supported by High-Resolution Analysis of Human Y-Chromosome Haplotypes", American Journal of Human Genetics, 70 (5): 1197–214, doi:10.1086/340257, PMC 447595, PMID 11910562
- Cruciani F, La Fratta R, Santolamazza P, et al. (May 2004), "Phylogeographic analysis of haplogroup E3b (E-M215) y chromosomes reveals multiple migratory events within and out of Africa", American Journal of Human Genetics, 74 (5): 1014–22, doi:10.1086/386294, PMC 1181964, PMID 15042509
- Cruciani, Fulvio; et al. (2006), "Molecular Dissection of the Y Chromosome Haplogroup E-M78 (E3b1a): A Posteriori Evaluation of a Microsatellite-Network-Based Approach Through Six New Biallelic Markers", Human Mutation, 27 (8): 831–32, doi:10.1002/humu.9445, PMID 16835895, S2CID 26886757
- Cruciani, F; La Fratta, R; Trombetta, B; Santolamazza, P; Sellitto, D; Colomb, EB; Dugoujon, JM; Crivellaro, F; Benincasa, T; et al. (2007), "Tracing Past Human Male Movements in Northern/Eastern Africa and Western Eurasia: New Clues from Y-Chromosomal Haplogroups E-M78 and J-M12", Molecular Biology and Evolution, 24 (6): 1300–11, doi:10.1093/molbev/msm049, PMID 17351267, retrieved 2009-07-22 Also see Supplementary Data.
- Di Gaetano; et al. (2008), "Differential Greek and northern African migrations to Sicily are supported by genetic evidence from the Y chromosome", European Journal of Human Genetics, 17 (1): 91–99, doi:10.1038/ejhg.2008.120, PMC 2985948, PMID 18685561
- Flores, Carlos; Maca-Meyer, N; González, AM; Oefner, PJ; Shen, P; Pérez, JA; Rojas, A; Larruga, JM; Underhill, PA (2004), "Reduced genetic structure of the Iberian peninsula revealed by Y-chromosome analysis: implications for population demography" (PDF), European Journal of Human Genetics, 12 (10): 855–63, doi:10.1038/sj.ejhg.5201225, PMID 15280900, S2CID 16765118, archived from the original (PDF) on 2008-04-06, retrieved 2009-07-22
- Francalacci, P.; Morelli, L.; Underhill, P.A.; Lillie, A.S.; Passarino, G.; Useli, A.; Madeddu, R.; Paoli, G.; Tofanelli, S.; et al. (2003), "Peopling of Three Mediterranean Islands (Corsica, Sardinia, and Sicily) Inferred by Y-Chromosome Biallelic Variability", American Journal of Physical Anthropology, 121 (3): 270–79, doi:10.1002/ajpa.10265, PMID 12772214
- Gonçalves, R; Freitas, A; Branco, M; Rosa, A; Fernandes, AT; Zhivotovsky, LA; Underhill, PA; Kivisild, T; Brehm, A (2005), "Y-chromosome Lineages from Portugal, Madeira and Açores Record Elements of Sephardim and Berber Ancestry", Annals of Human Genetics, 69 (Pt 4): 443–54, doi:10.1111/j.1529-8817.2005.00161.x, PMID 15996172, S2CID 3229760
- Halder, I; et al. (2007), "A panel of ancestry informative markers for estimating individual biogeographical ancestry and admixture from four continents: utility and applications", Human Mutation, 29 (5): 648–58, doi:10.1002/humu.20695, PMID 18286470, S2CID 12489449, archived from the original on 2012-10-16
- King and Underhill (2002), "Congruent distribution of Neolithic painted pottery and ceramic figurines with Y-chromosome lineages", Antiquity, 76 (293): 707–14, doi:10.1017/s0003598x00091158
- Lao, O; Lu, TT; Nothnagel, M; Junge, O; Freitag-Wolf, S; Caliebe, A; Balascakova, M; Bertranpetit, J; Bindoff, LA; et al. (August 2008), "Correlation between genetic and geographic structure in Europe", Current Biology, 18 (16): 1241–48, doi:10.1016/j.cub.2008.07.049, PMID 18691889, S2CID 16945780
- Passarino, Giuseppe; et al. (2001), "The 49a,f haplotype 11 is a new marker of the EU19 lineage that traces migrations from northern regions of the black sea", Hum. Immunol., 62 (9), pp. 922–32, doi:10.1016/S0198-8859(01)00291-9, PMID 11543894.
- Pericic, M; Lauc, LB; Klarić, IM; Rootsi, S; Janićijevic, B; Rudan, I; Terzić, R; Colak, I; Kvesić, A; et al. (October 2005), "High-resolution phylogenetic analysis of southeastern Europe traces major episodes of paternal gene flow among Slavic populations", Mol. Biol. Evol., 22 (10): 1964–75, doi:10.1093/molbev/msi185, PMID 15944443, retrieved 2009-07-22
- Milisauskas, Sarunas (2002), European Prehistory: a survey, Birkhauser, ISBN 978-0-306-46793-6
- Ricaut, F.X.; et al. (2008), "Cranial Discrete Traits in a Byzantine Population and Eastern Mediterranean Population Movements", Human Biology, 80 (5): 535–64, doi:10.3378/1534-6617-80.5.535, PMID 19341322, S2CID 25142338
- Richards, M; MacAulay, V; Hickey, E; Vega, E; Sykes, B; Guida, V; Rengo, C; Sellitto, D; Cruciani, F; et al. (November 2000), "Tracing European founder lineages in the Near Eastern mtDNA pool", American Journal of Human Genetics, 67 (5): 1251–76, doi:10.1016/S0002-9297(07)62954-1, PMC 1288566, PMID 11032788
- Rosser, ZH; Zerjal, T; Hurles, ME; Adojaan, M; Alavantic, D; Amorim, A; Amos, W; Armenteros, M; Arroyo, E; et al. (2000), "Y-Chromosomal Diversity in Europe Is Clinal and Influenced Primarily by Geography, Rather than by Language", American Journal of Human Genetics, 67 (6): 1526–43, doi:10.1086/316890, PMC 1287948, PMID 11078479, archived from the original on 2008-05-06
- Scozzari, Rosaria; Cruciani, F; Pangrazio, A; Santolamazza, P; Vona, G; Moral, P; Latini, V; Varesi, L; Memmi, MM; et al. (2001), "Human Y-Chromosome Variation in the Western Mediterranean Area: Implications for the Peopling of the Region" (PDF), Human Immunology, 62 (9): 871–84, CiteSeerX 10.1.1.408.4857, doi:10.1016/S0198-8859(01)00286-5, PMID 11543889, retrieved 2009-07-22
- Semino, Ornella; Passarino, G; Oefner, PJ; Lin, AA; Arbuzova, S; Beckman, LE; De Benedictis, G; Francalacci, P; Kouvatsi, A; et al. (November 2000), "The genetic legacy of Paleolithic Homo sapiens sapiens in extant Europeans: a Y chromosome perspective" (PDF), Science, 290 (5494): 1155–59, Bibcode:2000Sci...290.1155S, doi:10.1126/science.290.5494.1155, PMID 11073453, archived from the original (PDF) on 2008-03-07, retrieved 2009-07-22.
- Semino, O; Santachiarabenerecetti, A; Falaschi, F; Cavallisforza, L; Underhill, P (2002), "Ethiopians and Khoisan share the deepest clades of the human Y-chromosome phylogeny" (PDF), Am J Hum Genet, 70 (1), pp. 265–68, doi:10.1086/338306, PMC 384897, PMID 11719903, archived from the original (PDF) on 2006-03-15, retrieved 2009-07-22
- Semino O, Magri C, Benuzzi G, et al. (May 2004), "Origin, diffusion, and differentiation of Y-chromosome haplogroups E and J: inferences on the neolithization of Europe and later migratory events in the Mediterranean area", American Journal of Human Genetics, 74 (5): 1023–34, doi:10.1086/386295, PMC 1181965, PMID 15069642
- Sykes, Bryan (2006), Blood of the Isles: Exploring the Genetic Roots of Our Tribal History, Bantam, ISBN 978-0-593-05652-3, retrieved 2009-07-22
- Underhill, Peter A.; Shen, Peidong; Lin, Alice A.; Jin, Li; Passarino, Giuseppe; Yang, Wei H.; Kauffman, Erin; Bonné-Tamir, Batsheva; Bertranpetit, Jaume; et al. (2000), "Y chromosome sequence variation and the history of human populations", Nat Genet, 26 (3), pp. 358–61, doi:10.1038/81685, PMID 11062480, S2CID 12893406
- Underhill, P.A.; Passarino, G.; Lin, A.A.; Shen, P.; Mirazon Lahr, M.; Foley, R.A.; Oefner, P.J.; Cavalli-Sforza, L.L. (2001), "The phylogeography of Y chromosome binary haplotypes and the origins of modern human populations" (PDF), Ann Hum Genet, 65 (Pt 1), pp. 43–62, doi:10.1046/j.1469-1809.2001.6510043.x, PMID 11415522, S2CID 9441236, archived from the original (PDF) on 2011-07-21, retrieved 2009-07-22
- Underhill (2002), Bellwood and Renfrew (ed.), Inference of Neolithic Population Histories using Y-chromosome Haplotypes, Cambridge: McDonald Institute for Archaeological Research, ISBN 978-1-902937-20-5
- Underhill and Kivisild; Kivisild, T (2007), "Use of Y Chromosome and Mitochondrial DNA Population Structure in Tracing Human Migrations", Annu. Rev. Genet., 41: 539–64, doi:10.1146/annurev.genet.41.110306.130407, PMID 18076332
- Perlès C, Monthel G ( 2001) The Early Neolithic in Greece: The First Farming Communities in Europe. Cambridge University Press, Cambridge.
- Runnels C (2003) The origins of the Greek Neolithic: a personal view, in Ammerman and Biagi (2003 eds).
External links
| Sub-topics | |
|---|---|
| Genetic history by region | |
| Population genetics by group |
|
| |