La Coquille
La Coquille is a commune in the Dordogne department in Nouvelle-Aquitaine in southwestern France.
La Coquille | |
|---|---|
%252Cchurch_and_square.JPG.webp) The church in La Coquille | |
 Coat of arms | |
Location of La Coquille 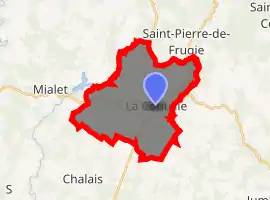
| |
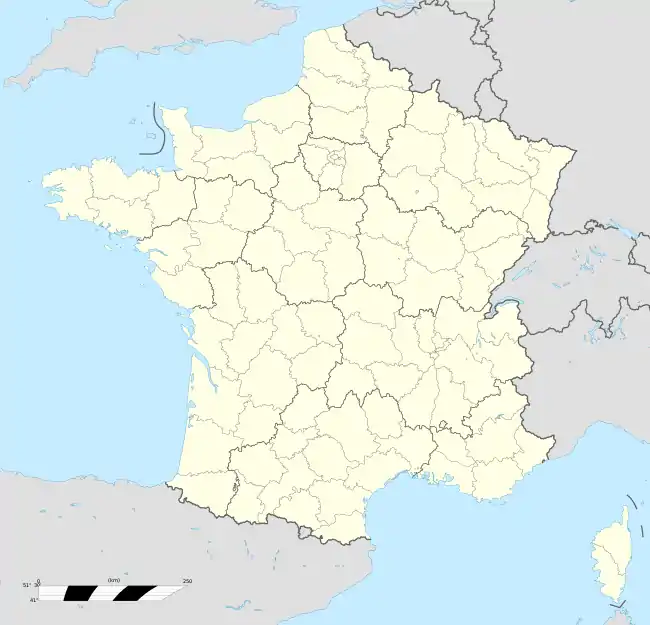 La Coquille 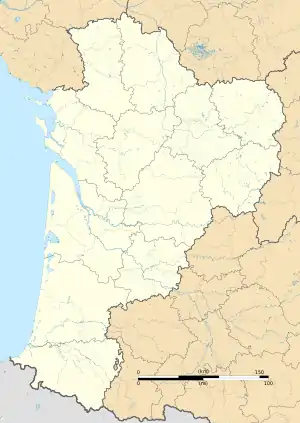 La Coquille | |
| Coordinates: 45°32′36″N 0°58′38″E | |
| Country | France |
| Region | Nouvelle-Aquitaine |
| Department | Dordogne |
| Arrondissement | Nontron |
| Canton | Thiviers |
| Government | |
| • Mayor (2008–2014) | Jean-Pierre Massaloux |
| Area 1 | 22.37 km2 (8.64 sq mi) |
| Population (2017-01-01)[1] | 1,324 |
| • Density | 59/km2 (150/sq mi) |
| Time zone | UTC+01:00 (CET) |
| • Summer (DST) | UTC+02:00 (CEST) |
| INSEE/Postal code | 24133 /24450 |
| Elevation | 259–432 m (850–1,417 ft) |
| 1 French Land Register data, which excludes lakes, ponds, glaciers > 1 km2 (0.386 sq mi or 247 acres) and river estuaries. | |
La Coquille is located in the Périgord in a heavily wooded area with meadows surrounding the peaceful little village. It is near the town of Nontron between Limoges and Périgueux.
La Coquille was on one of the five routes leading to Santiago de Compostela in Spain and it was in this parish that pilgrims were given a coquille Saint-Jacques, a scallop shell symbolic of the Way of St. James, the celebrated pilgrimage to Santiago de Compostela. From this fact came the name of the village of La Coquille.
The church in La Coquille was on the route of Richard the Lionheart, was reinaugurated by him and welcomed him during his journey.
As a community, the name of La Coquille only appeared officially in 1856, replacing the name of Sainte-Marie-de-Frugie.
Geography
The Côle flows south through the northwestern part of the commune.
Population
|
|
See also
References
- "Populations légales 2017". INSEE. Retrieved 6 January 2020.
| Wikimedia Commons has media related to La Coquille. |
| Authority control |
|
|---|