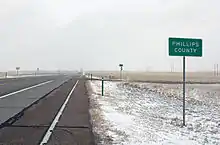
Phillips County, Colorado
Phillips County is one of the 64 counties in the U.S. state of Colorado. As of the 2010 census, the population was 4,442.[1] The county seat is Holyoke.[2] The county was named in honor of R.O. Phillips, a secretary of the Lincoln Land Company, who organized several towns in Colorado.
Phillips County | |
|---|---|
 | |
 Seal | |
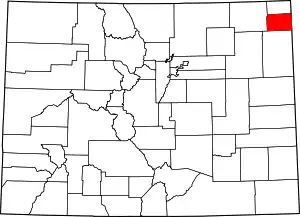 Location within the U.S. state of Colorado | |
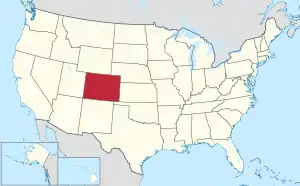 Colorado's location within the U.S. | |
| Coordinates: 40.59°N 102.35°W | |
| Country | |
| State | |
| Founded | March 27, 1889 |
| Named for | R.O. Phillips |
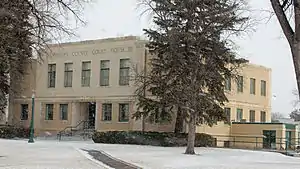
| Seat | Holyoke |
| Largest city | Holyoke |
| Area | |
| • Total | 688 sq mi (1,780 km2) |
| • Land | 688 sq mi (1,780 km2) |
| • Water | 0.1 sq mi (0.3 km2) 0.02%% |
| Population | |
| • Estimate (2019) | 4,265 |
| • Density | 6.5/sq mi (2.5/km2) |
| Time zone | UTC−7 (Mountain) |
| • Summer (DST) | UTC−6 (MDT) |
| Congressional district | 4th |
| Website | www |
Geography
According to the U.S. Census Bureau, the county has a total area of 688 square miles (1,780 km2), of which 688 square miles (1,780 km2) is land and 0.1 square miles (0.26 km2) (0.02%) is water.[3]
Adjacent counties
- Sedgwick County—north
- Perkins County, Nebraska—northeast
- Chase County, Nebraska—east
- Yuma County—south
- Logan County—west
Major Highways
 U.S. Highway 6
 U.S. Highway 385
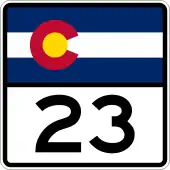 State Highway 23
 State Highway 59
Demographics
| Historical population | |||
|---|---|---|---|
| Census | Pop. | %± | |
| 1890 | 2,642 | — | |
| 1900 | 1,583 | −40.1% | |
| 1910 | 3,179 | 100.8% | |
| 1920 | 5,499 | 73.0% | |
| 1930 | 5,797 | 5.4% | |
| 1940 | 4,948 | −14.6% | |
| 1950 | 4,924 | −0.5% | |
| 1960 | 4,440 | −9.8% | |
| 1970 | 4,131 | −7.0% | |
| 1980 | 4,542 | 9.9% | |
| 1990 | 4,189 | −7.8% | |
| 2000 | 4,480 | 6.9% | |
| 2010 | 4,442 | −0.8% | |
| 2019 (est.) | 4,265 | [4] | −4.0% |
| U.S. Decennial Census[5] 1790–1960[6] 1900–1990[7] 1990–2000[8] 2010–2015[1] | |||
At the 2000 census there were 4,480 people, 1,781 households, and 1,239 families living in the county. The population density was 6 people per square mile (3/km2). There were 2,014 housing units at an average density of 3 per square mile (1/km2). The racial makeup of the county was 93.04% White, 0.20% Black or African American, 0.29% Native American, 0.40% Asian, 0.02% Pacific Islander, 4.71% from other races, and 1.34% from two or more races. 11.76% of the population were Hispanic or Latino of any race.[9] Of the 1,781 households 32.90% had children under the age of 18 living with them, 61.20% were married couples living together, 5.60% had a female householder with no husband present, and 30.40% were non-families. Of all households 27.50% were one person and 14.30% were one person aged 65 or older. The average household size was 2.47 and the average family size was 3.01.
The age distribution was 26.90% under the age of 18, 6.30% from 18 to 24, 25.30% from 25 to 44, 22.20% from 45 to 64, and 19.40% 65 or older. The median age was 40 years. For every 100 females there were 93.40 males. For every 100 females age 18 and over, there were 90.50 males.
The median household income was $32,177 and the median family income was $38,144. Males had a median income of $30,095 versus $18,682 for females. The per capita income for the county was $16,394. About 8.80% of families and 11.60% of the population were below the poverty line, including 14.70% of those under age 18 and 7.20% of those age 65 or over.
Politics
| Year | Republican | Democratic | Others |
|---|---|---|---|
| 2020 | 78.8% 1,958 | 19.6% 486 | 1.7% 41 |
| 2016 | 76.8% 1,791 | 18.7% 436 | 4.5% 105 |
| 2012 | 72.3% 1,637 | 26.0% 588 | 1.8% 40 |
| 2008 | 71.3% 1,613 | 27.5% 622 | 1.2% 26 |
| 2004 | 73.9% 1,717 | 25.0% 582 | 1.1% 26 |
| 2000 | 70.9% 1,573 | 25.4% 564 | 3.7% 83 |
| 1996 | 58.8% 1,284 | 32.3% 706 | 8.9% 195 |
| 1992 | 46.7% 1,075 | 30.1% 692 | 23.3% 536 |
| 1988 | 57.8% 1,317 | 40.5% 923 | 1.7% 38 |
| 1984 | 71.4% 1,689 | 27.5% 651 | 1.1% 27 |
| 1980 | 63.2% 1,488 | 27.2% 640 | 9.6% 226 |
| 1976 | 48.1% 1,142 | 49.4% 1,173 | 2.4% 58 |
| 1972 | 65.3% 1,480 | 30.3% 687 | 4.4% 99 |
| 1968 | 56.9% 1,237 | 33.2% 723 | 9.9% 215 |
| 1964 | 44.8% 1,012 | 55.0% 1,243 | 0.2% 5 |
| 1960 | 62.8% 1,455 | 37.2% 862 | 0.0% 1 |
| 1956 | 63.4% 1,535 | 36.6% 887 | 0.0% 1 |
| 1952 | 67.7% 1,670 | 32.0% 789 | 0.3% 7 |
| 1948 | 52.5% 1,076 | 45.5% 932 | 2.0% 41 |
| 1944 | 65.2% 1,455 | 34.1% 761 | 0.8% 17 |
| 1940 | 54.3% 1,168 | 42.7% 919 | 3.0% 64 |
| 1936 | 36.2% 941 | 61.5% 1,602 | 2.3% 60 |
| 1932 | 34.8% 903 | 56.1% 1,453 | 9.1% 236 |
| 1928 | 65.2% 1,440 | 31.9% 705 | 2.9% 65 |
| 1924 | 49.6% 1,076 | 18.3% 397 | 32.1% 696 |
| 1920 | 66.8% 1,191 | 26.9% 480 | 6.3% 112 |
| 1916 | 38.2% 532 | 57.0% 795 | 4.8% 67 |
| 1912 | 22.4% 266 | 37.7% 448 | 40.0% 475[lower-alpha 1] |
Like all the High Plains, Phillips County is overwhelmingly Republican. It has not been carried by a Democratic presidential nominee since Jimmy Carter in 1976, and Michael Dukakis in 1988 during a major drought has been the only Democrat since to receive over one-third of the county's ballots.
See also
Notes
- The leading "other" candidate, Progressive Theodore Roosevelt, received 393 votes, Socialist Eugene Debs received 46 votes, Prohibition Party candidate Eugene Chafin received 36 votes, and Socialist Labor candidate Arthur Reimer was on the ballot but received zero votes in the county.
References
- "State & County QuickFacts". United States Census Bureau. Archived from the original on June 6, 2011. Retrieved February 11, 2014.
- "Find a County". National Association of Counties. Retrieved 2011-06-07.
- "US Gazetteer files: 2010, 2000, and 1990". United States Census Bureau. 2011-02-12. Retrieved 2011-04-23.
- "Population and Housing Unit Estimates". Retrieved December 12, 2019.
- "U.S. Decennial Census". United States Census Bureau. Retrieved June 10, 2014.
- "Historical Census Browser". University of Virginia Library. Retrieved June 10, 2014.
- "Population of Counties by Decennial Census: 1900 to 1990". United States Census Bureau. Retrieved June 10, 2014.
- "Census 2000 PHC-T-4. Ranking Tables for Counties: 1990 and 2000" (PDF). United States Census Bureau. Retrieved June 10, 2014.
- "U.S. Census website". United States Census Bureau. Retrieved 2011-05-14.
- Leip, David. "Dave Leip's Atlas of U.S. Presidential Elections". uselectionatlas.org. Retrieved May 26, 2017.
External links
- Phillips County Government
- Phillips County Economic Development Corporation website
- Colorado County Evolution by Don Stanwyck
- Colorado Historical Society
Places adjacent to Phillips County, Colorado | ||||||||||
|---|---|---|---|---|---|---|---|---|---|---|
| ||||||||||
Municipalities and communities of Phillips County, Colorado, United States | ||
|---|---|---|
| City | Map of Colorado highlighting Phillips County | |
| Towns | ||
| CDP | ||
| ||
| Authority control |
|---|