Alamosa County, Colorado
Alamosa County is a county located in the U.S. state of Colorado. As of the 2010 census, the population was 15,445.[2] The county seat is Alamosa.[3] The county name is the Spanish language word for a "grove of cottonwood trees."
Alamosa County | |
|---|---|
 Alamosa County Courthouse | |
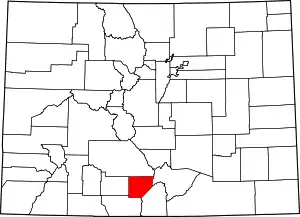 Location within the U.S. state of Colorado | |
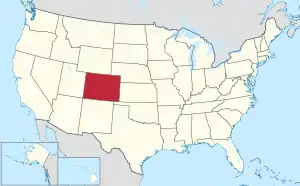 Colorado's location within the U.S. | |
| Coordinates: 37°34′N 105°47′W | |
| Country | |
| State | |
| Founded | March 8, 1913 |
| Named for | Spanish language word for a grove of cottonwood trees |
| Seat | Alamosa |
| Largest city | Alamosa |
| Area | |
| • Total | 723 sq mi (1,870 km2) |
| • Land | 723 sq mi (1,870 km2) |
| • Water | 0.7 sq mi (2 km2) 0.1%% |
| Population (2010) | |
| • Total | 15,445[1] |
| • Density | 21/sq mi (8/km2) |
| Time zone | UTC−7 (Mountain) |
| • Summer (DST) | UTC−6 (MDT) |
| Congressional district | 3rd |
| Website | www |
History
Alamosa County was created by the Colorado legislature on March 8, 1913, out of northwestern Costilla County.
Geography
According to the U.S. Census Bureau, the county has a total area of 723 square miles (1,870 km2), of which 723 square miles (1,870 km2) is land and 0.7 square miles (1.8 km2) (0.1%) is water.[4]
Adjacent counties
- Saguache County, Colorado - north
- Huerfano County, Colorado - east
- Costilla County, Colorado - southeast
- Conejos County, Colorado - southwest
- Rio Grande County, Colorado - west
Major Highways
National protected area
Other protected areas
Scenic trails
- Los Caminos Antiguos Scenic and Historic Byway
- Old Spanish National Historic Trail
Transportation
Alamosa is served by San Luis Valley Regional Airport. The only commercial service is to Denver.
Demographics
| Historical population | |||
|---|---|---|---|
| Census | Pop. | %± | |
| 1920 | 5,148 | — | |
| 1930 | 8,602 | 67.1% | |
| 1940 | 10,484 | 21.9% | |
| 1950 | 10,531 | 0.4% | |
| 1960 | 10,000 | −5.0% | |
| 1970 | 11,422 | 14.2% | |
| 1980 | 11,799 | 3.3% | |
| 1990 | 13,617 | 15.4% | |
| 2000 | 14,966 | 9.9% | |
| 2010 | 15,445 | 3.2% | |
| 2019 (est.) | 16,233 | [5] | 5.1% |
| U.S. Decennial Census[6] 1790-1960[7] 1900-1990[8] 1990-2000[9] 2010-2015[2] | |||
At the 2000 census there were 14,966 people, 5,467 households, and 3,651 families living in the county. The population density was 21 people per square mile (8/km2). There were 6,088 housing units at an average density of 8 per square mile (3/km2). The racial makeup of the county was 71.19% White, 0.97% Black or African American, 2.34% Native American, 0.82% Asian, 0.19% Pacific Islander, 20.34% from other races, and 4.16% from two or more races. 41.41% of the population were Hispanic or Latino of any race.[10] Of the 5,467 households 35.30% had children under the age of 18 living with them, 50.50% were married couples living together, 11.70% had a female householder with no husband present, and 33.20% were non-families. 27.30% of households were one person and 8.70% were one person aged 65 or older. The average household size was 2.56 and the average family size was 3.14.
The age distribution was 27.20% under the age of 18, 15.90% from 18 to 24, 26.70% from 25 to 44, 20.60% from 45 to 64, and 9.60% 65 or older. The median age was 31 years. For every 100 females there were 99.00 males. For every 100 females age 18 and over, there were 95.30 males.
The median household income was $29,447 and the median family income was $38,389. Males had a median income of $27,733 versus $22,806 for females. The per capita income for the county was $15,037. About 15.60% of families and 21.30% of the population were below the poverty line, including 27.40% of those under age 18 and 13.90% of those age 65 or over.
In 2000, the largest denominational groups were Catholics (with 5,716 members) and Evangelical Protestants (with 1,755 members).[11] The largest religious bodies were the Catholic Church (with 5,716 adherents) and The Church of Jesus Christ of Latter-day Saints (with 1,155 adherents).[11]
Politics
| Year | Republican | Democratic | Others |
|---|---|---|---|
| 2020 | 48.8% 3,813 | 48.1% 3,759 | 3.0% 236 |
| 2016 | 43.9% 3,046 | 46.0% 3,189 | 10.2% 704 |
| 2012 | 40.3% 2,705 | 56.8% 3,811 | 3.0% 199 |
| 2008 | 41.9% 2,635 | 56.0% 3,521 | 2.1% 130 |
| 2004 | 50.6% 3,179 | 48.1% 3,017 | 1.3% 83 |
| 2000 | 50.5% 2,857 | 43.4% 2,455 | 6.1% 347 |
| 1996 | 41.2% 2,038 | 47.1% 2,330 | 11.6% 575 |
| 1992 | 34.1% 1,572 | 41.8% 1,928 | 24.2% 1,117 |
| 1988 | 53.7% 2,567 | 44.9% 2,146 | 1.4% 67 |
| 1984 | 62.7% 2,953 | 36.5% 1,720 | 0.8% 38 |
| 1980 | 53.9% 2,601 | 37.7% 1,821 | 8.4% 406 |
| 1976 | 53.5% 2,599 | 42.3% 2,052 | 4.3% 206 |
| 1972 | 62.5% 2,916 | 33.0% 1,540 | 4.5% 209 |
| 1968 | 55.0% 2,277 | 38.0% 1,574 | 7.0% 289 |
| 1964 | 37.4% 1,488 | 62.4% 2,481 | 0.2% 7 |
| 1960 | 55.6% 2,271 | 44.3% 1,811 | 0.1% 4 |
| 1956 | 62.3% 2,442 | 37.4% 1,465 | 0.3% 11 |
| 1952 | 62.1% 2,728 | 37.0% 1,626 | 0.8% 37 |
| 1948 | 44.6% 1,950 | 54.8% 2,395 | 0.7% 29 |
| 1944 | 51.6% 1,933 | 48.2% 1,806 | 0.3% 10 |
| 1940 | 47.4% 2,243 | 52.1% 2,467 | 0.5% 23 |
| 1936 | 29.7% 1,188 | 68.9% 2,754 | 1.4% 57 |
| 1932 | 37.0% 1,306 | 60.6% 2,141 | 2.5% 87 |
| 1928 | 58.2% 1,759 | 41.0% 1,239 | 0.8% 23 |
| 1924 | 40.6% 1,009 | 25.1% 625 | 34.3% 852 |
| 1920 | 51.9% 1,081 | 45.5% 949 | 2.6% 54 |
| 1916 | 26.2% 488 | 70.1% 1,308 | 3.8% 70 |
Alamosa County is a competitive swing county, voting for the winning Presidential candidate in every election since its formation except 1944, 1960, 1976, 2016, and 2020. In the 2016 election, Donald Trump – who captured several previously solidly Democratic counties in southern Colorado – became the first Republican to win the presidency without carrying the county since it was created before the 1916 election. Trump flipped the county in 2020, the only one in Colorado, and one of only fifteen nationally, which he turned from blue to red that year.[lower-alpha 1]
Communities
City
Town
Unincorporated communities
- Alamosa East (a census-designated place)
- Mosca
- Waverly
License plate code
Alamosa County has used the following county codes on Colorado license plates issued to passenger vehicles in the county: XE-XG and EAA-ABD.[13]
See also
Notes
- The other fourteen were Burke County, Georgia; Scotland County, North Carolina; Lorain County, Ohio; Mahoning County, Ohio; Clarendon County, South Carolina; Dillon County, South Carolina; Frio County, Texas; Jim Wells County, Texas; Kenedy County, Texas; Kleberg County, Texas; La Salle County, Texas; Reeves County, Texas; Val Verde County, Texas; and Zapata County, Texas.
References
- "Population and Housing Unit Estimates". U.S. Census Bureau. August 15, 2017. Retrieved August 15, 2017.
- "State & County QuickFacts". United States Census Bureau. Archived from the original on July 13, 2011. Retrieved June 7, 2014.
- "Find a County". National Association of Counties. Archived from the original on May 31, 2011. Retrieved 2011-06-07.
- "US Gazetteer files: 2010, 2000, and 1990". United States Census Bureau. 2011-02-12. Retrieved 2011-04-23.
- "Population and Housing Unit Estimates". Retrieved December 3, 2019.
- "U.S. Decennial Census". United States Census Bureau. Retrieved June 7, 2014.
- "Historical Census Browser". University of Virginia Library. Retrieved June 7, 2014.
- "Population of Counties by Decennial Census: 1900 to 1990". United States Census Bureau. Retrieved June 7, 2014.
- "Census 2000 PHC-T-4. Ranking Tables for Counties: 1990 and 2000" (PDF). United States Census Bureau. Retrieved June 7, 2014.
- "U.S. Census website". United States Census Bureau. Retrieved 2011-05-14.
- "County Membership Reports". thearda.com. Archived from the original on 12 July 2011. Retrieved 2011-08-22.
- "Dave Leip's Atlas of U.S. Presidential Elections". Retrieved 2011-06-11.
- http://www.15q.net/coco.html
External links
- Alamosa County Government website
- Colorado County Evolution by Don Stanwyck
- Colorado Historical Society
Places adjacent to Alamosa County, Colorado | ||||||||||
|---|---|---|---|---|---|---|---|---|---|---|
| ||||||||||
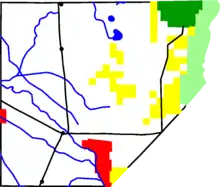
Municipalities and communities of Alamosa County, Colorado, United States | ||
|---|---|---|
| City | Map of Colorado highlighting Alamosa County | |
| Town | ||
| CDP | ||
| Unincorporated communities | ||
| Footnotes | ‡This populated place also has portions in an adjacent county or counties | |
| ||
| Authority control |
|---|