La Plata County, Colorado
La Plata County is one of the 64 counties in the U.S. state of Colorado. As of the 2010 census, the population was 51,334.[1] The county seat is Durango.[2] The county was named for the La Plata River and the La Plata Mountains. "La plata" means "the silver" in Spanish.
La Plata County | |
|---|---|
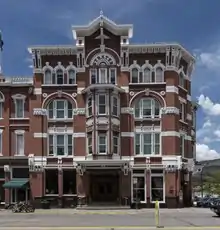 Strater Hotel, opened in 1888 during a mining boom in Durango. | |
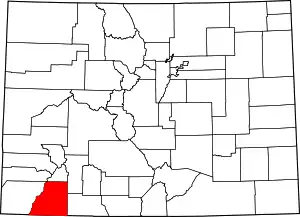 Location within the U.S. state of Colorado | |
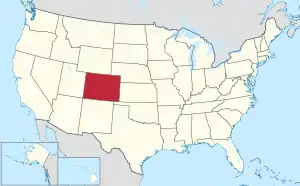 Colorado's location within the U.S. | |
| Coordinates: 37°17′N 107°51′W | |
| Country | |
| State | |
| Founded | February 10, 1874 |
| Named for | Spanish for "the silver" |
| Seat | Durango |
| Largest city | Durango |
| Area | |
| • Total | 1,700 sq mi (4,000 km2) |
| • Land | 1,692 sq mi (4,380 km2) |
| • Water | 7.6 sq mi (20 km2) 0.4%% |
| Population (2010) | |
| • Total | 51,334 |
| • Density | 30/sq mi (10/km2) |
| Time zone | UTC−7 (Mountain) |
| • Summer (DST) | UTC−6 (MDT) |
| Congressional district | 3rd |
| Website | co |
La Plata County comprises the Durango, CO Micropolitan Statistical Area.[3][4]
The county is home to Durango Rock Shelters Archeology Site, the type site for the Basketmaker II period of Anasazi culture.
Geography
According to the U.S. Census Bureau, the county has a total area of 1,700 square miles (4,400 km2), of which 1,692 square miles (4,380 km2) is land and 7.6 square miles (20 km2) (0.4%) is water.[5]
Adjacent counties
- San Juan County - north
- Hinsdale County - northeast
- Archuleta County - east
- San Juan County, New Mexico - south
- Montezuma County - west
- Dolores County - northwest
Major Highways
 U.S. Highway 160
 U.S. Highway 550
 State Highway 140
 State Highway 151
 State Highway 172
Demographics
| Historical population | |||
|---|---|---|---|
| Census | Pop. | %± | |
| 1880 | 1,110 | — | |
| 1890 | 5,509 | 396.3% | |
| 1900 | 7,016 | 27.4% | |
| 1910 | 10,812 | 54.1% | |
| 1920 | 11,218 | 3.8% | |
| 1930 | 12,975 | 15.7% | |
| 1940 | 15,494 | 19.4% | |
| 1950 | 14,880 | −4.0% | |
| 1960 | 19,225 | 29.2% | |
| 1970 | 19,199 | −0.1% | |
| 1980 | 27,424 | 42.8% | |
| 1990 | 32,284 | 17.7% | |
| 2000 | 43,941 | 36.1% | |
| 2010 | 51,334 | 16.8% | |
| 2019 (est.) | 56,221 | [6] | 9.5% |
| U.S. Decennial Census[7] 1790-1960[8] 1900-1990[9] 1990-2000[10] 2010-2015[1] | |||
As of the census[11] of 2000, there were 43,941 people in the county, organized into 17,342 households and 10,890 families. The population density was 26 people per square mile (10/km2). There were 20,765 housing units at an average density of 12 per square mile (5/km2). The racial makeup of the county was 87.31% White, 5.78% Native American, 0.40% Asian, 0.31% Black or African American, 0.05% Pacific Islander, 3.90% from other races, and 2.25% from two or more races. 10.40% of the population were Hispanic or Latino of any race.
There were 17,342 households, out of which 29.60% had children under the age of 18 living with them, 49.90% were married couples living together, 8.70% had a female householder with no husband present, and 37.20% were non-families. 24.80% of all households were made up of individuals, and 6.10% had someone living alone who was 65 years of age or older. The average household size was 2.43 and the average family size was 2.92.
In the county, the population was spread out, with 22.70% under the age of 18, 13.90% from 18 to 24, 29.00% from 25 to 44, 25.10% from 45 to 64, and 9.40% who were 65 years of age or older. The median age was 36 years. For every 100 females there were 103.60 males. For every 100 females age 18 and over, there were 103.10 males.
The median income for a household in the county was $40,159, and the median income for a family was $50,446. Males had a median income of $32,486 versus $24,666 for females. The per capita income for the county was $21,534. 11.70% of the population and 6.70% of families were below the poverty line. Out of the total population, 9.30% of those under the age of 18 and 7.70% of those 65 and older were living below the poverty line.
Communities
City
Census-designated place
Other unincorporated communities
Ghost towns
- Greysill Mines
- La Plata
- Parrott City[12]
Politics
In its early years La Plata County generally leaned towards the Democratic Party. Only Benjamin Harrison in 1888, and the three landslide victories of Theodore Roosevelt, Warren G. Harding and Herbert Hoover saw the county vote Republican before World War II. In the period between 1940 and 1988, however, the county – like Colorado generally – took a turn towards supporting the Republican Party, with the result that between 1940 and 2000 the only Democrat to obtain a majority in the county was Lyndon Johnson in 1964. Since John Kerry became the first candidate in sixteen years from either party to gain a majority in La Plata county in the 2004 election, the county has tended towards the Democratic Party: Barack Obama’s 2008 share of the vote was the highest for a Democrat since Woodrow Wilson's 92 years prior.
| Year | Republican | Democratic | Others |
|---|---|---|---|
| 2020 | 39.9% 14,233 | 57.6% 20,548 | 2.5% 886 |
| 2016 | 40.4% 12,587 | 49.8% 15,525 | 9.8% 3,038 |
| 2012 | 43.7% 12,794 | 52.9% 15,489 | 3.5% 1,025 |
| 2008 | 41.1% 11,503 | 57.4% 16,057 | 1.5% 419 |
| 2004 | 45.9% 11,704 | 52.6% 13,409 | 1.6% 400 |
| 2000 | 48.8% 9,993 | 38.4% 7,864 | 12.9% 2,633 |
| 1996 | 46.5% 8,057 | 37.6% 6,509 | 15.9% 2,755 |
| 1992 | 35.4% 5,522 | 37.9% 5,913 | 26.8% 4,178 |
| 1988 | 57.7% 7,714 | 40.7% 5,443 | 1.5% 205 |
| 1984 | 67.5% 8,719 | 31.3% 4,040 | 1.2% 159 |
| 1980 | 59.8% 7,291 | 24.9% 3,034 | 15.4% 1,876 |
| 1976 | 59.1% 6,228 | 36.4% 3,843 | 4.5% 476 |
| 1972 | 62.2% 5,691 | 31.0% 2,830 | 6.8% 623 |
| 1968 | 57.1% 4,269 | 33.8% 2,523 | 9.2% 684 |
| 1964 | 44.3% 3,550 | 55.5% 4,442 | 0.2% 15 |
| 1960 | 58.8% 4,772 | 41.0% 3,329 | 0.1% 10 |
| 1956 | 66.8% 4,770 | 33.1% 2,366 | 0.1% 4 |
| 1952 | 66.0% 4,425 | 33.0% 2,210 | 1.0% 66 |
| 1948 | 51.0% 2,735 | 47.3% 2,536 | 1.7% 89 |
| 1944 | 59.6% 3,023 | 40.1% 2,031 | 0.3% 15 |
| 1940 | 57.4% 3,871 | 42.0% 2,835 | 0.6% 39 |
| 1936 | 42.2% 2,354 | 54.5% 3,040 | 3.3% 185 |
| 1932 | 38.5% 2,124 | 57.2% 3,156 | 4.3% 237 |
| 1928 | 59.6% 2,837 | 39.3% 1,872 | 1.1% 53 |
| 1924 | 35.1% 1,469 | 36.3% 1,516 | 28.6% 1,197 |
| 1920 | 50.9% 1,711 | 42.9% 1,445 | 6.2% 209 |
| 1916 | 27.1% 1,029 | 68.1% 2,590 | 4.8% 182 |
| 1912 | 19.4% 692 | 49.9% 1,775 | 30.7% 1,093 |
Recreation
National forest and wilderness
National historic district
Bicycle route
Scenic byway
See also
References
- "State & County QuickFacts". United States Census Bureau. Archived from the original on June 6, 2011. Retrieved June 8, 2014.
- "Find a County". National Association of Counties. Retrieved 2011-06-07.
- "OMB Bulletin No. 10-02: Update of Statistical Area Definitions and Guidance on Their Uses" (PDF). United States Office of Management and Budget. December 1, 2009. Archived from the original (PDF) on March 16, 2012. Retrieved April 19, 2012.
- See the Colorado census statistical areas.
- "US Gazetteer files: 2010, 2000, and 1990". United States Census Bureau. 2011-02-12. Retrieved 2011-04-23.
- "Population and Housing Unit Estimates". Retrieved December 12, 2019.
- "U.S. Decennial Census". United States Census Bureau. Retrieved June 8, 2014.
- "Historical Census Browser". University of Virginia Library. Retrieved June 8, 2014.
- "Population of Counties by Decennial Census: 1900 to 1990". United States Census Bureau. Retrieved June 8, 2014.
- "Census 2000 PHC-T-4. Ranking Tables for Counties: 1990 and 2000" (PDF). United States Census Bureau. Retrieved June 8, 2014.
- "U.S. Census website". United States Census Bureau. Retrieved 2011-05-14.
- Parrott
- Leip, David. "Dave Leip's Atlas of U.S. Presidential Elections". uselectionatlas.org. Retrieved May 26, 2017.
External links
- La Plata County Government website
- La Plata County State Register properties
- Colorado County Evolution by Don Stanwyck
- Colorado Historical Society
- La Plata County Central Reservations
- Access Durango, Colorado Community Portal
Places adjacent to La Plata County, Colorado | ||||||||||
|---|---|---|---|---|---|---|---|---|---|---|
| ||||||||||
Municipalities and communities of La Plata County, Colorado, United States | ||
|---|---|---|
| City | Map of Colorado highlighting La Plata County | |
| Towns | ||
| CDPs | ||
| Unincorporated communities | ||
| Indian reservations | ||
| Footnotes | ‡This populated place also has portions in an adjacent county or counties | |
| ||
| Authority control |
|---|