Yuma County, Colorado
Yuma County is one of the 64 counties of the U.S. state of Colorado. As of the 2010 census, the population was 10,043.[1] The county seat is Wray.[2]
Yuma County | |
|---|---|
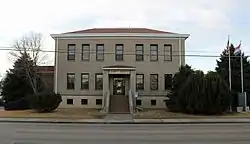 The Yuma County Court-House in Wray. | |
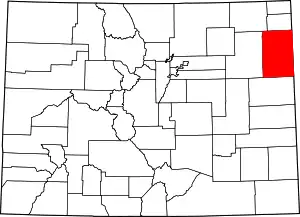 Location within the U.S. state of Colorado | |
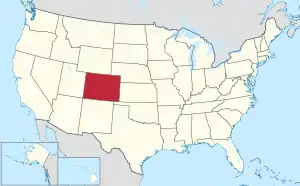 Colorado's location within the U.S. | |
| Coordinates: 40°00′N 102°25′W | |
| Country | |
| State | |
| Founded | March 15, 1889 |
| Seat | Wray |
| Largest city | Yuma |
| Area | |
| • Total | 2,369 sq mi (6,140 km2) |
| • Land | 2,364 sq mi (6,120 km2) |
| • Water | 4.3 sq mi (11 km2) 0.2%% |
| Population | |
| • Estimate (2019) | 10,019 |
| • Density | 4.2/sq mi (1.6/km2) |
| Time zone | UTC−7 (Mountain) |
| • Summer (DST) | UTC−6 (MDT) |
| Congressional district | 4th |
| Website | www |

Geography
According to the U.S. Census Bureau, the county has a total area of 2,369 square miles (6,140 km2), of which 2,364 square miles (6,120 km2) is land and 4.3 square miles (11 km2) (0.2%) is water.[3]
The point where the Arikaree River flows out of Yuma County and into Cheyenne County, Kansas is the lowest point in the State of Colorado at 1,010 meters (3,315 feet) elevation. This crossing point is the highest low point of any U.S. state.[4]
Adjacent counties
- Phillips County (north)
- Chase County, Nebraska (northeast)
- Cheyenne County, Kansas (east/Central Time border)
- Dundy County, Nebraska (east)
- Kit Carson County (south)
- Washington County (west)
- Logan County (northwest)
Major Highways
 U.S. Highway 34
 U.S. Highway 36
 U.S. Highway 385
 State Highway 59
Demographics
| Historical population | |||
|---|---|---|---|
| Census | Pop. | %± | |
| 1890 | 2,596 | — | |
| 1900 | 1,729 | −33.4% | |
| 1910 | 8,499 | 391.6% | |
| 1920 | 13,897 | 63.5% | |
| 1930 | 13,613 | −2.0% | |
| 1940 | 12,102 | −11.1% | |
| 1950 | 10,827 | −10.5% | |
| 1960 | 8,912 | −17.7% | |
| 1970 | 8,544 | −4.1% | |
| 1980 | 9,682 | 13.3% | |
| 1990 | 8,954 | −7.5% | |
| 2000 | 9,841 | 9.9% | |
| 2010 | 10,043 | 2.1% | |
| 2019 (est.) | 10,019 | [5] | −0.2% |
| U.S. Decennial Census[6] 1790-1960[7] 1900-1990[8] 1990-2000[9] 2010-2015[1] | |||
At the 2000 census there were 9,841 people, 3,800 households, and 2,644 families living in the county. The population density was 4 people per square mile (2/km2). There were 4,295 housing units at an average density of 2 per square mile (1/km2). The racial makeup of the county was 94.17% White, 0.11% Black or African American, 0.28% Native American, 0.07% Asian, 0.02% Pacific Islander, 4.14% from other races, and 1.21% from two or more races. 12.88% of the population were Hispanic or Latino of any race.[10] Of the 3,800 households 33.30% had children under the age of 18 living with them, 59.60% were married couples living together, 6.80% had a female householder with no husband present, and 30.40% were non-families. 27.40% of households were one person and 13.30% were one person aged 65 or older. The average household size was 2.55 and the average family size was 3.13.
The age distribution was 28.30% under the age of 18, 7.10% from 18 to 24, 26.00% from 25 to 44, 22.30% from 45 to 64, and 16.30% 65 or older. The median age was 37 years. For every 100 females there were 96.80 males. For every 100 females age 18 and over, there were 94.90 males.
The median household income was $33,169 and the median family income was $39,814. Males had a median income of $26,124 versus $18,578 for females. The per capita income for the county was $16,005. About 8.80% of families and 12.90% of the population were below the poverty line, including 15.50% of those under age 18 and 10.70% of those age 65 or over.
Politics
Yuma County is a Republican Party stronghold in presidential elections. Only five presidential elections from 1912 to the present day have seen the county fail to back the Republican candidate, the most recent being 1964 during Lyndon B. Johnson's statewide & national landslide.
| Year | Republican | Democratic | Others |
|---|---|---|---|
| 2020 | 82.5% 4,107 | 15.8% 785 | 1.8% 89 |
| 2016 | 80.4% 3,850 | 15.2% 726 | 4.5% 215 |
| 2012 | 76.3% 3,490 | 21.6% 987 | 2.2% 100 |
| 2008 | 73.3% 3,286 | 24.9% 1,117 | 1.8% 80 |
| 2004 | 75.8% 3,456 | 23.3% 1,064 | 0.9% 39 |
| 2000 | 72.4% 3,156 | 24.8% 1,082 | 2.8% 120 |
| 1996 | 58.7% 2,589 | 32.6% 1,439 | 8.7% 381 |
| 1992 | 44.8% 2,019 | 28.2% 1,269 | 27.0% 1,217 |
| 1988 | 56.9% 2,513 | 41.6% 1,835 | 1.5% 66 |
| 1984 | 74.3% 3,394 | 24.6% 1,121 | 1.1% 52 |
| 1980 | 68.9% 3,220 | 22.3% 1,043 | 8.8% 411 |
| 1976 | 52.2% 2,350 | 45.0% 2,025 | 2.8% 127 |
| 1972 | 71.0% 2,873 | 26.4% 1,066 | 2.6% 106 |
| 1968 | 62.7% 2,529 | 29.1% 1,175 | 8.2% 331 |
| 1964 | 48.1% 2,007 | 51.4% 2,145 | 0.5% 19 |
| 1960 | 65.2% 2,806 | 34.6% 1,489 | 0.2% 10 |
| 1956 | 64.3% 2,782 | 35.7% 1,544 | 0.1% 3 |
| 1952 | 71.9% 3,404 | 27.3% 1,292 | 0.8% 37 |
| 1948 | 54.1% 2,277 | 45.3% 1,907 | 0.7% 29 |
| 1944 | 67.5% 2,847 | 32.6% 1,374 | 0.0% 0 |
| 1940 | 64.1% 3,531 | 34.8% 1,917 | 1.1% 60 |
| 1936 | 45.3% 2,462 | 52.9% 2,878 | 1.8% 100 |
| 1932 | 37.3% 2,129 | 56.5% 3,220 | 6.2% 352 |
| 1928 | 69.1% 3,401 | 28.1% 1,383 | 2.8% 140 |
| 1924 | 57.9% 2,789 | 18.0% 865 | 24.1% 1,162 |
| 1920 | 63.4% 2,673 | 29.8% 1,254 | 6.8% 288 |
| 1916 | 34.5% 1,436 | 59.3% 2,466 | 6.2% 259 |
| 1912 | 14.4% 466 | 36.2% 1,170 | 49.4% 1,596 |
Communities
Town
Other unincorporated community
Ghost towns
- Abarr
- Alvin
- Arlene
- Armel
- Arnold
- Avoca
- Beecher
- Bolton
- Bryant
- Clarkville
- Condon
- Ford
- Fox
- Friend
- Gurney
- Happyville
- Heartstrong
- Hermes
- Hughes
- Ladlum
- Lansing
- Leslie
- Logan
- Mildred
- Newton
- Robb
- Rogers
- Schramm
- Shields
- Steffens
- Wages
- Wauneta
- Waverly
- Weld City
- Witherbee
See also
References
- "State & County QuickFacts". United States Census Bureau. Retrieved February 11, 2014.
- "Find a County". National Association of Counties. Archived from the original on May 31, 2011. Retrieved 2011-06-07.
- "US Gazetteer files: 2010, 2000, and 1990". United States Census Bureau. 2011-02-12. Retrieved 2011-04-23.
- U.S. Geological Survey. "Elevations and Distances". Retrieved 2006-09-08.
- "Population and Housing Unit Estimates". Retrieved December 12, 2019.
- "U.S. Decennial Census". United States Census Bureau. Retrieved June 11, 2014.
- "Historical Census Browser". University of Virginia Library. Retrieved June 11, 2014.
- "Population of Counties by Decennial Census: 1900 to 1990". United States Census Bureau. Retrieved June 11, 2014.
- "Census 2000 PHC-T-4. Ranking Tables for Counties: 1990 and 2000" (PDF). United States Census Bureau. Retrieved June 11, 2014.
- "U.S. Census website". United States Census Bureau. Retrieved 2011-05-14.
- Leip, David. "Dave Leip's Atlas of U.S. Presidential Elections". uselectionatlas.org. Retrieved May 26, 2017.
External links
- Yuma County Government website
- Yuma County farm photos and documentation, from Historic American Buildings Survey
- Colorado County Evolution by Don Stanwyck
- Colorado Historical Society
Places adjacent to Yuma County, Colorado | ||||||||||
|---|---|---|---|---|---|---|---|---|---|---|
| ||||||||||
Municipalities and communities of Yuma County, Colorado, United States | ||
|---|---|---|
| Cities | Map of Colorado highlighting Yuma County | |
| Town | ||
| CDPs | ||
| Unincorporated communities |
| |
| Ghost towns | ||
| ||
| Authority control |
|---|