Archuleta County, Colorado
Archuleta County is a county located in the U.S. state of Colorado. As of the 2010 census, the population was 12,084.[2] The county seat and the only incorporated municipality in the county is Pagosa Springs.[3]
Archuleta County | |
|---|---|
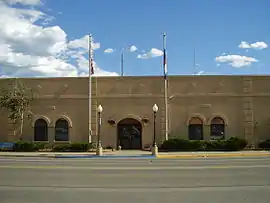
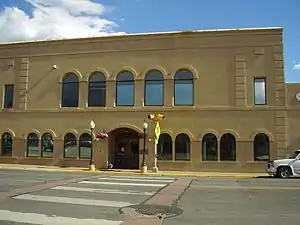 Archuleta County Courthouse | |
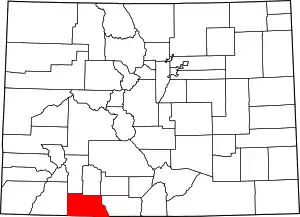 Location within the U.S. state of Colorado | |
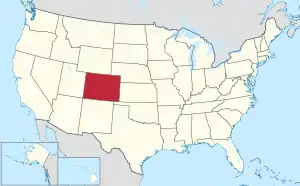 Colorado's location within the U.S. | |
| Coordinates: 37.19°N 107.05°W | |
| Country | |
| State | |
| Founded | April 14, 1885 |
| Named for | Antonio D. Archuleta |
| Seat | Pagosa Springs |
| Largest town | Pagosa Springs |
| Area | |
| • Total | 1,356 sq mi (3,510 km2) |
| • Land | 1,350 sq mi (3,500 km2) |
| • Water | 5.3 sq mi (14 km2) 0.4%% |
| Population (2010) | |
| • Total | 12,084[1] |
| • Density | 8.9/sq mi (3.4/km2) |
| Time zone | UTC−7 (Mountain) |
| • Summer (DST) | UTC−6 (MDT) |
| Congressional district | 3rd |
| Website | www |
History
Archuleta County was created by the Colorado legislature on April 14, 1885, out of western Conejos County. It was named for Jose Manuel Archuleta, "head of one of the old Spanish families of New Mexico",[4] and in honor of his son Antonio D. Archuleta, who was the Senator from Conejos County at the time.
Geography
According to the U.S. Census Bureau, the county has a total area of 1,356 square miles (3,510 km2), of which 1,350 square miles (3,500 km2) is land and 5.3 square miles (14 km2) (0.4%) is water.[5]
Adjacent counties
- Mineral County, Colorado - north
- Rio Grande County, Colorado - northeast
- Conejos County, Colorado - east
- Rio Arriba County, New Mexico - south
- San Juan County, New Mexico - southwest
- La Plata County, Colorado - west
- Hinsdale County, Colorado - northwest
Major Highways
 U.S. Highway 84
 U.S. Highway 160
 State Highway 17
 State Highway 151
National protected areas
- Rio Grande National Forest
- San Juan National Forest
- Chimney Rock National Monument
- South San Juan Wilderness
| Historical population | |||
|---|---|---|---|
| Census | Pop. | %± | |
| 1890 | 826 | — | |
| 1900 | 2,117 | 156.3% | |
| 1910 | 3,302 | 56.0% | |
| 1920 | 3,590 | 8.7% | |
| 1930 | 3,204 | −10.8% | |
| 1940 | 3,806 | 18.8% | |
| 1950 | 3,030 | −20.4% | |
| 1960 | 2,629 | −13.2% | |
| 1970 | 2,733 | 4.0% | |
| 1980 | 3,664 | 34.1% | |
| 1990 | 5,345 | 45.9% | |
| 2000 | 9,898 | 85.2% | |
| 2010 | 12,084 | 22.1% | |
| 2019 (est.) | 14,029 | [6] | 16.1% |
| U.S. Decennial Census[7] 1790-1960[8] 1900-1990[9] 1990-2000[10] 2010-2019[2] | |||
State protected area
Scenic and historic trails
Demographics
At the 2000 census there were 9,898 people, 3,980 households, and 2,873 families living in the county. The population density was 7 people per square mile (3/km2). There were 6,212 housing units at an average density of 5 per square mile (2/km2). The racial makeup of the county was 88.33% White, 0.35% Black or African American, 1.40% Native American, 0.31% Asian, 0.03% Pacific Islander, 6.97% from other races, and 2.60% from two or more races. 16.76% of the population were Hispanic or Latino of any race.[11] Of the 3,980 households 31.60% had children under the age of 18 living with them, 59.80% were married couples living together, 8.20% had a female householder with no husband present, and 27.80% were non-families. 22.10% of households were one person and 6.00% were one person aged 65 or older. The average household size was 2.47 and the average family size was 2.89.
The age distribution was 25.30% under the age of 18, 6.30% from 18 to 24, 26.10% from 25 to 44, 30.40% from 45 to 64, and 11.90% 65 or older. The median age was 41 years. For every 100 females there were 102.70 males. For every 100 females age 18 and over, there were 99.50 males.
The median household income was $37,901 and the median family income was $43,259. Males had a median income of $29,521 versus $21,851 for females. The per capita income for the county was $21,683. About 9.00% of families and 11.70% of the population were below the poverty line, including 13.00% of those under age 18 and 6.60% of those age 65 or over.
Politics
| Year | Republican | Democratic | Others |
|---|---|---|---|
| 2020 | 56.8% 5,189 | 40.9% 3,738 | 2.4% 217 |
| 2016 | 58.1% 4,264 | 34.1% 2,500 | 7.8% 575 |
| 2012 | 57.5% 3,872 | 39.8% 2,679 | 2.7% 183 |
| 2008 | 54.9% 3,638 | 42.8% 2,836 | 2.3% 151 |
| 2004 | 61.7% 3,601 | 36.7% 2,141 | 1.7% 97 |
| 2000 | 62.8% 2,988 | 30.1% 1,432 | 7.1% 338 |
| 1996 | 57.1% 1,963 | 29.0% 997 | 13.9% 477 |
| 1992 | 44.1% 1,242 | 29.1% 819 | 26.8% 755 |
| 1988 | 63.7% 1,440 | 35.2% 795 | 1.2% 27 |
| 1984 | 72.0% 1,557 | 27.0% 584 | 1.0% 22 |
| 1980 | 65.9% 1,252 | 28.0% 532 | 6.1% 116 |
| 1976 | 53.6% 768 | 44.1% 632 | 2.2% 32 |
| 1972 | 64.5% 606 | 31.9% 300 | 3.6% 34 |
| 1968 | 49.7% 486 | 41.8% 409 | 8.5% 83 |
| 1964 | 36.7% 370 | 62.7% 632 | 0.6% 6 |
| 1960 | 46.3% 489 | 53.6% 567 | 0.1% 1 |
| 1956 | 59.9% 635 | 39.9% 423 | 0.2% 2 |
| 1952 | 64.6% 691 | 35.2% 377 | 0.2% 2 |
| 1948 | 55.1% 597 | 44.2% 479 | 0.7% 8 |
| 1944 | 58.5% 602 | 41.5% 427 | 0.1% 1 |
| 1940 | 53.7% 869 | 46.0% 744 | 0.3% 5 |
| 1936 | 40.6% 541 | 57.1% 761 | 2.3% 31 |
| 1932 | 32.8% 462 | 65.8% 928 | 1.4% 20 |
| 1928 | 56.5% 610 | 41.4% 447 | 2.1% 23 |
| 1924 | 43.1% 451 | 25.7% 269 | 31.2% 326 |
| 1920 | 63.1% 700 | 34.2% 379 | 2.7% 30 |
| 1916 | 35.7% 473 | 62.6% 830 | 1.7% 22 |
| 1912 | 33.6% 452 | 45.2% 609 | 37.4% 504 |
Communities
Town
Census-designated place
Other unincorporated places
See also
References
- "Population and Housing Unit Estimates". U.S. Census Bureau. August 15, 2017. Retrieved August 15, 2017.
- "State & County QuickFacts". United States Census Bureau. Archived from the original on July 6, 2011. Retrieved June 7, 2014.
- "Find a County". National Association of Counties. Archived from the original on 2011-05-31. Retrieved 2011-06-07.
- Gannett, Henry (1905). The Origin of Certain Place Names in the United States. U.S. Government Printing Office. pp. 28.
- "US Gazetteer files: 2010, 2000, and 1990". United States Census Bureau. 2011-02-12. Retrieved 2011-04-23.
- "Population and Housing Unit Estimates". Retrieved May 21, 2020.
- "U.S. Decennial Census". United States Census Bureau. Retrieved June 7, 2014.
- "Historical Census Browser". University of Virginia Library. Retrieved June 7, 2014.
- "Population of Counties by Decennial Census: 1900 to 1990". United States Census Bureau. Retrieved June 7, 2014.
- "Census 2000 PHC-T-4. Ranking Tables for Counties: 1990 and 2000" (PDF). United States Census Bureau. Retrieved June 7, 2014.
- "U.S. Census website". United States Census Bureau. Retrieved 2011-05-14.
- Leip, David. "Dave Leip's Atlas of U.S. Presidential Elections". uselectionatlas.org. Retrieved May 26, 2017.
External links
- Archuleta County Government website
- Colorado County Evolution by Don Stanwyck
- Colorado Historical Society
Places adjacent to Archuleta County, Colorado | ||||||||||
|---|---|---|---|---|---|---|---|---|---|---|
| ||||||||||
Municipalities and communities of Archuleta County, Colorado, United States | ||
|---|---|---|
| Town | Map of Colorado highlighting Archuleta County | |
| CDP | ||
| Unincorporated communities | ||
| Indian reservation | ||
| Footnotes | ‡This populated place also has portions in an adjacent county or counties | |
| ||
| Authority control |
|---|