Saint-Quentin-sur-Charente
Saint-Quentin-sur-Charente is a commune in the Charente department in southwestern France.
Saint-Quentin-sur-Charente | |
|---|---|
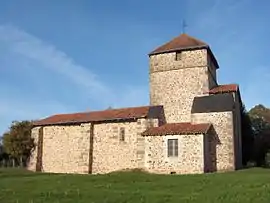 Saint-Quentin-sur-Charente church | |
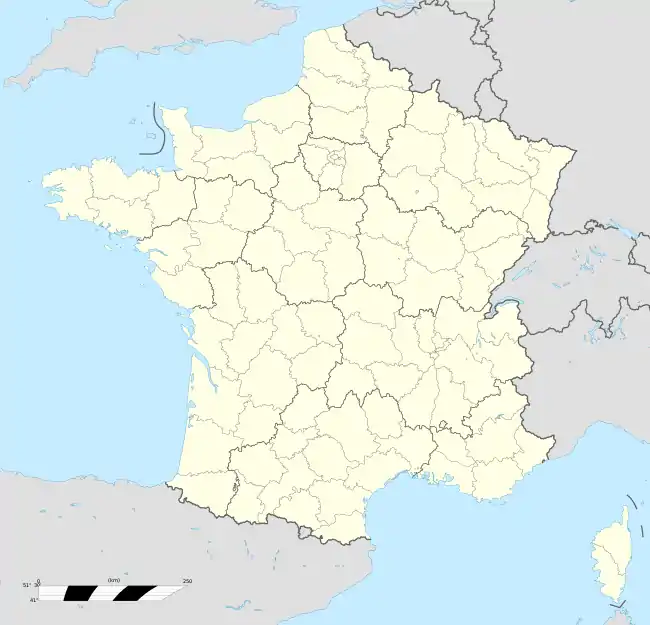
Location of Saint-Quentin-sur-Charente 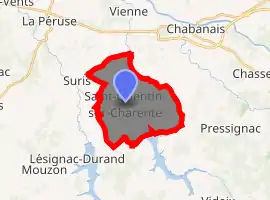
| |
 Saint-Quentin-sur-Charente 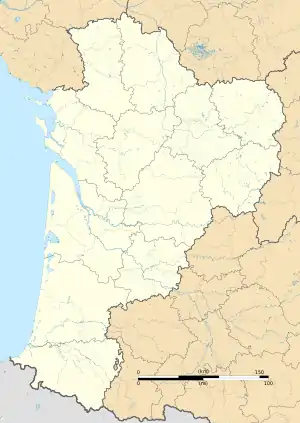 Saint-Quentin-sur-Charente | |
| Coordinates: 45°50′20″N 0°40′16″E | |
| Country | France |
| Region | Nouvelle-Aquitaine |
| Department | Charente |
| Arrondissement | Confolens |
| Canton | Charente-Vienne |
| Intercommunality | Haute-Charente |
| Government | |
| • Mayor (2020–2026) | Mickaël Loiseau |
| Area 1 | 14.39 km2 (5.56 sq mi) |
| Population (2017-01-01)[1] | 215 |
| • Density | 15/km2 (39/sq mi) |
| Time zone | UTC+01:00 (CET) |
| • Summer (DST) | UTC+02:00 (CEST) |
| INSEE/Postal code | 16345 /16150 |
| Elevation | 169–263 m (554–863 ft) (avg. 200 m or 660 ft) |
| 1 French Land Register data, which excludes lakes, ponds, glaciers > 1 km2 (0.386 sq mi or 247 acres) and river estuaries. | |
Location and access
Saint-Quentin-sur-Charente, called Saint-Quentin locally, is 6 kilometres (3.7 mi) southwest of Chabanais and 45 kilometres (28 mi) northeast of Angouleme in the upper valley of the Charente. It is located in the township of Chabanais , 6 kilometres (3.7 mi) south of La Peruse , 7 kilometres (4.3 mi) north of Massignac , 9 kilometres (5.6 mi) southeast of Roumazieres-Loubert, 12 kilometres (7.5 mi) west of Rochechouart 20 kilometres (12 mi) south of Confolens and 46 kilometres (29 mi) west of Limoges. It is served by several small county roads. The D161 and the D190 serve the town. The D164 passes just north of the town. The N 141, passes north of the town 4 kilometres (2.5 mi) from the town. The nearest train station is in Chabanais, served by TER.
Population
|
| |||||||||||||||||||||||||||||||||||||||||||||||||||||||||||||||||||||||||||||||||||||||||||||||||||||||||||||||
| Source: EHESS[2] and INSEE[3] | ||||||||||||||||||||||||||||||||||||||||||||||||||||||||||||||||||||||||||||||||||||||||||||||||||||||||||||||||
References
- "Populations légales 2017". INSEE. Retrieved 6 January 2020.
- Données Cassini, EHESS
- Population en historique depuis 1968, INSEE
| Wikimedia Commons has media related to Saint-Quentin-sur-Charente. |
| Authority control |
|---|