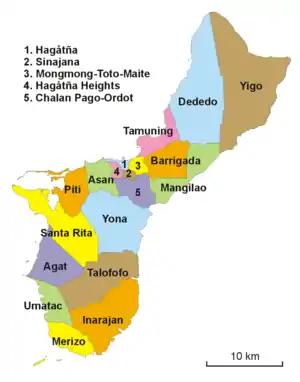
Villages of Guam
The United States territory of Guam is divided into nineteen municipalities, called villages. Each village is governed by an elected mayor. Village populations range in size from under 1,000 to over 40,000. As of the 2000 census, the total population of Guam was 154,805.[1] Each village is counted as a single county equivalent by the United States Census Bureau for statistical purposes.[2]
| list of Villages of Guam | |
|---|---|
 | |
| Category | Federal Unit |
| Number | 19 |
| Populations | 782 (Umatac) – 44,943 (Dededo) |
| Areas | 1 square mile (2.6 km2) (Sinajana) – 35 square miles (91 km2) (Yigo) |
| Government | County government |
 |
|---|
| This article is part of a series on the politics and government of Guam |
|
History
Many villages have rich histories reaching back thousands of years. Artifacts from ancient Chamorro settlements can be found in every village of Guam. When the Spanish Empire colonized the Marianas Islands as part of its Pacific possessions in the 16th and 17th centuries, the island was divided into separate districts with each district consisting of a parish with a village center governed by an alcalde, appointed by the island's governor.
In the 18th century, there were six parishes on Guam: Hagåtña, Hagat, Humåtak, Malesso', Inalåjan, and Pago.
Prior to Spanish colonization, Chamorro people regularly held village celebrations. After adopting Christianity, these celebrations became fiestas in honor of the patron saint of each village. Annual village fiestas are still held throughout the island every year.
The current division of Guam into municipalities took place in the 1920s under United States Navy Administration.
List of villages
| Village | Area km² |
Population (2010 census) |
Population (2000 census) |
Region [3] |
Pop. density (2000) |
|---|---|---|---|---|---|
| Agana Heights | 2.68 | 3,808 | 3,940 | Central | 1,470 |
| Agat | 27.19 | 4,917 | 5,656 | South | 210 |
| Asan-Maina | 14.35 | 2,137 | 2,090 | Central | 150 |
| Barrigada | 21.96 | 8,875 | 8,652 | Central | 390 |
| Chalan-Pago-Ordot | 14.73 | 6,822 | 5,923 | Central | 400 |
| Dededo | 79.16 | 44,943 | 42,980 | North | 540 |
| Hagåtña | 2.33 | 1,051 | 1,100 | Central | 470 |
| Inarajan | 48.82 | 2,273 | 3,052 | South | 60 |
| Mangilao | 26.45 | 15,191 | 13,313 | Central | 500 |
| Merizo | 16.39 | 1,850 | 2,152 | South | 130 |
| Mongmong-Toto-Maite | 4.79 | 6,825 | 5,845 | Central | 1,220 |
| Piti | 19.26 | 1,454 | 1,666 | Central | 90 |
| Santa Rita | 41.89 | 6,084 | 7,500 | South | 180 |
| Sinajana | 2.20 | 2,592 | 2,853 | Central | 1,300 |
| Talofofo | 45.81 | 3,050 | 3,215 | South | 70 |
| Tamuning (including Tumon) | 14.66 | 19,685 | 18,012 | North | 1,230 |
| Umatac | 16.63 | 782 | 887 | South | 50 |
| Yigo | 91.71 | 20,539 | 19,474 | North | 210 |
| Yona | 52.53 | 6,480 | 6,484 | South | 120 |
| Guam | 543.52 | 159,358 | 154,794 | 285 |
See also
- List of villages in the Northern Mariana Islands
- Village (United States)
Notes
- https://www.census.gov/census2000/guam.html
- "Geographic Levels". United States Census Bureau. Suitland, Maryland. September 12, 2016. Retrieved 31 December 2020.
- "Archived copy". Archived from the original on 2007-10-31. Retrieved 2007-12-31.CS1 maint: archived copy as title (link)
References
- Rogers, Robert F (1995). Destiny's Landfall: A History of Guam: University of Hawai'i Press. ISBN 0-8248-1678-1
- Carter, Lee D; Carter, Rosa Roberto; Wuerch, William L (1997). Guam History: Perspectives Volume One: MARC. ISBN 1-878453-28-9
- Sanchez, Pedro C. Guahan, Guam: The History of our Island: Sanchez Publishing House.
- Districts of Guam, United States Census Bureau
External links
| Wikimedia Commons has media related to Villages in Guam. |
- PDN Village Maps
- "Municipalities of Guam". Statoids.
- Guampedia, Guam's Online Encyclopedia Guam Villages
Hagåtña (capital) | |
| Topics | |
| Islands | |
| Villages | |
| Peaks |
|
| Healthcare | |