Lamoille County, Vermont
Lamoille County /ləˈmɔɪl/ is a county located in the U.S. state of Vermont. As of the 2010 census, the population was 24,475,[1] and it is the third-least populous county in Vermont. Its shire town (county seat) is the town of Hyde Park, while Morristown is the county's largest town by population as well as its main commercial center.[2] The county was created in 1835 and organized the following year.[3]
Lamoille County | |
|---|---|
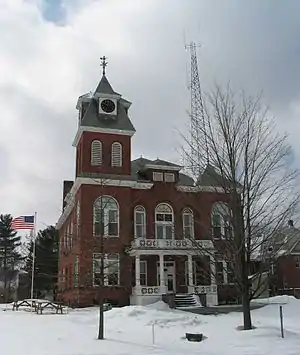
 Lamoille County Superior Courthouse in Hyde Park | |
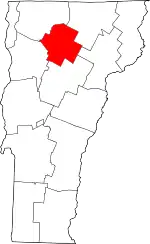
 Location within the U.S. state of Vermont | |
 Vermont's location within the U.S. | |
| Coordinates: 44.61°N 72.65°W | |
| Country | |
| State | |
| Founded | 1836 |
| Named for | Lamoille River |
| Shire Town | Hyde Park |
| Largest town | Morristown |
| Area | |
| • Total | 464 sq mi (1,200 km2) |
| • Land | 459 sq mi (1,190 km2) |
| • Water | 4.9 sq mi (13 km2) 1.1%% |
| Population (2010) | |
| • Total | 24,475 |
| • Estimate (2019) | 25,362 |
| • Density | 53/sq mi (20/km2) |
| Time zone | UTC−5 (Eastern) |
| • Summer (DST) | UTC−4 (EDT) |
| Congressional district | At-large |
| Website | www |
History
The area was buried in a mile of ice during the ice age. As the ice melted, Lake Stowe was formed. When the ice melted completely, the water from the lake ran out through the Lamoille River valley.
This area was long occupied by the Algonquian-speaking indigenous Abenaki people and their ancestors. During French colonization of what is now Canada, fur traders began to trade with the Abenaki. There were also French who settled here, coming down from the settlements in Quebec, and named the Lamoille River. The French later enlisted the Abenaki as allies in the frontier raiding and wars with English colonists in the lower New England colonies. For decades there was no border and peoples passed freely through this area.
After the American Revolutionary War and Vermont's admission as a separate state, the county was settled in the 19th century by American migrants from other parts of New England and French-Canadian immigrants from across the border. Some developed small farms. Some came to work in the asbestos mine on Belvidere Mountain, which operated into the 20th century. Some gradually moved to other counties where there were cotton mills, weaving cotton from the South both before and after the Civil War. In the United States, many of the French immigrants were forced to accept anglicization of their names, such as New City for Villeneuve, or Senton for St. Onge. Some of their descendants have reclaimed their family's original names.
20th century to present
Mining continued through the 20th century. By the late 20th century, environmental hazards were better understood, but many of the miners contracted asbestosis and other diseases of the lungs from their work.
In 1972, the Lamoille Community College was the fifth of the several community colleges that became part of the Vermont State Colleges system. At the time, they were renamed as Community College of Vermont.
In 2008, the state notified residents of Belvidere, Eden, Hyde Park, Johnson, Waterville and eight towns in the adjacent counties of Orleans and Franklin, that a review of health records from 1995 to 2006 had revealed that residents within ten miles (16 km) of the former asbestos mine on Belvidere Mountain had higher than normal rates of contracting asbestosis. The state and federal government continued to study this problem.[4]
In April 2009 the Vermont Department of health released a revised study which found that all of deaths related to the asbestos mine were caused by individual occupational exposure. The report concluded that people living near the mines had no more increased risk of asbestos-related illness than people living anywhere else in Vermont.[5]
In 2008, the county appeared to have disproportionate power in the legislature with the House Speaker, Shap Smith, from Morrisville, Floyd Nease, house majority leader, Senator Susan Bartlett, from Hyde Park, chair of the House Appropriations Committee, and Richard Westman, chair of the House Transportation Committee and the sole Republican.[6]
Geography
According to the U.S. Census Bureau, the county has a total area of 464 square miles (1,200 km2), of which 459 square miles (1,190 km2) is land and 4.9 square miles (13 km2) (1.1%) is water.[7] It is the second-smallest county in Vermont by area, as well as one of only two Vermont counties that does not share a border with another state or with Quebec.
Lamoille County is the only county in Vermont that does not have at least one of Vermont's five U.S. Routes passing through it, although all ten of the Lamoille County towns are served by Vermont state routes.
Adjacent counties
- Orleans County — northeast
- Caledonia County — east
- Washington County — south
- Chittenden County — west
- Franklin County — northwest
Demographics
| Historical population | |||
|---|---|---|---|
| Census | Pop. | %± | |
| 1840 | 10,475 | — | |
| 1850 | 10,872 | 3.8% | |
| 1860 | 12,311 | 13.2% | |
| 1870 | 12,448 | 1.1% | |
| 1880 | 12,684 | 1.9% | |
| 1890 | 12,831 | 1.2% | |
| 1900 | 12,289 | −4.2% | |
| 1910 | 12,585 | 2.4% | |
| 1920 | 11,858 | −5.8% | |
| 1930 | 10,947 | −7.7% | |
| 1940 | 11,028 | 0.7% | |
| 1950 | 11,388 | 3.3% | |
| 1960 | 11,027 | −3.2% | |
| 1970 | 13,309 | 20.7% | |
| 1980 | 16,767 | 26.0% | |
| 1990 | 19,735 | 17.7% | |
| 2000 | 23,233 | 17.7% | |
| 2010 | 24,475 | 5.3% | |
| 2019 (est.) | 25,362 | [8] | 3.6% |
| U.S. Decennial Census[9] 1790–1960[10] 1900–1990[11] 1990–2000[12] 2010–2018[1] | |||
2000 census
As of the census[13] of 2000, there were 23,233 people, 9,221 households, and 5,984 families living in the county. The population density was 50 people per square mile (19/km2). There were 11,009 housing units at an average density of 24 per square mile (9/km2). The racial makeup of the county was 97.31% White, 0.33% Black or African American, 0.45% Native American, 0.37% Asian, 0.03% Pacific Islander, 0.12% from other races, and 1.39% from two or more races. 0.77% of the population were Hispanic or Latino of any race. 15.7% were of English, 14.5% American, 11.9% Irish, 11.4% French, 8.7% French Canadian, 7.0% German and 5.2% Italian ancestry. 95.9% spoke English and 2.4% French at home.
There were 9,221 households, out of which 32.00% had children under the age of 18 living with them, 51.40% were married couples living together, 8.90% had a female householder with no husband present, and 35.10% were non-families. 25.00% of all households were made up of individuals, and 8.10% had someone living alone who was 65 years of age or older. The average household size was 2.45 and the average family size was 2.94.
In the county, the population was spread out, with 24.30% under the age of 18, 10.00% from 18 to 24, 29.90% from 25 to 44, 24.50% from 45 to 64, and 11.40% who were 65 years of age or older. The median age was 36 years. For every 100 females there were 100.10 males. For every 100 females age 18 and over, there were 97.30 males.
The median income for a household in the county was $39,356, and the median income for a family was $44,620. Males had a median income of $30,848 versus $24,444 for females. The per capita income for the county was $20,972. About 6.40% of families and 9.60% of the population were below the poverty line, including 10.70% of those under age 18 and 8.50% of those age 65 or over.
2010 census
As of the 2010 United States Census, there were 24,475 people, 10,014 households, and 6,274 families living in the county.[14] The population density was 53.3 inhabitants per square mile (20.6/km2). There were 12,969 housing units at an average density of 28.3 per square mile (10.9/km2).[15] The racial makeup of the county was 96.7% white, 0.6% black or African American, 0.5% Asian, 0.4% American Indian, 0.3% from other races, and 1.5% from two or more races. Those of Hispanic or Latino origin made up 1.3% of the population.[14] In terms of ancestry, 18.3% were English, 16.5% were Irish, 10.2% were German, 7.7% were French Canadian, and 4.6% were American.[16]
Of the 10,014 households, 30.6% had children under the age of 18 living with them, 48.3% were married couples living together, 9.4% had a female householder with no husband present, 37.3% were non-families, and 27.3% of all households were made up of individuals. The average household size was 2.37 and the average family size was 2.87. The median age was 39.7 years.[14]
The median income for a household in the county was $52,232 and the median income for a family was $62,364. Males had a median income of $41,761 versus $31,250 for females. The per capita income for the county was $27,164. About 8.7% of families and 12.0% of the population were below the poverty line, including 15.0% of those under age 18 and 8.4% of those age 65 or over.[17]
Politics
After being formed in 1836, Lamoille County was unable of voting in that years election.
In 1840 the county was won by Whig Party candidate William Henry Harrison.
In 1844, the county was won by Democratic Party candidate James K. Polk.
In 1848 and 1852, the county was won by Free Soil Party candidates Martin Van Buren and John P. Hale, respectively.
From John C. Frémont in 1856 to Richard Nixon in 1960 (barring 1912, where the county was won by Progressive Party candidate and former president Theodore Roosevelt), the Republican Party would have a 104-year winning streak in the county.
In 1964, the county was won by Democratic Party incumbent President Lyndon B. Johnson.
Following the Democrats victory in 1964, the county went back to voting for Republican candidates for another 20 year winning streak starting with Richard Nixon in 1968 and ending with George H. W. Bush in 1988, who became the last Republican presidential candidate to win the county.
In 1992 the county was won by Bill Clinton and has been won by Democratic candidates ever since.
| Year | Republican | Democratic | Third parties |
|---|---|---|---|
| 2020 | 27.9% 4,163 | 68.7% 10,240 | 3.4% 512 |
| 2016 | 28.0% 3,570 | 56.7% 7,241 | 15.3% 1,951 |
| 2012 | 27.9% 3,342 | 69.8% 8,371 | 2.3% 275 |
| 2008 | 27.8% 3,515 | 70.4% 8,914 | 1.9% 239 |
| 2004 | 35.0% 4,260 | 62.7% 7,636 | 2.3% 285 |
| 2000 | 39.6% 4,456 | 50.5% 5,676 | 9.9% 1,114 |
| 1996 | 29.5% 2,705 | 54.4% 4,997 | 16.2% 1,484 |
| 1992 | 29.0% 2,936 | 44.0% 4,459 | 27.1% 2,747 |
| 1988 | 54.5% 4,433 | 43.8% 3,561 | 1.7% 139 |
| 1984 | 62.1% 4,674 | 36.5% 2,746 | 1.4% 106 |
| 1980 | 46.9% 3,228 | 35.0% 2,414 | 18.1% 1,248 |
| 1976 | 61.6% 3,535 | 35.1% 2,016 | 3.3% 191 |
| 1972 | 70.2% 4,164 | 28.0% 1,659 | 1.9% 112 |
| 1968 | 68.0% 2,965 | 28.4% 1,239 | 3.5% 154 |
| 1964 | 46.2% 2,036 | 53.9% 2,376 | |
| 1960 | 76.0% 3,272 | 24.0% 1,032 | |
| 1956 | 83.6% 3,464 | 16.4% 678 | |
| 1952 | 84.5% 3,516 | 15.2% 633 | 0.3% 11 |
| 1948 | 73.7% 2,344 | 25.7% 816 | 0.7% 21 |
| 1944 | 68.2% 2,212 | 31.8% 1,031 | |
| 1940 | 63.6% 2,566 | 36.3% 1,463 | 0.1% 5 |
| 1936 | 68.8% 2,846 | 30.9% 1,279 | 0.3% 12 |
| 1932 | 69.7% 2,599 | 29.4% 1,096 | 0.9% 34 |
| 1928 | 84.6% 3,262 | 15.0% 576 | 0.4% 16 |
| 1924 | 86.2% 2,480 | 10.6% 305 | 3.2% 91 |
| 1920 | 82.1% 2,311 | 16.3% 458 | 1.7% 47 |
| 1916 | 67.1% 1,474 | 29.3% 643 | 3.6% 79 |
| 1912 | 36.0% 852 | 18.2% 431 | 45.7% 1,081 |
| 1908 | 79.0% 1,455 | 16.9% 311 | 4.1% 75 |
| 1904 | 81.7% 1,521 | 15.9% 296 | 2.4% 44 |
| 1900 | 79.2% 1,742 | 19.0% 418 | 1.9% 41 |
| 1896 | 80.8% 2,061 | 17.3% 440 | 2.0% 50 |
| 1892 | 72.1% 1,470 | 25.4% 517 | 2.5% 51 |
| 1888 | 74.1% 1,797 | 22.4% 543 | 3.5% 85 |
| 1884 | 64.4% 1,567 | 25.9% 631 | 9.7% 237 |
| 1880 | 66.6% 1,702 | 23.0% 587 | 10.5% 268 |
Education

Northern Vermont University-Johnson is a Vermont State College located in Johnson in Lamoille County. It was established in 1828 as Johnson Academy. It was among the original colleges to come together to form the Vermont State College system.
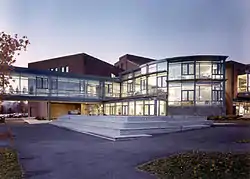
The Community College of Vermont (CCV) is located in Morrisville in Lamoille County.
Communities
Towns
- Belvidere
- Cambridge
- Eden
- Elmore
- Hyde Park (shire town)
- Johnson
- Morristown
- Stowe
- Waterville
- Wolcott
Villages
Census-designated place
Unincorporated community
References
- "State & County QuickFacts". United States Census Bureau. Archived from the original on June 6, 2011. Retrieved December 30, 2013.
- "Find a County". National Association of Counties. Retrieved June 7, 2011.
- "Vermont: Individual County Chronologies". Vermont Atlas of Historical County Boundaries. The Newberry Library. 2008. Retrieved June 30, 2015.
- Rathke, Lisa (December 12, 2008). Neighbors worry about mine's impact on health. Burlington Free Press.
- "Overview: Asbestos in Buildings". Vermont Department of Health. 2016-07-18. Retrieved March 26, 2018.
- Remsen, Nancy (January 12, 2009). Quartet hold power positions in 2009 Legislature. Burlington Free Press.
- "2010 Census Gazetteer Files". United States Census Bureau. August 22, 2012. Retrieved June 29, 2015.
- "Population and Housing Unit Estimates". Retrieved May 31, 2019.
- "U.S. Decennial Census". United States Census Bureau. Retrieved June 29, 2015.
- "Historical Census Browser". University of Virginia Library. Retrieved June 29, 2015.
- Forstall, Richard L., ed. (March 27, 1995). "Population of Counties by Decennial Census: 1900 to 1990". United States Census Bureau. Retrieved June 29, 2015.
- "Census 2000 PHC-T-4. Ranking Tables for Counties: 1990 and 2000" (PDF). United States Census Bureau. April 2, 2001. Retrieved June 29, 2015.
- "U.S. Census website". United States Census Bureau. Retrieved May 14, 2011.
- "DP-1 Profile of General Population and Housing Characteristics: 2010 Demographic Profile Data". United States Census Bureau. Archived from the original on February 13, 2020. Retrieved January 20, 2016.
- "Population, Housing Units, Area, and Density: 2010 - County". United States Census Bureau. Archived from the original on February 13, 2020. Retrieved January 20, 2016.
- "DP02 SELECTED SOCIAL CHARACTERISTICS IN THE UNITED STATES – 2006-2010 American Community Survey 5-Year Estimates". United States Census Bureau. Archived from the original on February 13, 2020. Retrieved January 20, 2016.
- "DP03 SELECTED ECONOMIC CHARACTERISTICS – 2006-2010 American Community Survey 5-Year Estimates". United States Census Bureau. Archived from the original on February 13, 2020. Retrieved January 20, 2016.
- Leip, David. "Dave Leip's Atlas of U.S. Presidential Elections". uselectionatlas.org. Retrieved March 26, 2018.
