1988 United States presidential election in Vermont
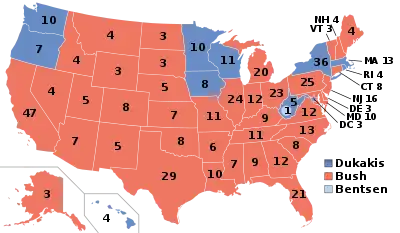
The 1988 United States presidential election in Vermont took place on November 8, 1988, as part of the 1988 United States presidential election, which was held throughout all 50 states and D.C. Voters chose three representatives, or electors to the Electoral College, who voted for president and vice president.
| ||||||||||||||||||||||||||
| ||||||||||||||||||||||||||
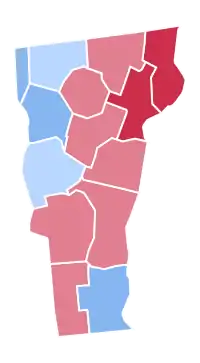
 County Results
| ||||||||||||||||||||||||||
| ||||||||||||||||||||||||||
| Elections in Vermont |
|---|
.svg.png.webp) |
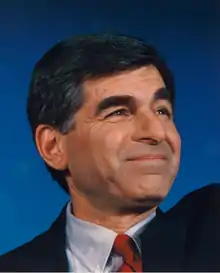
Vermont voted for the Republican nominee, Vice President George H. W. Bush, over the Democratic nominee, Massachusetts Governor Michael Dukakis, by a narrow margin of 3.52%. Bush took 51.10% of the vote to Dukakis's 47.58%.
While the Republicans held onto Vermont's 3 electoral votes once more, the closeness of the race represented a turning point in the state's political history. Vermont had once been one of the most Republican states in the country, historically having voted Republican more times than any other state, often by landslide margins. From 1856 to 1984, the state had gone Republican in every presidential election except for the 1964 Democratic landslide. Despite this history, Vermont was considered a swing state in 1988, and the Dukakis campaign targeted it in its electoral strategy.[1] In this election, the state weighed in as about 2% more Democratic than the nation. With the exception of Lyndon Johnson in 1964, Dukakis’ performance was the best of any Democratic presidential candidate in Vermont until Bill Clinton won the state in 1992.
Like the rest of liberal and secular New England, Vermont in the 1980s began moving to the Democratic Party as the Republican Party became increasingly dominated by conservatives, Southerners, and Evangelical Christians. Consequently, this would be the last time that a Republican would carry the state of Vermont in a presidential election, and in the following three decades it would become regarded as one of the bluest of blue states. It would also be the last time the Republicans would carry the counties of Bennington, Lamoille, Rutland, Washington and Windsor[2] – indeed the last time the Republicans won any county outside the northeast of the state.
Results
| 1988 United States presidential election in Vermont[3] | |||||
|---|---|---|---|---|---|
| Party | Candidate | Votes | Percentage | Electoral votes | |
| Republican | George H. W. Bush | 124,331 | 51.10% | 3 | |
| Democratic | Michael Dukakis | 115,775 | 47.58% | 0 | |
| No party | Write-ins | 1,140 | 0.47% | 0 | |
| Libertarian | Ron Paul | 1,003 | 0.41% | 0 | |
| Independent | Lyndon LaRouche | 275 | 0.11% | 0 | |
| New Alliance | Lenora Fulani | 205 | 0.08% | 0 | |
| America First | David Duke | 190 | 0.08% | 0 | |
| Peace and Freedom | Herbert G. Lewin | 161 | 0.07% | 0 | |
| Liberty Union (Socialist) | Willa Kenoyer | 142 | 0.06% | 0 | |
| Socialist Workers | James Warren | 111 | 0.05% | 0 | |
| Totals | 243,333 | 100.00% | 3 | ||
| Voter Turnout (Voting age/Registered) | 59%/70% | ||||
Results by county
| County | George Herbert Walker Bush[4] Republican |
Michael Stanley Dukakis[4] Democratic |
Various candidates[4] Write-ins |
Ronald Ernest Paul[4] Libertarian |
Various candiates[4] Other parties |
Margin | Total votes cast | ||||||
|---|---|---|---|---|---|---|---|---|---|---|---|---|---|
| # | % | # | % | # | % | # | % | # | % | # | % | ||
| Addison | 6,773 | 49.09% | 6,791 | 49.22% | 63 | 0.46% | 93 | 0.67% | 77 | 0.56% | -18 | -0.13% | 13,797 |
| Bennington | 8,387 | 53.34% | 7,174 | 45.62% | 39 | 0.25% | 55 | 0.35% | 70 | 0.45% | 1,213 | 7.71% | 15,725 |
| Caledonia | 6,915 | 61.13% | 4,251 | 37.58% | 57 | 0.50% | 52 | 0.46% | 37 | 0.33% | 2,664 | 23.55% | 11,312 |
| Chittenden | 27,380 | 47.75% | 29,185 | 50.89% | 266 | 0.46% | 301 | 0.52% | 214 | 0.37% | -1,805 | -3.15% | 57,346 |
| Essex | 1,535 | 64.20% | 837 | 35.01% | 5 | 0.21% | 6 | 0.25% | 8 | 0.33% | 698 | 29.19% | 2,391 |
| Franklin | 7,293 | 49.16% | 7,372 | 49.70% | 61 | 0.41% | 49 | 0.33% | 59 | 0.40% | -79 | -0.53% | 14,834 |
| Grand Isle | 1,316 | 48.24% | 1,369 | 50.18% | 7 | 0.26% | 22 | 0.81% | 14 | 0.51% | -53 | -1.94% | 2,728 |
| Lamoille | 4,433 | 54.51% | 3,561 | 43.78% | 49 | 0.60% | 43 | 0.53% | 47 | 0.58% | 872 | 10.72% | 8,133 |
| Orange | 6,151 | 54.35% | 4,977 | 43.97% | 56 | 0.49% | 79 | 0.70% | 55 | 0.49% | 1,174 | 10.37% | 11,318 |
| Orleans | 5,257 | 54.70% | 4,224 | 43.95% | 69 | 0.72% | 25 | 0.26% | 36 | 0.37% | 1,033 | 10.75% | 9,611 |
| Rutland | 14,482 | 55.15% | 11,496 | 43.78% | 118 | 0.45% | 62 | 0.24% | 103 | 0.39% | 2,986 | 11.37% | 26,261 |
| Washington | 13,253 | 50.40% | 12,690 | 48.26% | 138 | 0.52% | 77 | 0.29% | 136 | 0.52% | 563 | 2.14% | 26,294 |
| Windham | 8,572 | 45.96% | 9,839 | 52.75% | 77 | 0.41% | 48 | 0.26% | 117 | 0.63% | -1,267 | -6.79% | 18,653 |
| Windsor | 12,584 | 50.48% | 12,009 | 48.17% | 135 | 0.54% | 91 | 0.37% | 111 | 0.45% | 575 | 2.31% | 24,930 |
| Totals | 124,331 | 51.10% | 115,775 | 47.58% | 1,140 | 0.47% | 1,003 | 0.41% | 1,084 | 0.45% | 8,556 | 3.52% | 243,333 |
References
- https://www.washingtonpost.com/archive/politics/1988/10/16/dukakis-electoral-strategy-set/3c60609e-0bdb-48e1-9397-f6725dd3348c/?noredirect=on
- Sullivan, Robert David; ‘How the Red and Blue Map Evolved Over the Past Century’; America Magazine in The National Catholic Review; June 29, 2016
- "1988 Presidential General Election Results - Vermont". Dave Leip's Atlas of U.S. Presidential Elections. Retrieved 2013-02-07.
- Our Campaigns; VT US Presidential Election Race, November 08, 1988
.jpg.webp)

