1984 United States presidential election in Vermont
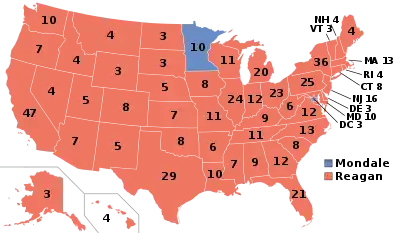
The 1984 United States presidential election in Vermont took place on November 6, 1984, as part of the 1984 United States presidential election, which was held throughout all 50 states and D.C. Voters chose three representatives, or electors to the Electoral College, who voted for president and vice president.
| ||||||||||||||||||||||||||
| ||||||||||||||||||||||||||
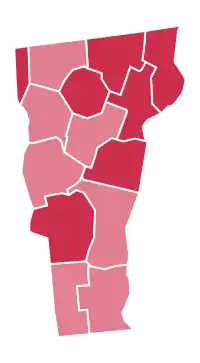
 County Results
Reagan 50–60% 60–70%
| ||||||||||||||||||||||||||
| ||||||||||||||||||||||||||
| Elections in Vermont |
|---|
.svg.png.webp) |
Vermont voted for the Republican nominee, incumbent President Ronald Reagan, over the Democratic nominee, former Vice President Walter Mondale, by a margin of 17.11%. Reagan took 57.92% of the vote to Mondale's 40.81%.
1984 would prove to be the last election in which Vermont was considered a safe Republican state, becoming a swing state four years later in 1988 and eventually one of the most liberal of blue states after 1992. While Reagan himself won the state comfortably, the Republican Party’s shift to the right he represented was already causing signs of weakness to develop in Vermont. Between 1856 and 1956 generally the most Republican state in the country, the scale of Reagan’s nationwide landslide concealed the fact that 1984 was the second election in a row in which Vermont was more Democratic than the nation as a whole: Reagan had carried the state by 17.11% versus his 18.22% national victory margin, making the state 1.11% more Democratic than the nation. Prior to Reagan, Vermont had been more Republican than the nation in every election from the founding of the Republican Party until 1980, except 1964, when another conservative, Barry Goldwater, was the Republican nominee. By contrast, as recently as 1976, moderate Republican Gerald Ford had performed 13.26% stronger in Vermont than he did nationally.
1984 would be the last time in which a Republican presidential nominee carried every county in Vermont, and the last when the GOP carried Addison, Chittenden, Franklin, Grand Isle and Windham Counties.[1]
Results
| 1984 United States presidential election in Vermont[2] | |||||
|---|---|---|---|---|---|
| Party | Candidate | Votes | Percentage | Electoral votes | |
| Republican | Ronald Reagan | 135,865 | 57.92% | 3 | |
| Democratic | Walter Mondale | 95,730 | 40.81% | 0 | |
| Libertarian | David Bergland | 1,002 | 0.43% | 0 | |
| No party | Write-ins | 712 | 0.30% | 0 | |
| Independent | Lyndon LaRouche | 423 | 0.18% | 0 | |
| Liberty Union (New Alliance) | Dennis L. Serrette | 323 | 0.14% | 0 | |
| Citizens | Sonia Johnson | 264 | 0.11% | 0 | |
| Socialist Workers | Melvin T. Mason | 127 | 0.05% | 0 | |
| Communist | Gus Hall | 115 | 0.05% | 0 | |
| Totals | 234,561 | 100.00% | 3 | ||
| Voter Turnout (Voting age/Registered) | 60%/70% | ||||
Results by county
| County | Ronald Wilson Reagan[3] Republican |
Walter Frederick Mondale[3] Democratic |
David Peter Bergland[3] Libertarian |
Various candidates[3] Write-ins |
Various candidates[3] Other parties |
Margin | Total votes cast | ||||||
|---|---|---|---|---|---|---|---|---|---|---|---|---|---|
| # | % | # | % | # | % | # | % | # | % | # | % | ||
| Addison | 7,589 | 58.26% | 5,299 | 40.68% | 46 | 0.35% | 40 | 0.31% | 51 | 0.39% | 2,290 | 17.58% | 13,025 |
| Bennington | 9,035 | 59.11% | 6,039 | 39.51% | 82 | 0.54% | 16 | 0.10% | 112 | 0.73% | 2,996 | 19.60% | 15,284 |
| Caledonia | 7,249 | 68.32% | 3,223 | 30.38% | 48 | 0.45% | 37 | 0.35% | 53 | 0.50% | 4,026 | 37.95% | 10,610 |
| Chittenden | 30,217 | 54.11% | 24,830 | 44.46% | 335 | 0.60% | 206 | 0.37% | 257 | 0.46% | 5,387 | 9.65% | 55,845 |
| Essex | 1,632 | 69.48% | 693 | 29.50% | 5 | 0.21% | 4 | 0.17% | 15 | 0.64% | 939 | 39.97% | 2,349 |
| Franklin | 8,683 | 59.63% | 5,755 | 39.52% | 45 | 0.31% | 27 | 0.19% | 52 | 0.36% | 2,928 | 20.11% | 14,562 |
| Grand Isle | 1,537 | 60.27% | 980 | 38.43% | 15 | 0.59% | 3 | 0.12% | 15 | 0.59% | 557 | 21.84% | 2,550 |
| Lamoille | 4,674 | 62.10% | 2,746 | 36.49% | 32 | 0.43% | 24 | 0.32% | 50 | 0.66% | 1,928 | 25.62% | 7,526 |
| Orange | 6,407 | 60.24% | 4,088 | 38.44% | 46 | 0.43% | 47 | 0.44% | 47 | 0.44% | 2,319 | 21.81% | 10,635 |
| Orleans | 5,966 | 63.53% | 3,294 | 35.08% | 40 | 0.43% | 34 | 0.36% | 57 | 0.61% | 2,672 | 28.45% | 9,391 |
| Rutland | 15,236 | 60.98% | 9,545 | 38.20% | 69 | 0.28% | 35 | 0.14% | 100 | 0.40% | 5,691 | 22.78% | 24,985 |
| Washington | 13,706 | 54.48% | 11,163 | 44.37% | 115 | 0.46% | 59 | 0.23% | 115 | 0.46% | 2,543 | 10.11% | 25,158 |
| Windham | 9,880 | 54.05% | 8,206 | 44.89% | 39 | 0.21% | 60 | 0.33% | 94 | 0.51% | 1,674 | 9.16% | 18,279 |
| Windsor | 14,054 | 57.96% | 9,869 | 40.70% | 85 | 0.35% | 120 | 0.49% | 119 | 0.49% | 4,185 | 17.26% | 24,247 |
| Totals | 135,865 | 57.92% | 95,730 | 40.81% | 1,002 | 0.43% | 712 | 0.30% | 1,252 | 0.53% | 40,135 | 17.11% | 234,561 |
References
- Sullivan, Robert David; ‘How the Red and Blue Map Evolved Over the Past Century’; America Magazine in The National Catholic Review; June 29, 2016
- "1984 Presidential General Election Results - Vermont". Dave Leip's Atlas of U.S. Presidential Elections. Retrieved 2013-02-07.
- Our Campaigns; VT US Presidential Election Race; November 06, 1984
.jpg.webp)

