1880 United States presidential election in Vermont
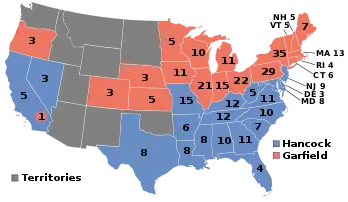
The 1880 United States presidential election in Vermont took place on November 2, 1880, as part of the 1880 United States presidential election. Voters chose five representatives, or electors to the Electoral College, who voted for president and vice president.
| ||||||||||||||||||||||||||
| ||||||||||||||||||||||||||
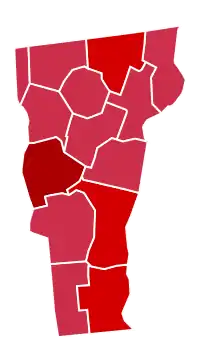
 County Results
Garfield 60–70% 70–80% 80–90%
| ||||||||||||||||||||||||||
| ||||||||||||||||||||||||||
| Elections in Vermont |
|---|
.svg.png.webp) |
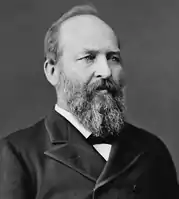
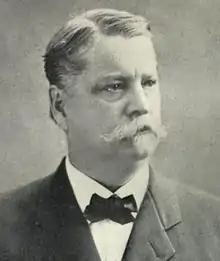
Vermont voted for the Republican nominee, James A. Garfield, over the Democratic nominee, Winfield Scott Hancock. Garfield won Vermont by a margin of 41.66%.
With 69.81% of the popular vote, Vermont would be Garfield's strongest victory in terms of percentage in the popular vote.[1]
The Republican Vice Presidential nominee Chester Alan Arthur was born in Vermont, more specifically in the town of Fairfield.
Results
| 1880 United States presidential election in Vermont[2] | ||||||||
|---|---|---|---|---|---|---|---|---|
| Party | Candidate | Running mate | Popular vote | Electoral vote | ||||
| Count | % | Count | % | |||||
| Republican | James Abram Garfield of Ohio | Chester Alan Arthur of New York | 45,091 | 69.81% | 5 | 100.00% | ||
| Democratic | Winfield Scott Hancock of Pennsylvania | William Hayden English of Indiana | 18,182 | 28.15% | 0 | 0.00% | ||
| Greenback | James Baird Weaver of Iowa | Barzillai Jefferson Chambers of Texas | 1,212 | 1.88% | 0 | 0.00% | ||
| N/A | Others | Others | 109[note 1] | 0.17% | 0 | 0.00% | ||
| Total | 48,829 | 100.00% | 5 | 100.00% | ||||
Results by county
| County | James Abram Garfield[3] Republican |
Winfield Scott Hancock[3] Democratic |
James Baird Weaver[4] Greenback |
Margin | Total votes cast[note 2] | ||||
|---|---|---|---|---|---|---|---|---|---|
| # | % | # | % | # | % | # | % | ||
| Addison | 3,842 | 85.72% | 585 | 13.05% | 55 | 1.23% | 3,257 | 72.67% | 4,482 |
| Bennington | 2,641 | 64.71% | 1,440 | 35.29% | 0 | 0.00% | 1,201 | 29.43% | 4,081 |
| Caledonia | 3,134 | 69.11% | 1,372 | 30.25% | 29 | 0.64% | 1,762 | 38.85% | 4,535 |
| Chittenden | 3,902 | 64.86% | 2,020 | 33.58% | 94 | 1.56% | 1,882 | 31.28% | 6,016 |
| Essex | 853 | 64.14% | 472 | 35.49% | 5 | 0.38% | 381 | 28.65% | 1,330 |
| Franklin | 3,018 | 60.07% | 1,652 | 32.88% | 354 | 7.05% | 1,366 | 27.19% | 5,024 |
| Grand Isle | 397 | 60.80% | 239 | 36.60% | 17 | 2.60% | 158 | 24.20% | 653 |
| Lamoille | 1,702 | 66.56% | 587 | 22.96% | 268 | 10.48% | 1,115 | 43.61% | 2,557 |
| Orange | 3,107 | 65.14% | 1,631 | 34.19% | 32 | 0.67% | 1,476 | 30.94% | 4,770 |
| Orleans | 2,911 | 77.79% | 804 | 21.49% | 27 | 0.72% | 2,107 | 56.31% | 3,742 |
| Rutland | 5,690 | 69.79% | 2,421 | 29.69% | 42 | 0.52% | 3,269 | 40.10% | 8,153 |
| Washington | 3,611 | 62.67% | 1,927 | 33.44% | 224 | 3.89% | 1,684 | 29.23% | 5,762 |
| Windham | 4,637 | 76.37% | 1,426 | 23.48% | 9 | 0.15% | 3,211 | 52.88% | 6,072 |
| Windsor | 6,122 | 77.29% | 1,740 | 21.97% | 59 | 0.74% | 4,382 | 55.32% | 7,921 |
| Totals | 45,567 | 70.00% | 18,316 | 28.14% | 1,215 | 1.87% | 27,251 | 41.86% | 65,098 |
Notes
- These “other” votes were not recorded by county.
- These totals differ from those given in Dave Leip’s Atlas.
References
- "1880 Presidential Election Statistics". Dave Leip’s Atlas of U.S. Presidential Elections. Retrieved 2018-03-05.
- "1880 Presidential General Election Results - Vermont".
- Géoelections; Presidential election of 1880 Popular Vote (.xlsx file for €15)
- Géoelections; Presidential election of 1880 Popular Vote for James B. Weaver (.xlsx file for €15)
This article is issued from Wikipedia. The text is licensed under Creative Commons - Attribution - Sharealike. Additional terms may apply for the media files.


