Saskatoon—Humboldt
Saskatoon—Humboldt was a federal electoral district in Saskatchewan, Canada, that was represented in the House of Commons of Canada from 1968 to 1979, and from 1988 to 2015.
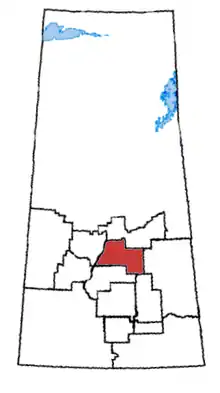 Saskatoon—Humboldt in relation to other Saskatchewan federal electoral districts | |
| Coordinates: | 52.506°N 105.174°W |
| Defunct federal electoral district | |
| Legislature | House of Commons |
| District created | 1987 |
| District abolished | 2013 |
| First contested | 1988 |
| Last contested | 2011 |
| District webpage | profile, map |
| Demographics | |
| Population (2011)[1] | 82,743 |
| Electors (2011) | 56,377 |
| Area (km²)[2] | 11,664.04 |
| Census subdivision(s) | Saskatoon, Humboldt, Corman Park No. 344 |
Geography
The riding consisted of the northeastern quadrant of Saskatoon and the city of Humboldt and the rural towns of Naicam, Wakaw and Watson. The riding extended to Quill Lake in the east, Pleasantdale in the northeast and St. Louis in the north.
History
This electoral district was first created in 1966 from Humboldt—Melfort, Rosthern (electoral district) and Saskatoon ridings.
It was abolished in 1976 and divided amongst Humboldt—Lake Centre, Prince Albert and Saskatoon East ridings. It was re-created in 1987 from Humboldt—Lake Centre, Prince Albert and Saskatoon East ridings.
It was abolished in 2013. Most of the Saskatoon portion became part of Saskatoon—University, with a smaller portion going to Saskatoon—Grasswood. The rural portion was split between Carlton Trail—Eagle Creek, Yorkton—Melville and Moose Jaw—Lake Centre—Lanigan.
Members of Parliament
This riding has elected the following members of the House of Commons:
| Parliament | Years | Member | Party | |
|---|---|---|---|---|
| Saskatoon—Humboldt Riding created from Humboldt—Melfort, Rosthern and Saskatoon |
||||
| 28th | 1968–1972 | Otto Lang | Liberal | |
| 29th | 1972–1974 | |||
| 30th | 1974–1979 | |||
| Riding dissolved into Humboldt—Lake Centre, Prince Albert and Saskatoon East | ||||
| Riding re-created from Humboldt—Lake Centre, Prince Albert and Saskatoon East | ||||
| 34th | 1988–1993 | Stan Hovdebo | New Democratic | |
| 35th | 1993–1997 | Georgette Sheridan | Liberal | |
| 36th | 1997–2000 | Jim Pankiw | Reform | |
| 2000–2000 | Alliance | |||
| 37th | 2000–2002 | |||
| 2002–2004 | Independent | |||
| 38th | 2004–2006 | Brad Trost | Conservative | |
| 39th | 2006–2008 | |||
| 40th | 2008–2011 | |||
| 41st | 2011–2015 | |||
| Riding dissolved into Carlton Trail—Eagle Creek, Yorkton—Melville, Moose Jaw—Lake Centre—Lanigan, Saskatoon—University and Saskatoon—Grasswood |
||||
Political geography
Once a safe Liberal seat, the NDP took over the new creation in 1988. The Liberals stole it back in 1993, but the Reform party and its successor the Canadian Alliance took it over with a strong win in 2000. However, the riding remained split three ways between the Liberals, the new Conservative Party and the NDP. In 2004, with the incumbent, Jim Pankiw running as an independent on the ticket made for the closest four-way race in the country with the winning party receiving just 26.7% of the vote just 4.5 points ahead of the fourth place finisher.
Election results
1988–2011
| 2011 Canadian federal election | ||||||||
|---|---|---|---|---|---|---|---|---|
| Party | Candidate | Votes | % | ±% | Expenditures | |||
| Conservative | Brad Trost | 19,954 | 52.7 | -1.1 | $61,713 | |||
| New Democratic | Denise Kouri | 13,271 | 35.1 | +7.3 | $72,371 | |||
| Liberal | Darren Hill | 3,013 | 8.0 | -4.0 | $45,694 | |||
| Green | Sandra Finley | 926 | 2.4 | -4.0 | $5,443 | |||
| Independent | Jim Pankiw | 682 | 1.8 | – | – | |||
| Total valid votes/Expense limit | 37,846 | 100.0 | – | |||||
| Total rejected ballots | 106 | 0.3 | +0.1 | |||||
| Turnout | 37,952 | 67.7 | +6.2 | |||||
| Eligible voters | 56,047 | – | – | |||||
| 2008 Canadian federal election | ||||||||
|---|---|---|---|---|---|---|---|---|
| Party | Candidate | Votes | % | ±% | Expenditures | |||
| Conservative | Brad Trost | 18,610 | 53.8 | +4.7 | $57,441 | |||
| New Democratic | Scott Ruston | 9,632 | 27.8 | -1.7 | $43,654 | |||
| Liberal | Karen Parhar | 4,135 | 12.0 | -4.9 | $27,728 | |||
| Green | Jean-Pierre Ducasse | 2,211 | 6.4 | +2.7 | $5,910 | |||
| Total valid votes/Expense limit | 34,588 | 100.0 | $80,987 | |||||
| Total rejected ballots | 83 | 0.2 | 0.0 | |||||
| Turnout | 34,671 | 61.5 | -5 | |||||
| 2006 Canadian federal election | ||||||||
|---|---|---|---|---|---|---|---|---|
| Party | Candidate | Votes | % | ±% | Expenditures | |||
| Conservative | Brad Trost | 18,285 | 49.1 | +22.4 | $70,424 | |||
| New Democratic | Andrew Mason | 10,975 | 29.5 | +3.9 | $51,091 | |||
| Liberal | Peter Stroh | 6,281 | 16.9 | -8.6 | $44,850 | |||
| Green | Mike Jones | 1,382 | 3.7 | +1.8 | $1,814 | |||
| Independent | Tim Nyborg | 342 | 0.9 | – | $1,160 | |||
| Total valid votes | 37,265 | 100.0 | – | |||||
| Total rejected ballots | 90 | 0.2 | 0.0 | |||||
| Turnout | 37,355 | 67 | +4 | |||||
| 2004 Canadian federal election | ||||||||
|---|---|---|---|---|---|---|---|---|
| Party | Candidate | Votes | % | ±% | Expenditures | |||
| Conservative | Brad Trost | 9,444 | 26.7 | -23.0 | $61,922 | |||
| New Democratic | Nettie Wiebe | 9,027 | 25.6 | -0.9 | $58,415 | |||
| Liberal | Patrick Wolfe | 9,009 | 25.5 | +3.8 | $66,060 | |||
| Independent | Jim Pankiw | 7,076 | 20.0 | – | $73,828 | |||
| Green | Ron Schriml | 680 | 1.9 | +0.6 | $25 | |||
| Independent | Larry Zarysky | 71 | 0.2 | – | $2,594 | |||
| Total valid votes | 35,307 | 100.0 | – | |||||
| Total rejected ballots | 66 | 0.2 | 0.0 | |||||
| Turnout | 35,373 | 63 | -1 | |||||
| 2000 Canadian federal election | ||||||||
|---|---|---|---|---|---|---|---|---|
| Party | Candidate | Votes | % | ±% | Expenditures | |||
| Alliance | Jim Pankiw | 15,780 | 44.3 | +11.2 | $57,144 | |||
| New Democratic | Armand Roy | 9,420 | 26.4 | -6.0 | $42,212 | |||
| Liberal | Morris Bodnar | 7,740 | 21.7 | -4.7 | $35,455 | |||
| Progressive Conservative | Lori K. Isinger | 1,963 | 5.5 | -1.9 | $8,073 | |||
| Green | Jason Hanson | 488 | 1.4 | – | $2,532 | |||
| Canadian Action | Michelle Luciuk | 245 | 0.7 | – | ||||
| Total valid votes | 35,636 | 100.0 | – | |||||
| Total rejected ballots | 81 | 0.2 | -0.2 | |||||
| Turnout | 35,717 | 64 | -1 | |||||
| 1997 Canadian federal election | ||||||||
|---|---|---|---|---|---|---|---|---|
| Party | Candidate | Votes | % | ±% | Expenditures | |||
| Reform | Jim Pankiw | 11,218 | 33.1 | +3.2 | $55,562 | |||
| New Democratic | Dennis Gruending | 10,998 | 32.4 | +9.6 | $59,376 | |||
| Liberal | Georgette Sheridan | 8,972 | 26.4 | -7.9 | $37,643 | |||
| Progressive Conservative | Paul Day | 2,499 | 7.4 | -2.1 | $13,911 | |||
| Natural Law | Harmon van Bergen | 234 | 0.7 | +0.0 | ||||
| Total valid votes | 33,921 | 100.0 | – | |||||
| Total rejected ballots | 135 | 0.4 | ||||||
| Turnout | 34,056 | 65 | ||||||
| 1993 Canadian federal election | ||||||||
|---|---|---|---|---|---|---|---|---|
| Party | Candidate | Votes | % | ±% | ||||
| Liberal | Georgette Sheridan | 12,837 | 34.4 | +13.7 | ||||
| Reform | Bob Head | 11,160 | 29.9 | |||||
| New Democratic | Barrett Halderman | 8,512 | 22.8 | -20.5 | ||||
| Progressive Conservative | Tom Gossen | 3,535 | 9.5 | -26.7 | ||||
| National | Larry Buhr | 900 | 2.4 | |||||
| Natural Law | Dale L. Monson | 255 | 0.7 | |||||
| Independent | Bryan Sandberg | 158 | 0.4 | |||||
| Total valid votes | 37,357 | 100.0 | ||||||
| 1988 Canadian federal election | ||||||||
|---|---|---|---|---|---|---|---|---|
| Party | Candidate | Votes | % | |||||
| New Democratic | Stan Hovdebo | 17,703 | 43.2 | +18.2 | ||||
| Progressive Conservative | Don Ravis | 14,793 | 36.1 | +11.6 | ||||
| Liberal | C.M. Red Williams | 8,442 | 20.6 | -28.6 | ||||
| Total valid votes | 40,938 | 100.0 | ||||||
1968–1979
| 1974 Canadian federal election | ||||||||
|---|---|---|---|---|---|---|---|---|
| Party | Candidate | Votes | % | ±% | ||||
| Liberal | Otto Lang | 23,243 | 49.2 | 3.7 | ||||
| New Democratic | Julius Friesen | 11,826 | 25.1 | -5.2 | ||||
| Progressive Conservative | Eugène Rhéaume | 11,592 | 24.6 | +1.5 | ||||
| Social Credit | Garry Holtorf | 548 | 1.2 | +0.3 | ||||
| Total valid votes | 47,209 | 100.0 | ||||||
| 1972 Canadian federal election | ||||||||
|---|---|---|---|---|---|---|---|---|
| Party | Candidate | Votes | % | ±% | ||||
| Liberal | Otto Lang | 24,733 | 45.5 | +11.2 | ||||
| New Democratic | George Taylor | 16,426 | 30.2 | -2.8 | ||||
| Progressive Conservative | Lewis Brand | 12,533 | 23.1 | -9.5 | ||||
| Social Credit | Gerald G. Black | 463 | 0.9 | |||||
| Independent | James Reid | 102 | 0.2 | |||||
| Independent | Brian Zamulinski | 89 | 0.2 | |||||
| Total valid votes | 54,346 | 100.0 | ||||||
| 1968 Canadian federal election | ||||||||
|---|---|---|---|---|---|---|---|---|
| Party | Candidate | Votes | % | |||||
| Liberal | Otto Lang | 15,210 | 34.3 | |||||
| New Democratic | George Taylor | 14,655 | 33.1 | |||||
| Progressive Conservative | Lewis Brand | 14,444 | 32.6 | |||||
| Total valid votes | 54,346 | 100.0 | ||||||
References
- "(Code 47009) Census Profile". 2011 census. Statistics Canada. 2012. Retrieved 2011-03-03.
- Riding history for Saskatoon—Humboldt (1966–1976) from the Library of Parliament
- Riding history for Saskatoon—Humboldt (1987–present) from the Library of Parliament
- Expenditures – 2008
- Expenditures – 2004
- Expenditures – 2000
- Expenditures – 1997
Notes
- Statistics Canada: 2012
- Statistics Canada: 2012
.png.webp)