Saskatoon—Wanuskewin
Saskatoon—Wanuskewin was a federal electoral district in Saskatchewan, Canada, that has been represented in the House of Commons of Canada since 1997. (In the Cree language: ᐋᐧᓇᐢᑫᐃᐧᐣ / wânaskêwin means, "being at peace with oneself".) It covers a part of the city of Saskatoon.
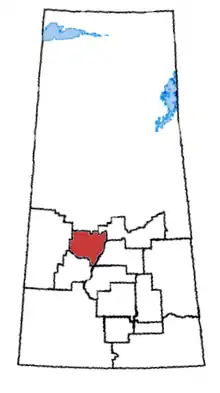 Saskatoon—Wanuskewin in relation to other Saskatchewan federal electoral districts | |
| Coordinates: | 52.624°N 106.890°W |
| Defunct federal electoral district | |
| Legislature | House of Commons |
| District created | 1996 |
| District abolished | 2013 |
| First contested | 1997 |
| Last contested | 2011 |
| District webpage | profile, map |
| Demographics | |
| Population (2011)[1] | 82,553 |
| Electors (2011) | 55,327 |
| Area (km²)[2] | 10,233.82 |
| Census division(s) | Saskatoon |
| Census subdivision(s) | Saskatoon, Corman Park No. 344, Martensville, Warman |
Geography
The riding includes the northwest quadrant of Saskatoon and extends north past Duck Lake, northwest past Lucky Man and west past Ruddell. The riding also includes the city of Martensville.
History
It was created in 1996 as "Wanuskewin" from Saskatoon—Clark's Crossing and portions of Kindersley—Lloydminster, Prince Albert—Churchill River and The Battlefords—Meadow Lake ridings.
In 2000, it was renamed "Saskatoon—Wanuskewin".
The electoral district was abolished in 2013 and now is contained within the bounds of Carlton Trail—Eagle Creek.
Members of Parliament
| Parliament | Years | Member | Party | |
|---|---|---|---|---|
| Wanuskewin Riding created from Saskatoon—Clark's Crossing, Kindersley—Lloydminster, Prince Albert—Churchill River and The Battlefords—Meadow Lake |
||||
| 36th | 1997–2000 | Maurice Vellacott | Reform | |
| 2000–2000 | Alliance | |||
| Riding renamed — Saskatoon—Wanuskewin | ||||
| 37th | 2000–2003 | Maurice Vellacott | Alliance | |
| 2003–2004 | Conservative | |||
| 38th | 2004–2006 | |||
| 39th | 2006–2008 | |||
| 40th | 2008–2011 | |||
| 41st | 2011–2015 | |||
| Riding dissolved into Carlton Trail—Eagle Creek, Saskatoon West, Prince Albert and Desnethé—Missinippi—Churchill River |
||||
Election results
Saskatoon–Wanuskewin
| 2011 Canadian federal election | ||||||||
|---|---|---|---|---|---|---|---|---|
| Party | Candidate | Votes | % | ±% | Expenditures | |||
| Conservative | Maurice Vellacott | 21,183 | 58.43 | +1.92 | $34,890 | |||
| New Democratic | John Parry | 11,395 | 31.43 | +7.07 | $16,104 | |||
| Liberal | Patricia Zipchen | 2,428 | 6.70 | -5.70 | $15,022 | |||
| Green | Mark Bigland-Pritchard | 1,250 | 3.45 | -3.28 | $991 | |||
| Total valid votes/Expense limit | 36,256 | 100.00 | $83,569 | |||||
| Total rejected ballots | 134 | 0.37 | +0.06 | |||||
| Turnout | 36,390 | 64.33 | +5.55 | |||||
| Eligible voters | 56,570 | – | – | |||||
| 2008 Canadian federal election | ||||||||
|---|---|---|---|---|---|---|---|---|
| Party | Candidate | Votes | % | ±% | Expenditures | |||
| Conservative | Maurice Vellacott | 18,320 | 56.51 | +7.12 | $36,224 | |||
| New Democratic | Clint Davidson | 7,898 | 24.36 | +2.28 | $20,679 | |||
| Liberal | Patricia Zipchen | 4,020 | 12.40 | -11.68 | $13,240 | |||
| Green | Tobi-Dawne Smith | 2,182 | 6.73 | +3.14 | $3,675 | |||
| Total valid votes/Expense limit | 32,420 | 100.00 | $80,396 | |||||
| Total rejected ballots | 100 | 0.31 | +0.04 | |||||
| Turnout | 32,520 | 58.78 | -8.57 | |||||
| 2006 Canadian federal election | ||||||||
|---|---|---|---|---|---|---|---|---|
| Party | Candidate | Votes | % | ±% | Expenditures | |||
| Conservative | Maurice Vellacott | 17,753 | 49.39 | +2.74 | $62,331.71 | |||
| Liberal | Chris Axworthy | 8,655 | 24.08 | −8.50 | $52,437.43 | |||
| New Democratic | Jim Maddin | 7,939 | 22.09 | +4.27 | $35,098.35 | |||
| Green | Don Cameron | 1,292 | 3.59 | +0.63 | $880.29 | |||
| Christian Heritage | Dale Sanders | 307 | 0.85 | −0.90 | $1,552.99 | |||
| Total valid votes | 35,946 | 100.00 | ||||||
| Total rejected ballots | 96 | 0.27 | +0.03 | |||||
| Turnout | 36,042 | 67.35 | +7.63 | |||||
| Electors on the lists | 53,513 | |||||||
| 2004 Canadian federal election | ||||||||
|---|---|---|---|---|---|---|---|---|
| Party | Candidate | Votes | % | ±% | Expenditures | |||
| Conservative | Maurice Vellacott | 15,109 | 46.64 | −11.09 | $66,433.82 | |||
| Liberal | Chris Axworthy | 10,553 | 32.58 | +15.76 | $72,269.97 | |||
| New Democratic | Priscilla Settee | 5,770 | 17.81 | −6.42 | $38,635.22 | |||
| Green | David Greenfield | 960 | 2.96 | +1.75 | $25.00 | |||
| Total valid votes | 32,392 | 100.00 | ||||||
| Total rejected ballots | 76 | 0.23 | −0.03 | |||||
| Turnout | 32,468 | 59.72 | −1.90 | |||||
| Electors on the lists | 54,366 | |||||||
| Percentage change figures are factored for redistribution. Conservative Party percentages are contrasted with the combined Canadian Alliance and Progressive Conservative percentages from 2000. | ||||||||
| Sources: Official Results, Elections Canada and Financial Returns, Elections Canada. | ||||||||
| 2000 Canadian federal election | ||||||||
|---|---|---|---|---|---|---|---|---|
| Party | Candidate | Votes | % | ±% | Expenditures | |||
| Alliance | Maurice Vellacott | 17,404 | 52.57 | +13.42 | $59,707.59 | |||
| New Democratic | Hugh Walker | 8,022 | 24.23 | −2.55 | $34,545.31 | |||
| Liberal | Bill Patrick | 5,567 | 16.82 | −7.61 | $16,493.01 | |||
| Progressive Conservative | Kirk Eggum | 1,709 | 5.16 | −2.76 | $0.00 | |||
| Green | David Greenfield | 402 | 1.21 | $0.00 | ||||
| Total valid votes | 33,104 | 100.00 | ||||||
| Total rejected ballots | 86 | 0.26 | −0.08 | |||||
| Turnout | 33,190 | 61.62 | −2.17 | |||||
| Electors on the lists | 53,862 | |||||||
| Sources: Official Results, Elections Canada and Financial Returns, Elections Canada. | ||||||||
Wanuskewin
| 1997 Canadian federal election: Wanuskewin | ||||||||
|---|---|---|---|---|---|---|---|---|
| Party | Candidate | Votes | % | Expenditures | ||||
| Reform | Maurice Vellacott | 12,854 | 39.16 | $39,845 | ||||
| New Democratic | Walter Kyliuk | 8,793 | 26.79 | $57,104 | ||||
| Liberal | Tom Hengen | 8,020 | 24.43 | $35,221 | ||||
| Progressive Conservative | Ron Meakin | 2,602 | 7.93 | $7,207 | ||||
| Independent | Sam Dyck | 420 | 1.28 | $1,781 | ||||
| Natural Law | Patrick J. Coulterman | 138 | 0.42 | $61 | ||||
| Total valid votes | 32,827 | 100.00 | ||||||
| Total rejected ballots | 112 | 0.34 | ||||||
| Turnout | 32,939 | 63.79 | ||||||
| Electors on the lists | 51,635 | |||||||
| Sources: Official Results, Elections Canada and Financial Returns, Elections Canada. | ||||||||
References
- "(Code 47011) Census Profile". 2011 census. Statistics Canada. 2012. Retrieved 2011-03-03.
Notes
- Statistics Canada: 2012
- Statistics Canada: 2012
.png.webp)