1964 United States presidential election in Arkansas
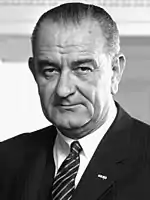
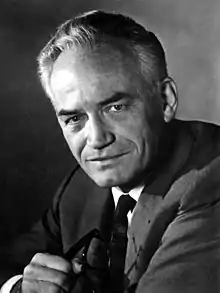
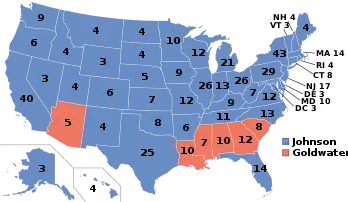
The 1964 presidential election in Arkansas was held on November 3, 1964. Voters chose six electors, or representatives to the Electoral College, who voted for president and vice president. Incumbent President Lyndon B. Johnson won the state of Arkansas with 56.06% of the popular vote,[1] which was a substantial increase upon John F. Kennedy's 50.19% from the preceding election, although the Republican vote remained virtually unchanged at 43.41%. Johnson won all but ten of Arkansas' seventy-five counties, and all four congressional districts. As of the 2020 presidential election, this is the last election in which Arkansas voted for a different candidate than neighboring Louisiana.
| ||||||||||||||||||||||||||
| ||||||||||||||||||||||||||
 County Results
| ||||||||||||||||||||||||||
| ||||||||||||||||||||||||||
| Elections in Arkansas |
|---|
 |
Background
Given the segregationism of its long-serving governor Orval Faubus, who had gained almost seven percent of the vote in the preceding presidential election, Arkansas would have seemed potentially likely to succumb to Goldwater due to his opposition to the recent Civil Rights Act. However, the GOP's nomination of the moderate Winthrop Rockefeller in the party's first serious run for governor in the state since Reconstruction took the steam out of a Goldwater challenge.[2] Faubus refused to endorse Goldwater,[3] despite hesitating over this during the summer. In addition, many white southerners commented to the effect that
Goldwater is right on the black man, and that is very important. But he is so wrong on everything else I can't bring myself to vote for him.[4]
In mid-July, Texas Governor John Connally had made private polls suggesting that Johnson would lose Arkansas, as well as the hopeless Deep South states of Mississippi and Alabama.[5] Nonetheless, that the increase in black registration in the Natural State had exceeded Kennedy's margin in 1960 suggested that Johnson's civil rights legislation did have some potential to help him,[5] and in early August polls suddenly became confident Johnson would carry the state due to Goldwater's policies of privatizing Social Security and expanding the war in Southeast Asia – a policy that did not play well in this isolationist state.[6] By October, a New York Times poll saw Arkansas as "safe" for Johnson[7] and his leads in polls increased as election day came closer.[8]
Ultimately, Johnson comfortably carried Arkansas, becoming the twenty-third and last consecutive Democratic presidential nominee to win the state; however, anti-civil rights feeling did cause Arkansas to vote 9.92 percentage points more Republican than the nation at-large – this being the first time in 96 years when it had voted less Democratic than the nation.
Johnson doubled Kennedy's margin, and reclaimed the counties of Clay, Craighead, Fulton, Marion, Randolph and Sharp, which in 1960 had defected to the GOP for the first time ever or since Reconstruction as a result of powerful anti-Catholicism.[9] Johnson also claimed thirteen other Ozark counties which had supported Nixon in 1960.
However, in the Delta and south of the state sufficient backlash against black civil rights occurred for Goldwater to claim six counties in those regions from the Democrats.[10] Of these, only state namesake Arkansas County had ever been carried by a Republican since the McKinley era.[lower-alpha 1] Ashley County and Drew County voted Republican for the first time since James G. Blaine in 1884,[11] Union County for the first time since Reconstruction, while Goldwater was the first Republican to ever carry Columbia and Howard Counties.[10]
Results
| 1964 United States presidential election in Arkansas | |||||
|---|---|---|---|---|---|
| Party | Candidate | Votes | Percentage | Electoral votes | |
| Democratic | Lyndon Johnson | 314,197 | 56.06% | 6 | |
| Republican | Barry Goldwater | 243,264 | 43.41% | 0 | |
| National States' Rights | John Kasper | 2,965 | 0.53% | 0 | |
| Totals | 560,426 | 100.00% | 6 | ||
| Voter turnout (Voting age/Registered Voters) | 50.6%/78.3% | ||||
Results by county
| County | Lyndon Baines Johnson Democratic |
Barry Morris Goldwater Republican |
John Kasper National States’ Rights |
Margin | Total votes cast | ||||
|---|---|---|---|---|---|---|---|---|---|
| # | % | # | % | # | % | # | % | ||
| Arkansas | 3,200 | 45.78% | 3,769 | 53.92% | 21 | 0.30% | -569 | -8.14% | 6,990 |
| Ashley | 2,901 | 43.23% | 3,742 | 55.77% | 67 | 1.00% | -841 | -12.53% | 6,710 |
| Baxter | 2,900 | 59.29% | 1,986 | 40.61% | 5 | 0.10% | 914 | 18.69% | 4,891 |
| Benton | 5,655 | 48.49% | 5,977 | 51.25% | 30 | 0.26% | -322 | -2.76% | 11,662 |
| Boone | 3,770 | 56.73% | 2,857 | 42.99% | 19 | 0.29% | 913 | 13.74% | 6,646 |
| Bradley | 2,229 | 54.34% | 1,852 | 45.15% | 21 | 0.51% | 377 | 9.19% | 4,102 |
| Calhoun | 1,409 | 60.68% | 889 | 38.29% | 24 | 1.03% | 520 | 22.39% | 2,322 |
| Carroll | 2,005 | 48.78% | 2,105 | 51.22% | 0 | 0.00% | -100 | -2.43% | 4,110 |
| Chicot | 2,916 | 59.47% | 1,972 | 40.22% | 15 | 0.31% | 944 | 19.25% | 4,903 |
| Clark | 4,127 | 68.36% | 1,884 | 31.21% | 26 | 0.43% | 2,243 | 37.15% | 6,037 |
| Clay | 3,280 | 61.64% | 1,999 | 37.57% | 42 | 0.79% | 1,281 | 24.07% | 5,321 |
| Cleburne | 2,645 | 68.26% | 1,221 | 31.51% | 9 | 0.23% | 1,424 | 36.75% | 3,875 |
| Cleveland | 1,121 | 51.78% | 1,026 | 47.39% | 18 | 0.83% | 95 | 4.39% | 2,165 |
| Columbia | 3,485 | 46.26% | 4,009 | 53.22% | 39 | 0.52% | -524 | -6.96% | 7,533 |
| Conway | 4,205 | 63.69% | 2,378 | 36.02% | 19 | 0.29% | 1,827 | 27.67% | 6,602 |
| Craighead | 8,334 | 61.55% | 5,163 | 38.13% | 44 | 0.32% | 3,171 | 23.42% | 13,541 |
| Crawford | 3,537 | 51.62% | 3,294 | 48.07% | 21 | 0.31% | 243 | 3.55% | 6,852 |
| Crittenden | 4,168 | 50.20% | 4,065 | 48.96% | 69 | 0.83% | 103 | 1.24% | 8,302 |
| Cross | 2,421 | 52.86% | 2,147 | 46.88% | 12 | 0.26% | 274 | 5.98% | 4,580 |
| Dallas | 1,779 | 51.61% | 1,625 | 47.14% | 43 | 1.25% | 154 | 4.47% | 3,447 |
| Desha | 3,294 | 62.91% | 1,930 | 36.86% | 12 | 0.23% | 1,364 | 26.05% | 5,236 |
| Drew | 1,980 | 48.05% | 2,109 | 51.18% | 32 | 0.78% | -129 | -3.13% | 4,121 |
| Faulkner | 6,116 | 64.95% | 3,259 | 34.61% | 42 | 0.45% | 2,857 | 30.34% | 9,417 |
| Franklin | 2,685 | 62.47% | 1,580 | 36.76% | 33 | 0.77% | 1,105 | 25.71% | 4,298 |
| Fulton | 1,704 | 66.64% | 846 | 33.09% | 7 | 0.27% | 858 | 33.55% | 2,557 |
| Garland | 11,591 | 53.59% | 9,952 | 46.01% | 86 | 0.40% | 1,639 | 7.58% | 21,629 |
| Grant | 1,678 | 55.07% | 1,308 | 42.93% | 61 | 2.00% | 370 | 12.14% | 3,047 |
| Greene | 4,742 | 67.39% | 2,271 | 32.27% | 24 | 0.34% | 2,471 | 35.11% | 7,037 |
| Hempstead | 3,355 | 56.95% | 2,493 | 42.32% | 43 | 0.73% | 862 | 14.63% | 5,891 |
| Hot Spring | 4,543 | 60.40% | 2,911 | 38.70% | 68 | 0.90% | 1,632 | 21.70% | 7,522 |
| Howard | 1,320 | 43.10% | 1,649 | 53.84% | 94 | 3.07% | -329 | -10.74% | 3,063 |
| Independence | 4,455 | 64.01% | 2,470 | 35.49% | 35 | 0.50% | 1,985 | 28.52% | 6,960 |
| Izard | 1,736 | 69.83% | 726 | 29.20% | 24 | 0.97% | 1,010 | 40.63% | 2,486 |
| Jackson | 4,651 | 68.12% | 2,141 | 31.36% | 36 | 0.53% | 2,510 | 36.76% | 6,828 |
| Jefferson | 12,872 | 56.04% | 9,968 | 43.40% | 129 | 0.56% | 2,904 | 12.64% | 22,969 |
| Johnson | 3,127 | 66.77% | 1,535 | 32.78% | 21 | 0.45% | 1,592 | 34.00% | 4,683 |
| Lafayette | 1,484 | 50.02% | 1,476 | 49.75% | 7 | 0.24% | 8 | 0.27% | 2,967 |
| Lawrence | 3,498 | 63.16% | 2,013 | 36.35% | 27 | 0.49% | 1,485 | 26.81% | 5,538 |
| Lee | 2,335 | 58.21% | 1,668 | 41.59% | 8 | 0.20% | 667 | 16.63% | 4,011 |
| Lincoln | 2,468 | 63.58% | 1,410 | 36.32% | 4 | 0.10% | 1,058 | 27.25% | 3,882 |
| Little River | 2,040 | 63.87% | 1,141 | 35.72% | 13 | 0.41% | 899 | 28.15% | 3,194 |
| Logan | 3,604 | 61.13% | 2,265 | 38.42% | 27 | 0.46% | 1,339 | 22.71% | 5,896 |
| Lonoke | 3,818 | 51.06% | 3,636 | 48.63% | 23 | 0.31% | 182 | 2.43% | 7,477 |
| Madison | 2,715 | 57.45% | 1,997 | 42.26% | 14 | 0.30% | 718 | 15.19% | 4,726 |
| Marion | 1,661 | 60.20% | 1,088 | 39.43% | 10 | 0.36% | 573 | 20.77% | 2,759 |
| Miller | 5,190 | 54.68% | 4,253 | 44.81% | 49 | 0.52% | 937 | 9.87% | 9,492 |
| Mississippi | 8,678 | 58.20% | 6,213 | 41.67% | 20 | 0.13% | 2,465 | 16.53% | 14,911 |
| Monroe | 2,258 | 53.29% | 1,968 | 46.45% | 11 | 0.26% | 290 | 6.84% | 4,237 |
| Montgomery | 1,358 | 61.67% | 832 | 37.78% | 12 | 0.54% | 526 | 23.89% | 2,202 |
| Nevada | 2,190 | 60.41% | 1,406 | 38.79% | 29 | 0.80% | 784 | 21.63% | 3,625 |
| Newton | 1,374 | 49.62% | 1,357 | 49.01% | 38 | 1.37% | 17 | 0.61% | 2,769 |
| Ouachita | 7,056 | 65.96% | 3,572 | 33.39% | 70 | 0.65% | 3,484 | 32.57% | 10,698 |
| Perry | 1,320 | 55.30% | 1,048 | 43.90% | 19 | 0.80% | 272 | 11.40% | 2,387 |
| Phillips | 5,818 | 59.43% | 3,963 | 40.48% | 9 | 0.09% | 1,855 | 18.95% | 9,790 |
| Pike | 1,531 | 54.93% | 1,241 | 44.53% | 15 | 0.54% | 290 | 10.41% | 2,787 |
| Poinsett | 5,635 | 64.93% | 3,031 | 34.92% | 13 | 0.15% | 2,604 | 30.00% | 8,679 |
| Polk | 2,575 | 55.88% | 2,022 | 43.88% | 11 | 0.24% | 553 | 12.00% | 4,608 |
| Pope | 4,972 | 63.91% | 2,651 | 34.07% | 157 | 2.02% | 2,321 | 29.83% | 7,780 |
| Prairie | 1,812 | 54.74% | 1,476 | 44.59% | 22 | 0.66% | 336 | 10.15% | 3,310 |
| Pulaski | 40,535 | 51.12% | 38,312 | 48.32% | 442 | 0.56% | 2,223 | 2.80% | 79,289 |
| Randolph | 2,680 | 66.85% | 1,312 | 32.73% | 17 | 0.42% | 1,368 | 34.12% | 4,009 |
| St. Francis | 3,651 | 51.88% | 3,377 | 47.98% | 10 | 0.14% | 274 | 3.89% | 7,038 |
| Saline | 5,605 | 60.18% | 3,628 | 38.96% | 80 | 0.86% | 1,977 | 21.23% | 9,313 |
| Scott | 1,838 | 62.01% | 1,121 | 37.82% | 5 | 0.17% | 717 | 24.19% | 2,964 |
| Searcy | 1,508 | 47.68% | 1,649 | 52.13% | 6 | 0.19% | -141 | -4.46% | 3,163 |
| Sebastian | 10,299 | 43.84% | 13,110 | 55.80% | 84 | 0.36% | -2,811 | -11.97% | 23,493 |
| Sevier | 2,123 | 62.75% | 1,249 | 36.92% | 11 | 0.33% | 874 | 25.84% | 3,383 |
| Sharp | 1,810 | 59.40% | 1,215 | 39.88% | 22 | 0.72% | 595 | 19.53% | 3,047 |
| Stone | 1,374 | 58.72% | 942 | 40.26% | 24 | 1.03% | 432 | 18.46% | 2,340 |
| Union | 6,948 | 44.60% | 8,472 | 54.38% | 160 | 1.03% | -1,524 | -9.78% | 15,580 |
| Van Buren | 2,054 | 61.28% | 1,270 | 37.89% | 28 | 0.84% | 784 | 23.39% | 3,352 |
| Washington | 10,166 | 59.55% | 6,856 | 40.16% | 48 | 0.28% | 3,310 | 19.39% | 17,070 |
| White | 6,566 | 56.20% | 5,023 | 42.99% | 95 | 0.81% | 1,543 | 13.21% | 11,684 |
| Woodruff | 2,307 | 62.47% | 1,366 | 36.99% | 20 | 0.54% | 941 | 25.48% | 3,693 |
| Yell | 3,407 | 68.86% | 1,527 | 30.86% | 14 | 0.28% | 1,880 | 38.00% | 4,948 |
| Totals | 314,197 | 56.06% | 243,264 | 43.41% | 2,965 | 0.53% | 70,933 | 12.66% | 560,426 |
References
- "1964 Presidential General Election Results – Arkansas". Retrieved January 8, 2017.
- Johnson, Robert David; All the Way with LBJ: The 1964 Presidential Election, p. 225 ISBN 0521737524
- Bass, Jack and De Vries, Walter; The Transformation of Southern Politics Social Change and Political Consequence Since 1945, p. 93 ISBN 0820317284
- Converse, Philip E., Clausen, Åge R. and Miller, Warren E.; 'Electoral Myth and Reality: The 1964 Election'; The American Political Science Review, Vol. 59, No. 2 (June 1965), pp. 321–336
- Johnson; All the Way with LBJ, p. 168
- Roberts, Chalmers M.; 'Goldwater Riding High in South, Survey Finds: Has Firm Hold on Mississippi, Alabama, Louisiana and Florida; Texas Rates Tossup'; Los Angeles Times, August 2, 1964, p. I2
- Wicker, Tom; 'Big Johnson Lead Found in Survey'; The New York Times, October 6, 1964, pp. 1, 28
- Johnson; All the Way with LBJ, p. 275
- Menendez, Albert J.; The Geography of Presidential Elections in the United States, 1868-2004, p. 87 ISBN 0786422173
- Menendez; The Geography of Presidential Elections in the United States, p. 91
- Menendez; The Geography of Presidential Elections in the United States, pp. 149–153
Notes
- Arkansas County had voted for Warren G. Harding in 1920 and twice for Dwight D. Eisenhower.


