1964 United States presidential election in Idaho
The 1964 United States presidential election in Idaho took place on November 3, 1964, as part of the 1964 United States presidential election, which was held throughout all 50 states and D.C. Voters chose four representatives, or electors to the Electoral College, who voted for president and vice president.
| ||||||||||||||||||||||||||
| ||||||||||||||||||||||||||
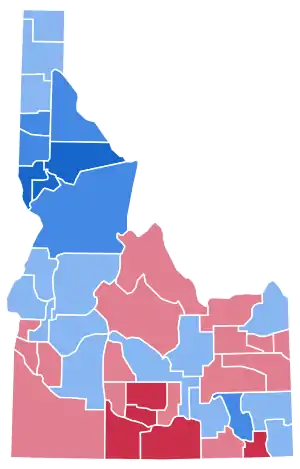 County Results
| ||||||||||||||||||||||||||
| ||||||||||||||||||||||||||
| Elections in Idaho |
|---|
 |
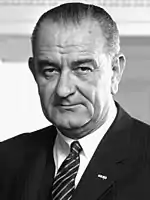
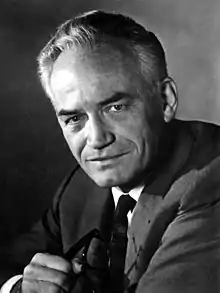
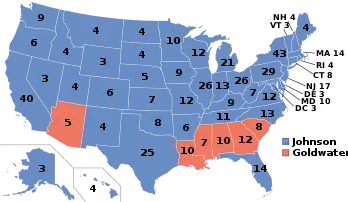
Idaho was one of 44 states carried in a national landslide by incumbent President Lyndon B. Johnson. However, it was the weakest state that Johnson carried in the election. Johnson carried the state by a margin of 5,363 votes, or 1.83%, making Idaho’s vote about 20.75 percent more Republican than the national average. Johnson’s strongest performances were in Clearwater and Lewis counties where he took over 76% of the vote. Goldwater’s strongest performance was Jerome County, taking 63% of the vote. While Johnson carried slightly over half of the state’s 44 counties, Goldwater carried the more populated counties such as Ada, Bonneville, Canyon and Twin Falls, thus keeping the vote close.
This is the last presidential election where Idaho was carried by a Democrat, and had Goldwater carried Idaho, the Gem State would have had the outright longest streak of consecutive Republican wins, last voting Democratic in 1948. Such a run of success for one party has been exceeded only in the Deep South and by the Republicans in Vermont between 1856 and 1960. Although Goldwater lost, this election solidified Idaho as a stronghold of the Republican Party, for the state trended 13.02 percentage points Republican relative to the national swing – the smallest Democratic swing outside the old Confederacy. In eight counties,[lower-alpha 1] Goldwater gained a higher proportion of the vote than Richard Nixon had four years earlier – a result observed in only nine other counties outside antebellum slave states.[1] Apart from massively Catholic Emmons County, North Dakota, Camas and Custer were the solitary counties outside antebellum slave states to vote for Kennedy in 1960 and Goldwater in 1964.[1]
No Democrat since Johnson has been able to get forty percent of Idaho’s popular vote, whilst the only Republicans to fail to pass fifty-five percent have been George H. W. Bush in 1992 and Bob Dole in 1996,[2][3] when strong third-party candidacies from Ross Perot distorted results.
At a more local level, the only counties in Idaho to have ever given a Democrat majority or plurality since 1968 have been Teton in the far east, Blaine in the centre of the state, and the seven northern counties of, clockwise from north, Bonner, Shoshone, Clearwater, Lewis, Nez Perce, Latah, and Benewah Counties.[4] Of these, Bonner County was carried only by a narrow Bill Clinton plurality in 1992 as a result of strong support for Ross Perot cutting into the Republican vote[5] whilst Benewah County were carried only by a narrow Carter majority in 1976[6] and Bill Clinton plurality in 1992. All forty-four Idaho counties voted Republican in 1972, 1980 and 1984, only Blaine County voted for Gore in 2000 and Kerry in 2004, and since then only Latah and Teton Counties have been remotely competitive electorally. As a result, this remains the last election in which Kootenai County, Bannock County, Elmore County, Gem County, Idaho County, Fremont County, Boundary County, Washington County, Valley County, Power County, Boise County, Caribou County, Bear Lake County, Adams County, and Butte County voted for a Democratic presidential candidate.[7]
Results
| Presidential candidate | Party | Home state | Popular vote | Electoral vote |
Running mate | |||
|---|---|---|---|---|---|---|---|---|
| Count | Percentage | Vice-presidential candidate | Home state | Electoral vote | ||||
| Lyndon B. Johnson | Democratic | Texas | 148,920 | 50.92% | 4 | Hubert Humphrey | Minnesota | 4 |
| Barry Goldwater | Republican | Arizona | 143,557 | 49.08% | 0 | William E. Miller | New York | 0 |
| Total | 292,477 | 100% | 4 | 4 | ||||
| Needed to win | 270 | 270 | ||||||
Results by county
| County | Lyndon Baines Johnson Democratic |
Barry Morris Goldwater Republican |
Margin | Total votes cast | |||
|---|---|---|---|---|---|---|---|
| # | % | # | % | # | % | ||
| Ada | 19,639 | 43.60% | 25,404 | 56.40% | -5,765 | -12.80% | 45,043 |
| Adams | 750 | 52.12% | 689 | 47.88% | 61 | 4.24% | 1,439 |
| Bannock | 13,483 | 63.28% | 7,825 | 36.72% | 5,658 | 26.55% | 21,308 |
| Bear Lake | 1,857 | 56.86% | 1,409 | 43.14% | 448 | 13.72% | 3,266 |
| Benewah | 1,796 | 64.67% | 981 | 35.33% | 815 | 29.35% | 2,777 |
| Bingham | 5,231 | 49.37% | 5,364 | 50.63% | -133 | -1.26% | 10,595 |
| Blaine | 1,293 | 52.69% | 1,161 | 47.31% | 132 | 5.38% | 2,454 |
| Boise | 450 | 52.08% | 414 | 47.92% | 36 | 4.17% | 864 |
| Bonner | 4,328 | 59.26% | 2,975 | 40.74% | 1,353 | 18.53% | 7,303 |
| Bonneville | 9,637 | 47.30% | 10,736 | 52.70% | -1,099 | -5.39% | 20,373 |
| Boundary | 1,418 | 57.11% | 1,065 | 42.89% | 353 | 14.22% | 2,483 |
| Butte | 848 | 56.65% | 649 | 43.35% | 199 | 13.29% | 1,497 |
| Camas | 258 | 44.95% | 316 | 55.05% | -58 | -10.10% | 574 |
| Canyon | 10,601 | 44.05% | 13,466 | 55.95% | -2,865 | -11.90% | 24,067 |
| Caribou | 1,422 | 52.18% | 1,303 | 47.82% | 119 | 4.37% | 2,725 |
| Cassia | 2,608 | 39.41% | 4,009 | 60.59% | -1,401 | -21.17% | 6,617 |
| Clark | 186 | 41.52% | 262 | 58.48% | -76 | -16.96% | 448 |
| Clearwater | 2,446 | 76.13% | 767 | 23.87% | 1,679 | 52.26% | 3,213 |
| Custer | 714 | 49.79% | 720 | 50.21% | -6 | -0.42% | 1,434 |
| Elmore | 2,310 | 55.44% | 1,857 | 44.56% | 453 | 10.87% | 4,167 |
| Franklin | 1,583 | 39.74% | 2,400 | 60.26% | -817 | -20.51% | 3,983 |
| Fremont | 1,970 | 50.32% | 1,945 | 49.68% | 25 | 0.64% | 3,915 |
| Gem | 2,328 | 54.05% | 1,979 | 45.95% | 349 | 8.10% | 4,307 |
| Gooding | 1,848 | 42.24% | 2,527 | 57.76% | -679 | -15.52% | 4,375 |
| Idaho | 3,188 | 61.57% | 1,990 | 38.43% | 1,198 | 23.14% | 5,178 |
| Jefferson | 2,061 | 42.93% | 2,740 | 57.07% | -679 | -14.14% | 4,801 |
| Jerome | 1,828 | 37.00% | 3,113 | 63.00% | -1,285 | -26.01% | 4,941 |
| Kootenai | 8,215 | 57.40% | 6,096 | 42.60% | 2,119 | 14.81% | 14,311 |
| Latah | 5,249 | 60.17% | 3,475 | 39.83% | 1,774 | 20.33% | 8,724 |
| Lemhi | 1,067 | 41.63% | 1,496 | 58.37% | -429 | -16.74% | 2,563 |
| Lewis | 1,557 | 76.17% | 487 | 23.83% | 1,070 | 52.35% | 2,044 |
| Lincoln | 617 | 38.90% | 969 | 61.10% | -352 | -22.19% | 1,586 |
| Madison | 1,949 | 48.12% | 2,101 | 51.88% | -152 | -3.75% | 4,050 |
| Minidoka | 2,827 | 47.61% | 3,111 | 52.39% | -284 | -4.78% | 5,938 |
| Nez Perce | 9,245 | 70.27% | 3,912 | 29.73% | 5,333 | 40.53% | 13,157 |
| Oneida | 768 | 40.87% | 1,111 | 59.13% | -343 | -18.25% | 1,879 |
| Owyhee | 1,168 | 48.99% | 1,216 | 51.01% | -48 | -2.01% | 2,384 |
| Payette | 2,508 | 47.57% | 2,764 | 52.43% | -256 | -4.86% | 5,272 |
| Power | 1,161 | 54.58% | 966 | 45.42% | 195 | 9.17% | 2,127 |
| Shoshone | 5,194 | 64.30% | 2,884 | 35.70% | 2,310 | 28.60% | 8,078 |
| Teton | 598 | 46.98% | 675 | 53.02% | -77 | -6.05% | 1,273 |
| Twin Falls | 7,638 | 39.87% | 11,518 | 60.13% | -3,880 | -20.25% | 19,156 |
| Valley | 1,126 | 53.47% | 980 | 46.53% | 146 | 6.93% | 2,106 |
| Washington | 1,952 | 53.01% | 1,730 | 46.99% | 222 | 6.03% | 3,682 |
| Totals | 148,920 | 50.92% | 143,557 | 49.08% | 5,363 | 1.83% | 292,477 |
Notes
References
- Menendez, Albert J.; The Geography of Presidential Elections in the United States, 1868-2004, p. 87 ISBN 0786422173
- "1964 Presidential General Election Results - Idaho". Dave Leip’s Atlas of U.S. Presidential Elections. Retrieved 2014-07-02.
- "1964 Presidential General Election Data Graphs – Idaho". Dave Leip’s Atlas of U.S. Presidential Elections. Retrieved 2014-07-02.
- Sullivan, Robert David; ‘How the Red and Blue Map Evolved Over the Past Century’; America Magazine in The National Catholic Review; June 29, 2016
- 1992 Presidential General Election Data Graphs – Idaho by County
- 1976 Presidential General Election Data Graphs – Idaho by County
- Sullivan, Robert David; ‘How the Red and Blue Map Evolved Over the Past Century’; America Magazine in The National Catholic Review; June 29, 2016
