1940 United States presidential election in Arkansas
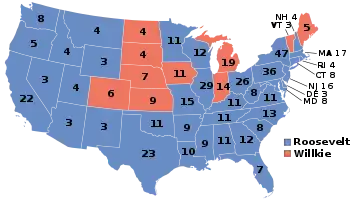
The 1940 United States presidential election in Arkansas took place on November 5, 1940, as part of the 1940 United States presidential election. Arkansas voters chose nine representatives, or electors, to the Electoral College, who voted for president and vice president.
| ||||||||||||||||||||||||||
| ||||||||||||||||||||||||||
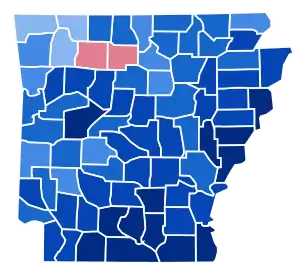 County Results
| ||||||||||||||||||||||||||
| ||||||||||||||||||||||||||
| Elections in Arkansas |
|---|
 |
Background
Except for the Unionist Ozark counties of Newton and Searcy where Republicans controlled local government, Arkansas since the end of Reconstruction had been a classic one-party Democratic “Solid South” state.[1] Disfranchisement of effectively all Negroes and most poor whites by a poll tax since 1890 meant that outside those two aberrant counties, the Republican Party was completely moribund and Democratic primaries the only competitive elections.
Increased voting by poor Ozark whites as a protest against Woodrow Wilson's internationalist foreign policy meant that Warren G. Harding in 1920 was able to win almost forty percent of the statewide vote;[2] and 1928 saw the rest of the Outer South and North Alabama bolt the anti-Prohibition Catholic Al Smith. However, the presence of Arkansas Senator Joseph Taylor Robinson as running mate meant that within Arkansas only the most northwesterly counties with ordinarily substantial Republican votes suffered the same fate.[3]
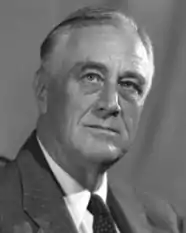
The following years saw Arkansas plunge into the Great Depression, followed almost immediately by a major drought from the summer of 1930s until the winter of 1931/1932.[4] Arkansas gave extremely heavy support to Democrat Franklin Roosevelt in the 1932 election.[5] Roosevelt won every county in the state, and was extremely popular in the “Solid South” throughout his first term.[6] although his popularity lessened somewhat during his second term due to the urban and labor bias of the New Deal, Roosevelt remained in no danger in 1940. This was especially true given that the South had never experienced German or Scandinavian immigration and thus strongly sympathized – as FDR did – with Britain in World War II.[7] Thus FDR was able to almost maintain his 1936 majority in the Natural State, and replicated the county map of 1896, 1916, 1924 and 1936.
Results
| Presidential candidate | Party | Home state | Popular vote | Electoral vote |
Running mate | |||
|---|---|---|---|---|---|---|---|---|
| Count | Percentage | Vice-presidential candidate | Home state | Electoral vote | ||||
| Franklin D. Roosevelt | Democratic | New York | 157,213 | 78.44% | 9 | Henry Agard Wallace | Iowa | 9 |
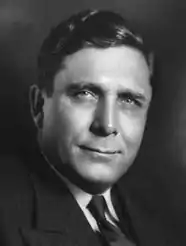
| Wendell Willkie | Republican | New York | 42,122 | 21.02% | 0 | Charles L. McNary | Oregon | 0 |
| — | Write-ins | — | 1,094 | 0.55% | 0 | — | — | 0 |
| Total | 179,423 | 100% | 9 | 9 | ||||
| Needed to win | 266 | 266 | ||||||
Results by county
| County | Franklin Delano Roosevelt Democratic |
Wendell Lewis Willkie Republican |
Various candidates Write-ins |
Margin | Total votes cast[8] | ||||
|---|---|---|---|---|---|---|---|---|---|
| # | % | # | % | # | % | # | % | ||
| Arkansas | 2,345 | 74.87% | 742 | 23.69% | 45 | 1.44% | 1,603 | 51.18% | 3,132 |
| Ashley | 1,835 | 90.71% | 184 | 9.10% | 4 | 0.20% | 1,651 | 81.61% | 2,023 |
| Baxter | 859 | 63.39% | 489 | 36.09% | 7 | 0.52% | 370 | 27.31% | 1,355 |
| Benton | 2,442 | 54.59% | 1,962 | 43.86% | 69 | 1.54% | 480 | 10.73% | 4,473 |
| Boone | 2,054 | 71.59% | 786 | 27.40% | 29 | 1.01% | 1,268 | 44.20% | 2,869 |
| Bradley | 1,939 | 93.85% | 123 | 5.95% | 4 | 0.19% | 1,816 | 87.90% | 2,066 |
| Calhoun | 818 | 94.90% | 44 | 5.10% | 0 | 0.00% | 774 | 89.79% | 862 |
| Carroll | 1,604 | 59.69% | 1,081 | 40.23% | 2 | 0.07% | 523 | 19.46% | 2,687 |
| Chicot | 1,592 | 90.71% | 161 | 9.17% | 2 | 0.11% | 1,431 | 81.54% | 1,755 |
| Clark | 2,008 | 86.29% | 311 | 13.36% | 8 | 0.34% | 1,697 | 72.93% | 2,327 |
| Clay | 1,676 | 60.31% | 1,029 | 37.03% | 74 | 2.66% | 647 | 23.28% | 2,779 |
| Cleburne | 834 | 68.47% | 374 | 30.71% | 10 | 0.82% | 460 | 37.77% | 1,218 |
| Cleveland | 989 | 94.37% | 58 | 5.53% | 1 | 0.10% | 931 | 88.84% | 1,048 |
| Columbia | 2,270 | 93.72% | 149 | 6.15% | 3 | 0.12% | 2,121 | 87.57% | 2,422 |
| Conway | 2,067 | 88.33% | 272 | 11.62% | 1 | 0.04% | 1,795 | 76.71% | 2,340 |
| Craighead | 3,300 | 77.43% | 935 | 21.94% | 27 | 0.63% | 2,365 | 55.49% | 4,262 |
| Crawford | 1,581 | 68.21% | 691 | 29.81% | 46 | 1.98% | 890 | 38.40% | 2,318 |
| Crittenden | 1,966 | 96.37% | 72 | 3.53% | 2 | 0.10% | 1,894 | 92.84% | 2,040 |
| Cross | 1,746 | 85.80% | 285 | 14.00% | 4 | 0.20% | 1,461 | 71.79% | 2,035 |
| Dallas | 1,295 | 88.28% | 118 | 8.04% | 54 | 3.68% | 1,177 | 80.23% | 1,467 |
| Desha | 1,370 | 89.78% | 146 | 9.57% | 10 | 0.66% | 1,224 | 80.21% | 1,526 |
| Drew | 1,329 | 87.95% | 152 | 10.06% | 30 | 1.99% | 1,177 | 77.90% | 1,511 |
| Faulkner | 2,535 | 82.68% | 519 | 16.93% | 12 | 0.39% | 2,016 | 65.75% | 3,066 |
| Franklin | 1,601 | 83.30% | 319 | 16.60% | 2 | 0.10% | 1,282 | 66.70% | 1,922 |
| Fulton | 838 | 70.84% | 333 | 28.15% | 12 | 1.01% | 505 | 42.69% | 1,183 |
| Garland | 3,335 | 69.89% | 1,424 | 29.84% | 13 | 0.27% | 1,911 | 40.05% | 4,772 |
| Grant | 1,043 | 86.70% | 160 | 13.30% | 0 | 0.00% | 883 | 73.40% | 1,203 |
| Greene | 2,220 | 81.17% | 510 | 18.65% | 5 | 0.18% | 1,710 | 62.52% | 2,735 |
| Hempstead | 2,814 | 87.15% | 415 | 12.85% | 0 | 0.00% | 2,399 | 74.30% | 3,229 |
| Hot Spring | 1,730 | 78.03% | 482 | 21.74% | 5 | 0.23% | 1,248 | 56.29% | 2,217 |
| Howard | 1,540 | 78.05% | 419 | 21.24% | 14 | 0.71% | 1,121 | 56.82% | 1,973 |
| Independence | 2,276 | 70.68% | 928 | 28.82% | 16 | 0.50% | 1,348 | 41.86% | 3,220 |
| Izard | 1,058 | 74.19% | 366 | 25.67% | 2 | 0.14% | 692 | 48.53% | 1,426 |
| Jackson | 2,223 | 84.59% | 382 | 14.54% | 23 | 0.88% | 1,841 | 70.05% | 2,628 |
| Jefferson | 3,829 | 86.45% | 587 | 13.25% | 13 | 0.29% | 3,242 | 73.20% | 4,429 |
| Johnson | 1,429 | 81.38% | 318 | 18.11% | 9 | 0.51% | 1,111 | 63.27% | 1,756 |
| Lafayette | 1,352 | 88.02% | 159 | 10.35% | 25 | 1.63% | 1,193 | 77.67% | 1,536 |
| Lawrence | 2,484 | 73.93% | 852 | 25.36% | 24 | 0.71% | 1,632 | 48.57% | 3,360 |
| Lee | 1,100 | 90.76% | 109 | 8.99% | 3 | 0.25% | 991 | 81.77% | 1,212 |
| Lincoln | 916 | 89.37% | 99 | 9.66% | 10 | 0.98% | 817 | 79.71% | 1,025 |
| Little River | 1,104 | 79.31% | 276 | 19.83% | 12 | 0.86% | 828 | 59.48% | 1,392 |
| Logan | 2,831 | 72.66% | 1,065 | 27.34% | 0 | 0.00% | 1,766 | 45.33% | 3,896 |
| Lonoke | 1,899 | 85.35% | 323 | 14.52% | 3 | 0.13% | 1,576 | 70.83% | 2,225 |
| Madison | 2,196 | 50.97% | 2,107 | 48.91% | 5 | 0.12% | 89 | 2.07% | 4,308 |
| Marion | 864 | 71.94% | 320 | 26.64% | 17 | 1.42% | 544 | 45.30% | 1,201 |
| Miller | 3,019 | 83.88% | 563 | 15.64% | 17 | 0.47% | 2,456 | 68.24% | 3,599 |
| Mississippi | 5,257 | 89.24% | 616 | 10.46% | 18 | 0.31% | 4,641 | 78.78% | 5,891 |
| Monroe | 1,494 | 92.00% | 128 | 7.88% | 2 | 0.12% | 1,366 | 84.11% | 1,624 |
| Montgomery | 1,012 | 71.42% | 400 | 28.23% | 5 | 0.35% | 612 | 43.19% | 1,417 |
| Nevada | 1,399 | 85.83% | 224 | 13.74% | 7 | 0.43% | 1,175 | 72.09% | 1,630 |
| Newton | 1,202 | 45.91% | 1,392 | 53.17% | 24 | 0.92% | -190 | -7.26% | 2,618 |
| Ouachita | 2,951 | 91.08% | 284 | 8.77% | 5 | 0.15% | 2,667 | 82.31% | 3,240 |
| Perry | 783 | 79.09% | 206 | 20.81% | 1 | 0.10% | 577 | 58.28% | 990 |
| Phillips | 2,235 | 90.12% | 245 | 9.88% | 0 | 0.00% | 1,990 | 80.24% | 2,480 |
| Pike | 974 | 69.13% | 424 | 30.09% | 11 | 0.78% | 550 | 39.03% | 1,409 |
| Poinsett | 4,138 | 85.90% | 670 | 13.91% | 9 | 0.19% | 3,468 | 72.00% | 4,817 |
| Polk | 1,255 | 67.55% | 585 | 31.49% | 18 | 0.97% | 670 | 36.06% | 1,858 |
| Pope | 3,765 | 82.55% | 770 | 16.88% | 26 | 0.57% | 2,995 | 65.67% | 4,561 |
| Prairie | 1,069 | 75.92% | 336 | 23.86% | 3 | 0.21% | 733 | 52.06% | 1,408 |
| Pulaski | 14,219 | 82.52% | 2,955 | 17.15% | 56 | 0.33% | 11,264 | 65.37% | 17,230 |
| Randolph | 1,687 | 77.42% | 474 | 21.75% | 18 | 0.83% | 1,213 | 55.67% | 2,179 |
| St. Francis | 1,671 | 88.23% | 192 | 10.14% | 31 | 1.64% | 1,479 | 78.09% | 1,894 |
| Saline | 1,963 | 87.21% | 274 | 12.17% | 14 | 0.62% | 1,689 | 75.03% | 2,251 |
| Scott | 992 | 73.32% | 353 | 26.09% | 8 | 0.59% | 639 | 47.23% | 1,353 |
| Searcy | 982 | 43.11% | 1,292 | 56.72% | 4 | 0.18% | -310 | -13.61% | 2,278 |
| Sebastian | 5,249 | 72.44% | 1,968 | 27.16% | 29 | 0.40% | 3,281 | 45.28% | 7,246 |
| Sevier | 1,374 | 82.03% | 293 | 17.49% | 8 | 0.48% | 1,081 | 64.54% | 1,675 |
| Sharp | 1,099 | 71.50% | 433 | 28.17% | 5 | 0.33% | 666 | 43.33% | 1,537 |
| Stone | 644 | 60.93% | 406 | 38.41% | 7 | 0.66% | 238 | 22.52% | 1,057 |
| Union | 4,842 | 90.59% | 489 | 9.15% | 14 | 0.26% | 4,353 | 81.44% | 5,345 |
| Van Buren | 1,068 | 72.65% | 402 | 27.35% | 0 | 0.00% | 666 | 45.31% | 1,470 |
| Washington | 2,873 | 60.48% | 1,819 | 38.29% | 58 | 1.22% | 1,054 | 22.19% | 4,750 |
| White | 3,345 | 78.80% | 876 | 20.64% | 24 | 0.57% | 2,469 | 58.16% | 4,245 |
| Woodruff | 1,280 | 86.43% | 193 | 13.03% | 8 | 0.54% | 1,087 | 73.40% | 1,481 |
| Yell | 2,236 | 90.64% | 224 | 9.08% | 7 | 0.28% | 2,012 | 81.56% | 2,467 |
| Totals | 157,213 | 78.44% | 42,122 | 21.02% | 1,094 | 0.55% | 115,091 | 57.42% | 200,429 |
References
- See Urwin, Cathy Kunzinger; Agenda for Reform: Winthrop Rockefeller as Governor of Arkansas, 1967-71, p. 32 ISBN 1557282005
- Phillips, Kevin P.; The Emerging Republican Majority, pp. 211, 287 ISBN 978-0-691-16324-6
- Barnes, Kenneth C.; Anti-Catholicism in Arkansas: How Politicians, the Press, the Klan, and Religious Leaders Imagined an Enemy, 1910–1960, pp. 164-165 ISBN 168226016X
- Whayne, Jeannie M.; DeBlack, Thomas A.; Sabo, George and Arnold, Morris S.; Arkansas: A Narrative History, pp. 341-342 ISBN 155728993X
- Grantham, Dewey W.; The Life and Death of the Solid South: A Political History, p. 102 ISBN 0813148723
- Leuchtenburg, William E.; The White House Looks South: Franklin D. Roosevelt, Harry S. Truman, Lyndon B. Johnson, p. 51 ISBN 0807151424
- Dunn, Susan; 1940: FDR, Willkie, Lindbergh, Hitler – the Election Amid the Storm, p. 57 ISBN 0300190867
- Scammon, Richard M. (compiler); America at the Polls: A Handbook of Presidential Election Statistics 1920-1964; pp. 48-49 ISBN 0405077114
