2008 United States presidential election in Wisconsin
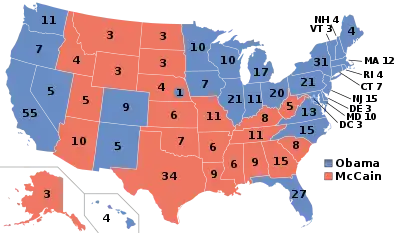
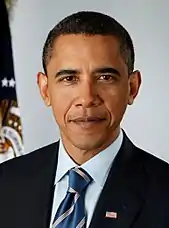
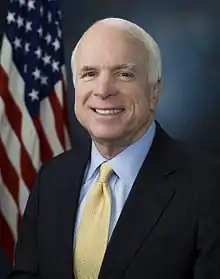
The 2008 United States presidential election in Wisconsin took place on November 4, 2008, as part of the 2008 United States presidential election in which all 50 states plus the District of Columbia participated. Wisconsin voters chose 10 electors to represent them in the Electoral College via a popular vote pitting Democratic U.S. Senator from Illinois Barack Obama, and his running mate U.S. Senator from Delaware Joe Biden, against Republican challenger and U.S. Senator from Arizona John McCain and his running mate, Alaska Governor Sarah Palin.
| ||||||||||||||||||||||||||
| Turnout | 69.2% ( | |||||||||||||||||||||||||
|---|---|---|---|---|---|---|---|---|---|---|---|---|---|---|---|---|---|---|---|---|---|---|---|---|---|---|
| ||||||||||||||||||||||||||
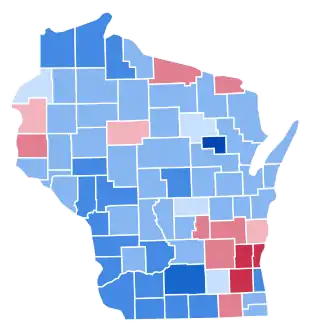 County Results
| ||||||||||||||||||||||||||
| ||||||||||||||||||||||||||
| Elections in Wisconsin |
|---|
 |
Also on the ballot were four third parties: activist and former presidential candidate Ralph Nader ran as an Independent with his running mate, President of the San Francisco Board of Supervisors Matt Gonzalez. The Libertarian Party nominated former Representative from Georgia Bob Barr for president and conservative author Wayne Allyn Root for vice president. Pastor Chuck Baldwin and attorney Darrell Castle were nominated by the right-wing Constitution Party, and the left-wing Green Party nominated former Representative from Georgia Cynthia McKinney and community organizer Rosa Clemente.[2]
Wisconsin was won by Democratic nominee Barack Obama by a 13.91% margin of victory. Prior to the election, all 17 news organizations considered this a state Obama would win, or otherwise considered as a safe blue state, despite the extremely close margins of victory in the previous two presidential elections. Polling throughout the state began to show a sizable and widening lead for Democrat Barack Obama of neighboring Illinois over Republican John McCain of Arizona. Obama carried Wisconsin with over 56% of the vote, significantly improving upon John Kerry's margin of victory in 2004. No presidential candidate has ever received more votes in Wisconsin than Obama. Whether measured by raw vote margin, percentage of total votes, or two-party percentage, Obama's victory remains the strongest performance for any candidate in the state since the landslide re-election of Democrat Lyndon B. Johnson in 1964. In fact, Obama carried two of three counties that voted for Barry Goldwater in that election, was the first Democrat since Franklin D. Roosevelt in 1936 to carry Waupaca County, and only the second Democratic nominee to carry that county since the Civil War.[lower-alpha 1]
Campaign
Predictions
There were 16 news organizations who made state-by-state predictions of the election. Here are their last predictions before election day:
- D.C. Political Report: Democrat[4]
- Cook Political Report: Leaning Democrat[5]
- Takeaway: Solid Obama[6]
- Electoral-vote.com: Strong Democrat[7]
- Washington Post: Solid Obama[8]
- Politico: Solid Obama[9]
- Real Clear Politics: Solid Obama[10]
- FiveThirtyEight.com: Solid Obama[11]
- CQ Politics: Safe Democrat[12]
- New York Times: Leaning Democrat[13]
- CNN: Leaning Democrat[14]
- NPR: Solid Obama[15]
- MSNBC: Solid Obama[16]
- Fox News: Democrat[17]
- Associated Press: Democrat[18]
- Rasmussen Reports: Safe Democrat[19]
Polling
Pre-election polling early on showed a tight race. However, after May 18, Obama swept every single poll. Since September 21, Obama won every poll with at least 49% of the vote. The final 3 polls averaged Obama leading 53% to 40%.[20]
Fundraising
John McCain raised a total of $1,728,185 in the state. Barack Obama raised $4,862,486.[21]
Analysis
Having voted for the Democratic presidential nominees by wide margins in 1988, 1992, and 1996, but extremely narrow margins in 2000 and 2004, Wisconsin was originally considered to be a swing state in 2008.[24] However, Obama took a wide lead in the polls in Wisconsin in the final weeks before the election and many pundits and news organizations labeled the state as a safe blue state.[25]
Obama won Wisconsin by a comfortable 13.91% margin of victory. Obama carried the heavily Democratic cities of Milwaukee and Madison by large margins, winning above two-thirds of the vote, along with some traditionally Republican cities like Green Bay and Appleton.[26] In Dane County, he won almost 73% of the vote, and carried 67.3% in Milwaukee County. This was consistent with Obama's pattern of strong performances in the states bordering Illinois. Obama's best performance, at 86.81%, was in the small county of Menominee, which is 87% Native American.[27] The state's Republican base essentially melted; John McCain only carried 13 of the state's 72 counties, a devastating defeat. McCain did best in the Milwaukee suburbs like Waukesha and Ozaukee counties, with his best performance in Washington County where he received 64.14% of the vote. He only won five counties in the Northern part of the state, all of which by rather narrow margins. Wisconsin would not vote for a Republican candidate for president until it voted for Donald Trump in 2016, though it would flip back to the Democratic column in 2020 with Joe Biden back on the ballot.
As of the 2020 presidential election, this is the last election in which the counties of Barron, Brown, Burnett, Calumet, Chippewa, Clark, Iron, Jefferson, Kewaunee, Langlade, Manitowoc, Marathon, Marinette, Monroe, Oconto, Oneida, Outagamie, Pierce, Rusk, Shawano, Washburn, Waupaca, Waushara, and Wood voted for the Democratic presidential nominee.
Results
| 2008 United States presidential election in Wisconsin[2] | ||||||
|---|---|---|---|---|---|---|
| Party | Candidate | Running mate | Votes | Percentage | Electoral votes | |
| Democratic | Barack Obama | Joe Biden | 1,677,211 | 56.22% | 10 | |
| Republican | John McCain | Sarah Palin | 1,262,393 | 42.31% | 0 | |
| Independent | Ralph Nader | Matt Gonzalez | 17,605 | 0.59% | 0 | |
| Libertarian | Bob Barr | Wayne Allyn Root | 8,858 | 0.30% | 0 | |
| Write-ins | Write-ins | 6,521 | 0.22% | 0 | ||
| Constitution | Chuck Baldwin | Darrell Castle | 5,072 | 0.17% | 0 | |
| Green | Cynthia McKinney | Rosa Clemente | 4,216 | 0.14% | 0 | |
| Others | - | - | 1,541 | 0.05% | 0 | |
| Totals | 2,983,417 | 100.00% | 10 | |||
| Voter turnout (Voting age population) | 70.8% | |||||
Results breakdown
By county
| County | Obama% | Obama# | McCain% | McCain# | Others% | Others# | Total |
|---|---|---|---|---|---|---|---|
| Adams | 58.14% | 5,806 | 39.80% | 3,974 | 2.06% | 206 | 9,986 |
| Ashland | 67.86% | 5,818 | 30.72% | 2,634 | 1.42% | 122 | 8,574 |
| Barron | 52.77% | 12,078 | 45.69% | 10,457 | 1.53% | 351 | 22,886 |
| Bayfield | 63.08% | 5,972 | 35.54% | 3,365 | 1.38% | 131 | 9,468 |
| Brown | 53.93% | 67,269 | 44.77% | 55,854 | 1.30% | 1,621 | 124,744 |
| Buffalo | 56.41% | 3,949 | 41.76% | 2,923 | 1.83% | 128 | 7,000 |
| Burnett | 49.92% | 4,337 | 48.34% | 4,200 | 1.74% | 151 | 8,688 |
| Calumet | 50.22% | 13,295 | 48.05% | 12,722 | 1.73% | 457 | 26,474 |
| Chippewa | 53.72% | 16,239 | 44.63% | 13,492 | 1.65% | 500 | 30,231 |
| Clark | 52.54% | 7,454 | 44.99% | 6,383 | 2.47% | 350 | 14,187 |
| Columbia | 56.92% | 16,661 | 41.65% | 12,193 | 1.43% | 418 | 29,272 |
| Crawford | 62.49% | 4,987 | 35.46% | 2,830 | 2.05% | 164 | 7,981 |
| Dane | 72.80% | 205,984 | 25.82% | 73,065 | 1.37% | 3,890 | 282,939 |
| Dodge | 44.80% | 19,183 | 53.74% | 23,015 | 1.46% | 625 | 42,823 |
| Door | 58.02% | 10,142 | 40.68% | 7,112 | 1.30% | 227 | 17,481 |
| Douglas | 65.78% | 15,830 | 32.56% | 7,835 | 1.67% | 401 | 24,066 |
| Dunn | 56.56% | 13,002 | 41.61% | 9,566 | 1.83% | 421 | 22,989 |
| Eau Claire | 60.25% | 33,146 | 38.10% | 20,959 | 1.65% | 905 | 55,010 |
| Florence | 42.23% | 1,134 | 56.31% | 1,512 | 1.45% | 39 | 2,685 |
| Fond du Lac | 44.84% | 23,463 | 53.83% | 28,164 | 1.33% | 696 | 52,323 |
| Forest | 57.08% | 2,673 | 41.92% | 1,963 | 1.00% | 47 | 4,683 |
| Grant | 61.16% | 14,875 | 37.29% | 9,068 | 1.55% | 377 | 24,320 |
| Green | 62.06% | 11,502 | 36.31% | 6,730 | 1.63% | 302 | 18,534 |
| Green Lake | 41.95% | 4,000 | 56.55% | 5,393 | 1.50% | 143 | 9,536 |
| Iowa | 66.73% | 7,987 | 31.99% | 3,829 | 1.28% | 153 | 11,969 |
| Iron | 55.77% | 1,914 | 42.66% | 1,464 | 1.57% | 54 | 3,432 |
| Jackson | 60.23% | 5,572 | 38.40% | 3,552 | 1.37% | 127 | 9,251 |
| Jefferson | 49.69% | 21,448 | 48.87% | 21,096 | 1.44% | 622 | 43,166 |
| Juneau | 53.65% | 6,186 | 44.65% | 5,148 | 1.70% | 196 | 11,530 |
| Kenosha | 58.18% | 45,836 | 40.12% | 31,609 | 1.71% | 1,344 | 78,789 |
| Kewaunee | 54.71% | 5,902 | 43.67% | 4,711 | 1.61% | 174 | 10,787 |
| La Crosse | 60.94% | 38,524 | 37.49% | 23,701 | 1.57% | 993 | 63,218 |
| Lafayette | 60.43% | 4,732 | 38.10% | 2,984 | 1.47% | 115 | 7,831 |
| Langlade | 49.82% | 5,182 | 48.85% | 5,081 | 1.34% | 139 | 10,402 |
| Lincoln | 55.17% | 8,424 | 42.70% | 6,519 | 2.13% | 325 | 15,268 |
| Manitowoc | 52.88% | 22,428 | 45.35% | 19,234 | 1.77% | 752 | 42,414 |
| Marathon | 53.53% | 36,367 | 44.66% | 30,345 | 1.81% | 1,228 | 67,940 |
| Marinette | 52.67% | 11,195 | 45.76% | 9,726 | 1.57% | 334 | 21,255 |
| Marquette | 51.85% | 4,068 | 46.57% | 3,654 | 1.58% | 124 | 7,846 |
| Menominee | 86.81% | 1,257 | 12.78% | 185 | 0.41% | 6 | 1,448 |
| Milwaukee | 67.30% | 319,819 | 31.45% | 149,445 | 1.25% | 5,928 | 475,192 |
| Monroe | 53.25% | 10,198 | 45.25% | 8,666 | 1.50% | 288 | 19,152 |
| Oconto | 52.34% | 9,927 | 46.16% | 8,755 | 1.51% | 286 | 18,968 |
| Oneida | 54.30% | 11,907 | 43.92% | 9,630 | 1.78% | 390 | 21,927 |
| Outagamie | 54.93% | 50,294 | 43.33% | 39,677 | 1.74% | 1,592 | 91,563 |
| Ozaukee | 38.56% | 20,579 | 60.29% | 32,172 | 1.15% | 614 | 53,365 |
| Pepin | 55.74% | 2,102 | 42.85% | 1,616 | 1.41% | 53 | 3,771 |
| Pierce | 53.39% | 11,803 | 44.38% | 9,812 | 2.23% | 492 | 22,107 |
| Polk | 48.03% | 10,876 | 49.83% | 11,282 | 2.14% | 485 | 22,643 |
| Portage | 62.95% | 24,817 | 35.03% | 13,810 | 2.02% | 795 | 39,422 |
| Price | 55.64% | 4,559 | 42.24% | 3,461 | 2.12% | 174 | 8,194 |
| Racine | 53.07% | 53,408 | 45.66% | 45,954 | 1.27% | 1,280 | 100,642 |
| Richland | 59.66% | 5,041 | 39.03% | 3,298 | 1.31% | 111 | 8,450 |
| Rock | 63.82% | 50,529 | 34.56% | 27,364 | 1.61% | 1,276 | 79,169 |
| Rusk | 53.01% | 3,855 | 44.73% | 3,253 | 2.26% | 164 | 7,272 |
| St. Croix | 47.25% | 21,177 | 50.95% | 22,837 | 1.80% | 807 | 44,821 |
| Sauk | 60.79% | 18,617 | 37.75% | 11,562 | 1.46% | 447 | 30,626 |
| Sawyer | 52.45% | 4,765 | 46.22% | 4,199 | 1.33% | 121 | 9,085 |
| Shawano | 51.07% | 10,259 | 47.48% | 9,538 | 1.45% | 292 | 20,089 |
| Sheboygan | 48.94% | 30,395 | 49.59% | 30,801 | 1.47% | 911 | 62,107 |
| Taylor | 48.82% | 4,563 | 49.07% | 4,586 | 2.11% | 197 | 9,346 |
| Trempealeau | 62.50% | 8,321 | 36.11% | 4,808 | 1.39% | 185 | 13,314 |
| Vernon | 60.13% | 8,463 | 38.13% | 5,367 | 1.74% | 245 | 14,075 |
| Vilas | 47.21% | 6,491 | 51.31% | 7,055 | 1.48% | 204 | 13,750 |
| Walworth | 47.95% | 24,177 | 50.54% | 25,485 | 1.51% | 760 | 50,422 |
| Washburn | 51.50% | 4,693 | 47.22% | 4,303 | 1.27% | 116 | 9,112 |
| Washington | 34.56% | 25,719 | 64.14% | 47,729 | 1.29% | 963 | 74,411 |
| Waukesha | 36.64% | 85,339 | 62.32% | 145,152 | 1.03% | 2,406 | 232,897 |
| Waupaca | 50.77% | 12,952 | 47.95% | 12,232 | 1.28% | 327 | 25,511 |
| Waushara | 49.52% | 5,868 | 48.70% | 5,770 | 1.78% | 211 | 11,849 |
| Winnebago | 54.94% | 48,167 | 43.28% | 37,946 | 1.78% | 1,564 | 87,677 |
| Wood | 55.59% | 21,710 | 42.46% | 16,581 | 1.95% | 761 | 39,052 |
Counties that flipped from Republican to Democratic
Barack Obama flipped 32 counties that voted for George W. Bush in the narrow election of 2004.[28][29]
- Barron (largest city: Rice Lake)
- Brown (largest city: Green Bay)
- Burnett (largest village: Grantsburg)
- Calumet (largest city: Chilton)
- Chippewa (largest city: Chippewa Falls)
- Clark (largest city: Neillsville)
- Columbia (largest city: Portage)
- Door (largest city: Sturgeon Bay)
- Forest (largest city: Crandon)
- Jefferson (largest city: Watertown)
- Juneau (largest city: Mauston)
- Kewaunee (largest city: Algoma)
- Langlade (largest city: Antigo)
- Lincoln (largest city: Merrill)
- Manitowoc (largest city: Manitowoc)
- Marathon (largest city: Wausau)
- Marinette (largest city: Marinette)
- Marquette (largest city: Montello)
- Monroe (largest city: Sparta)
- Oconto (largest city: Oconto)
- Oneida (largest city: Rhinelander)
- Outagamie (largest city: Appleton)
- Racine (largest city: Racine)
- Richland (largest city: Richland Center)
- Rusk (largest city: Ladysmith)
- Sawyer (largest city: Hayward)
- Shawano (largest city: Shawano)
- Washburn (largest city: Spooner)
- Waupaca (largest city: New London)
- Waushara (largest city: Berlin)
- Winnebago (largest city: Oshkosh)
- Wood (largest city: Marshfield)
By congressional district
Barack Obama swept the state, carrying seven of the state's eight congressional districts, including two districts held by Republicans. Three of these districts – the 1st, 6th, and 8th – Obama flipped from the 2004 election.[30] McCain only won the 5th district, a portion of the Milwaukee suburbs.
| District | McCain | Obama | Representative |
|---|---|---|---|
| 1st | 47.45% | 51.40% | Paul Ryan |
| 2nd | 29.78% | 69.00% | Tammy Baldwin |
| 3rd | 40.80% | 57.76% | Ron Kind |
| 4th | 23.61% | 75.39% | Gwen Moore |
| 5th | 57.73% | 41.28% | Jim Sensenbrenner |
| 6th | 48.72% | 49.91% | Tom Petri |
| 7th | 42.52% | 55.91% | David Obey |
| 8th | 45.12% | 53.59% | Steve Kagen |
Electors
Technically the voters of Wisconsin cast their ballots for electors: representatives to the Electoral College. Wisconsin is allocated 10 electors because it has 8 congressional districts and 2 senators. All candidates who appear on the ballot or qualify to receive write-in votes must submit a list of 10 electors, who pledge to vote for their candidate and his or her running mate. Whoever wins the majority of votes in the state is awarded all 10 electoral votes. Their chosen electors then vote for president and vice president. Although electors are pledged to their candidate and running mate, they are not obligated to vote for them.[31] An elector who votes for someone other than his or her candidate is known as a faithless elector.
The electors of each state and the District of Columbia met on December 15, 2008, to cast their votes for president and vice president. The Electoral College itself never meets as one body. Instead the electors from each state and the District of Columbia met in their respective capitols.
The following were the members of the Electoral College from the state. All 10 were pledged to Barack Obama and Joe Biden:[32]
- Ray Rivera
- Fred Risser
- Rollie Hick
- Polly Williams
- Dean Palmer
- Gordon Hintz
- Christine Bremer-Muggli
- Donsia Strong Hill
- Jim Doyle
- Joe Wineke
Notes
- Waupaca County did like most of Wisconsin vote for “Independent” Robert M. La Follette in 1924, but apart from this election and supporting Roosevelt in 1932 and 1936 it voted Republican in every election between 1868 and 2004.[3]
References
- "Wisconsin Voter Turnout Statistics". Wisconsin Election Commission. Retrieved 25 September 2020.
- "Dave Leip's Atlas of U.S. Presidential Elections". uselectionatlas.org. Retrieved 2020-11-18.
- Menendez, Albert J.; The Geography of Presidential Elections in the United States, 1868-2004, pp. 337-342 ISBN 0786422173
- "Archived copy". Archived from the original on 2009-01-01. Retrieved 2009-12-25.CS1 maint: archived copy as title (link)
- "Archived copy". Archived from the original on May 5, 2015. Retrieved January 14, 2015.CS1 maint: archived copy as title (link)
- Adnaan (2008-09-20). "Track the Electoral College vote predictions". The Takeaway. Archived from the original on April 22, 2009. Retrieved 2009-11-14.
- http://electoral-vote.com/evp2008/Pres/Maps/Dec31.html
- Based on Takeaway
- http://www.politico.com/convention/swingstate.html
- http://www.realclearpolitics.com/epolls/maps/obama_vs_mccain/?map=5
- Based on Takeaway
- "Archived copy". Archived from the original on June 14, 2009. Retrieved December 20, 2009.CS1 maint: archived copy as title (link)
- Nagourney, Adam; Zeleny, Jeff; Carter, Shan (2008-11-04). "The Electoral Map: Key States". The New York Times. Retrieved May 26, 2010.
- "October – 2008 – CNN Political Ticker - CNN.com Blogs". CNN. 2008-10-31. Retrieved 2010-05-26.
- Based on Takeaway
- Based on Takeaway
- "Winning The Electoral College". Fox News. 2010-04-27.
- http://hosted.ap.org/specials/interactives/campaign_plus/roadto270/
- http://www.rasmussenreports.com/public_content/politics/elections2/election_20082/2008_presidential_election/election_2008_electoral_college_update
- http://uselectionatlas.org/POLLS/PRESIDENT/2008/pollsa.php?fips=55
- "Archived copy". Archived from the original on 2009-03-24. Retrieved 2009-08-18.CS1 maint: archived copy as title (link)
- "Map: Campaign Ad Spending - Election Center 2008 from CNN.com". CNN. Retrieved 2010-05-26.
- "Map: Campaign Candidate Visits - Election Center 2008 from CNN.com". CNN. Retrieved 2010-05-26.
- "Reality Check: Wisconsin Still Considered A Swing State". Archived from the original on 2008-09-16. Retrieved 2008-11-12.
- "RealClearPolitics: Wisconsin Head-to-Head Polls". Retrieved 2008-11-12.
- "Local and National Election Results". CNN. Retrieved 2008-11-12.
- "U.S. Census Bureau QuickFacts: Menominee County, Wisconsin; Wisconsin". www.census.gov. Retrieved 2020-11-18.
- "Wisconsin - Election Results 2008 - The New York Times". www.nytimes.com. Retrieved 2020-11-18.
- "Wisconsin". The New York Times. ISSN 0362-4331. Retrieved 2020-11-18.
- "Presidential Results by Congressional District, 2000-2008 – Swing State Project". Retrieved 2020-11-18.
- "Electoral College". California Secretary of State. Archived from the original on October 30, 2008. Retrieved 2008-11-01.
- https://www.archives.gov/federal-register/electoral-college/2008-certificates/index.html#wi