Demographics of Bulgaria
The demography of the Republic of Bulgaria is monitored by the National Statistical Institute of Bulgaria.
| Demographics of Bulgaria | |
|---|---|
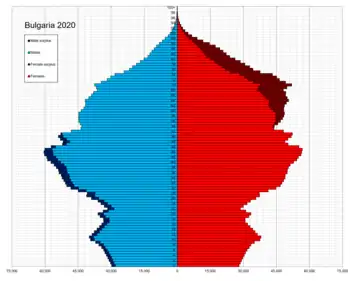 Bulgaria population pyramid in 2020 | |
| Population | |
| Growth rate | |
| Birth rate | |
| Death rate | |
| Life expectancy | |
| • male | |
| • female | |
| Fertility rate | |
| Infant mortality rate | |
| Net migration rate | |
| Age structure | |
| 0–14 years | |
| 15–64 years | |
| 65 and over | |
| Sex ratio | |
| At birth | 1.06 male(s)/female |
| Under 15 | 1.05 male(s)/female |
| 15–64 years | 0.97 male(s)/female |
| 65 and over | 0.68 male(s)/female |
| Nationality | |
| Nationality | noun: Bulgarian(s) adjective: Bulgarian |
| Major ethnic | Bulgarian (84.8%) |
| Minor ethnic | Turkish (8.8%) Roma (4.9%) Other and unknown (1.5%) |
| Language | |
| Official | Bulgarian (85.2%) |
This article is about the demographic features of the population of Bulgaria, including population density, ethnicity, education level, health of the populace, economic status, religious affiliations and other aspects of the population.
Bulgaria has a very high Human Development Index of 0.813, ranking 51st in the world in 2018[4] and holds the 38th position in Newsweek's rankings of the world's best countries to live in, measuring health, education, political environment and economic dynamism.[5]
Demographic history
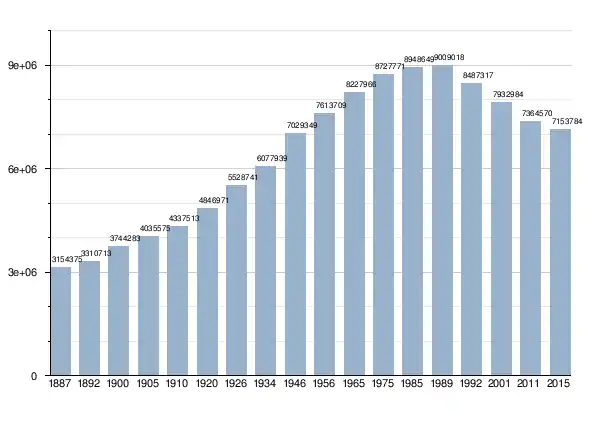
Various estimates have put Bulgaria's medieval population at 1.1 million in 700 AD and 2.6 million in 1365.[6] At the 2011 census, the population inhabiting Bulgaria was 7,364,570 in total, but more recent estimates calculate that the population has declined to 6.9 million.[7] The peak was in 1989, the year when the borders opened after a half of a century of communist regime, when the population numbered 9,009,018.
| Year | Pop. | ±% p.a. |
|---|---|---|
| 1887 | 3,154,375 | — |
| 1892 | 3,310,713 | +0.97% |
| 1900 | 3,744,283 | +1.55% |
| 1905 | 4,035,575 | +1.51% |
| 1910 | 4,337,513 | +1.45% |
| 1920 | 4,846,971 | +1.12% |
| 1926 | 5,528,741 | +2.22% |
| 1934 | 6,077,939 | +1.19% |
| 1946 | 7,029,349 | +1.22% |
| 1956 | 7,613,709 | +0.80% |
| 1965 | 8,227,966 | +0.87% |
| 1975 | 8,727,771 | +0.59% |
| 1985 | 8,948,649 | +0.25% |
| 1992 | 8,487,317 | −0.75% |
| 2001 | 7,932,984 | −0.75% |
| 2011 | 7,364,570 | −0.74% |
| 2015 | 7,168,009[8] | −0.67% |
| 2016 | 7,101,859 | −0.92% |
| 2017 | 7,050,034 | −0.73% |
| 2018 | 7,000,039 | −0.71% |
| 2019 | 6,951,482 | −0.69% |
| Source: Censuses in Bulgaria | ||
Vital statistics
Vital Statistics 1875 to 1915
The total fertility rate is the number of children born per woman. It is based on fairly good data for the entire period. Sources: Our World in Data and Gapminder Foundation.[9]
| Years | 1875 | 1876 | 1877 | 1878 | 1879 | 1880[9] |
|---|---|---|---|---|---|---|
| Total Fertility Rate in Bulgaria | 5.16 | 5.05 | 4.95 | 4.84 | 4.73 | 4.62 |
| Years | 1881 | 1882 | 1883 | 1884 | 1885 | 1886 | 1887 | 1888 | 1889 | 1890[9] |
|---|---|---|---|---|---|---|---|---|---|---|
| Total Fertility Rate in Bulgaria | 4.52 | 4.92 | 5.16 | 5.16 | 5.04 | 4.37 | 5.15 | 5.05 | 4.92 | 4.7 |
| Years | 1891 | 1892 | 1893 | 1894 | 1895 | 1896 | 1897 | 1898 | 1899 | 1900[9] |
|---|---|---|---|---|---|---|---|---|---|---|
| Total Fertility Rate in Bulgaria | 5.24 | 4.82 | 4.69 | 5.09 | 5.45 | 5.55 | 5.7 | 5.28 | 5.45 | 5.67 |
| Years | 1901 | 1902 | 1903 | 1904 | 1905 | 1906 | 1907 | 1908 | 1909 | 1910[9] |
|---|---|---|---|---|---|---|---|---|---|---|
| Total Fertility Rate in Bulgaria | 5.7 | 5.73 | 5.76 | 5.8 | 5.83 | 5.77 | 5.72 | 5.66 | 5.6 | 5.55 |
| Years | 1911 | 1912 | 1913 | 1914 | 1915[9] |
|---|---|---|---|---|---|
| Total Fertility Rate in Bulgaria | 5.52 | 5.48 | 5.45 | 5.42 | 5.39 |
Vital statistics 1900–1915
| Average population | Live births | Deaths | Natural change | Crude birth rate (per 1000) | Crude death rate (per 1000) | Natural change (per 1000) | |
|---|---|---|---|---|---|---|---|
| 1900 | 3,710,000 | 157,000 | 84,000 | 73,000 | 42.3 | 22.6 | 19.7 |
| 1901 | 3,740,000 | 141,000 | 87,000 | 54,000 | 37.7 | 23.3 | 14.4 |
| 1902 | 3,800,000 | 149,000 | 91,000 | 58,000 | 39.2 | 23.9 | 15.3 |
| 1903 | 3,850,000 | 159,000 | 88,000 | 71,000 | 41.3 | 22.9 | 18.4 |
| 1904 | 3,910,000 | 167,000 | 84,000 | 83,000 | 42.7 | 21.5 | 21.2 |
| 1905 | 4,000,000 | 174,000 | 87,000 | 87,000 | 43.5 | 21.8 | 21.8 |
| 1906 | 4,100,000 | 179,000 | 91,000 | 88,000 | 43.7 | 22.2 | 21.5 |
| 1907 | 4,150,000 | 180,000 | 92,000 | 88,000 | 43.4 | 22.2 | 21.2 |
| 1908 | 4,200,000 | 169,000 | 102,000 | 67,000 | 40.2 | 24.3 | 16.0 |
| 1909 | 4,280,000 | 173,000 | 113,000 | 60,000 | 40.4 | 26.4 | 14.0 |
| 1910 | 4,350,000 | 180,000 | 100,000 | 80,000 | 41.4 | 23.0 | 18.4 |
| 1911 | 4,400,000 | 176,000 | 94,000 | 82,000 | 40.0 | 21.4 | 18.6 |
| 1912 | 4,430,000 | 185,000 | 91,000 | 94,000 | 41.8 | 20.5 | 21.2 |
| 1913 | 4,200,000 | 108,000 | 122,000 | -14,000 | 25.7 | 29.0 | -3.3 |
| 1914 | 4,240,000 | 191,000 | 88,000 | 103,000 | 45.0 | 20.8 | 24.3 |
| 1915 | 4,280,000 | 172,000 | 85,000 | 87,000 | 40.2 | 19.9 | 20.3 |
Vital statistics 1916–1940
| Average population | Live births | Deaths | Natural change | Crude birth rate (per 1000) | Crude death rate (per 1000) | Natural change (per 1000) | Total fertility rates[9] | |
|---|---|---|---|---|---|---|---|---|
| 1916 | 4,660,000 | 99,000 | 97,000 | 2,000 | 21.2 | 20.8 | 0.4 | 5.38 |
| 1917 | 4,690,000 | 81,000 | 99,000 | -18,000 | 17.3 | 21.1 | -3.8 | 5.37 |
| 1918 | 4,740,000 | 100,000 | 152,000 | -52,000 | 21.1 | 32.1 | -11.0 | 5.36 |
| 1919 | 4,790,000 | 157,000 | 97,000 | 60,000 | 32.8 | 20.3 | 12.5 | 5.35 |
| 1920 | 4,850,000 | 193,000 | 104,000 | 89,000 | 39.8 | 21.4 | 18.4 | 5.35 |
| 1921 | 4,890,000 | 197,000 | 106,000 | 91,000 | 40.3 | 21.7 | 18.6 | 5.27 |
| 1922 | 5,010,000 | 203,000 | 106,000 | 97,000 | 40.5 | 21.2 | 19.4 | 5.19 |
| 1923 | 5,090,000 | 192,000 | 108,000 | 84,000 | 37.7 | 21.2 | 16.5 | 5.11 |
| 1924 | 5,210,000 | 207,000 | 108,000 | 99,000 | 39.7 | 20.7 | 19.0 | 5.03 |
| 1925 | 5,310,000 | 196,000 | 102,000 | 94,000 | 36.9 | 19.2 | 17.7 | 4.94 |
| 1926 | 5,420,000 | 203,000 | 93,000 | 110,000 | 37.5 | 17.2 | 20.3 | 4.80 |
| 1927 | 5,510,000 | 183,000 | 112,000 | 71,000 | 33.2 | 20.3 | 12.9 | 4.65 |
| 1928 | 5,590,000 | 185,000 | 99,000 | 86,000 | 33.1 | 17.7 | 15.4 | 4.50 |
| 1929 | 5,670,000 | 173,000 | 103,000 | 70,000 | 30.5 | 18.2 | 12.3 | 4.36 |
| 1930 | 5,740,000 | 180,000 | 93,000 | 87,000 | 31.4 | 16.2 | 15.2 | 4.05 |
| 1931 | 5,800,000 | 171,000 | 98,000 | 73,000 | 29.5 | 16.9 | 12.6 | 3.80 |
| 1932 | 5,884,000 | 186,000 | 96,000 | 90,000 | 31.6 | 16.3 | 15.3 | 4.07 |
| 1933 | 5,961,000 | 174,000 | 93,000 | 81,000 | 29.2 | 15.6 | 13.6 | 3.76 |
| 1934 | 6,039,000 | 181,795 | 85,046 | 96,749 | 30.1 | 14.1 | 16.0 | 3.88 |
| 1935 | 6,102,000 | 160,951 | 89,086 | 71,865 | 26.4 | 14.6 | 11.8 | 3.39 |
| 1936 | 6,154,000 | 159,146 | 87,723 | 71,423 | 25.9 | 14.3 | 11.6 | 3.33 |
| 1937 | 6,196,000 | 150,771 | 84,674 | 66,097 | 24.3 | 13.7 | 10.7 | 3.12 |
| 1938 | 6,244,000 | 142,415 | 85,373 | 57,042 | 22.8 | 13.7 | 9.1 | 2.92 |
| 1939 | 6,292,000 | 138,883 | 84,150 | 54,733 | 22.1 | 13.4 | 8.7 | 2.81 |
| 1940 | 6,341,000 | 140,564 | 85,046 | 55,518 | 22.2 | 13.4 | 8.8 | 2.84 |
Vital statistics 1941 to present
| Total population (31 December) | Live births | Deaths | Natural change | Crude birth rate (per 1000) | Crude death rate (per 1000) | Natural change (per 1000) | Total fertility rates[fn 1] | |
|---|---|---|---|---|---|---|---|---|
| 1941 | 6,711,000 | 147,293 | 85,011 | 62,282 | 21.9 | 12.7 | 9.3 | 2.80 |
| 1942 | 6,767,000 | 153,272 | 88,082 | 65,190 | 22.6 | 13.0 | 9.6 | 2.91 |
| 1943 | 6,823,000 | 148,840 | 88,386 | 60,454 | 21.8 | 13.0 | 8.9 | 2.79 |
| 1944 | 6,879,000 | 151,013 | 94,082 | 56,931 | 22.0 | 13.7 | 8.3 | 2.83 |
| 1945 | 6,936,000 | 166,960 | 103,591 | 63,369 | 24.1 | 14.9 | 9.1 | 3.09 |
| 1946 | 6,993,000 | 179,226 | 95,799 | 83,427 | 25.6 | 13.7 | 11.9 | 3.29 |
| 1947 | 7,048,000 | 169,501 | 94,395 | 75,106 | 24.0 | 13.4 | 10.7 | 3.06 |
| 1948 | 7,130,000 | 175,771 | 89,927 | 85,844 | 24.7 | 12.6 | 12.0 | 3.16 |
| 1949 | 7,195,000 | 177,734 | 84,675 | 93,059 | 24.7 | 11.8 | 12.9 | 3.17 |
| 1950 | 7,251,000 | 182,571 | 74,134 | 108,437 | 25.2 | 10.2 | 15.0 | 2.94 |
| 1951 | 7,258,000 | 152,803 | 77,364 | 75,439 | 21.1 | 10.7 | 10.4 | 2.45 |
| 1952 | 7,275,000 | 154,014 | 84,254 | 69,760 | 21.2 | 11.6 | 9.6 | 2.44 |
| 1953 | 7,346,000 | 153,220 | 68,055 | 85,165 | 20.9 | 9.3 | 11.6 | 2.41 |
| 1954 | 7,423,000 | 149,902 | 68,384 | 81,518 | 20.2 | 9.2 | 11.0 | 2.36 |
| 1955 | 7,499,000 | 150,978 | 67,960 | 83,018 | 20.1 | 9.1 | 11.1 | 2.41 |
| 1956 | 7,576,000 | 147,910 | 71,153 | 76,757 | 19.5 | 9.4 | 10.1 | 2.36 |
| 1957 | 7,651,000 | 141,035 | 65,807 | 75,228 | 18.4 | 8.6 | 9.8 | 2.26 |
| 1958 | 7,728,000 | 138,294 | 60,734 | 77,560 | 17.9 | 7.9 | 10.0 | 2.23 |
| 1959 | 7,829,246 | 136,892 | 73,850 | 63,042 | 17.5 | 9.4 | 8.1 | 2.23 |
| 1960 | 7,905,502 | 140,082 | 63,665 | 76,417 | 17.7 | 8.1 | 9.7 | 2.31 |
| 1961 | 7,980,734 | 137,861 | 62,562 | 75,299 | 17.3 | 7.8 | 9.4 | 2.29 |
| 1962 | 8,045,158 | 134,148 | 69,640 | 64,508 | 16.7 | 8.7 | 8.0 | 2.24 |
| 1963 | 8,111,132 | 132,143 | 66,057 | 66,086 | 16.3 | 8.1 | 8.1 | 2.21 |
| 1964 | 8,177,547 | 130,958 | 64,479 | 66,479 | 16.0 | 7.9 | 8.1 | 2.19 |
| 1965 | 8,230,788 | 125,791 | 66,970 | 58,821 | 15.3 | 8.1 | 7.1 | 2.09 |
| 1966 | 8,285,325 | 123,039 | 68,366 | 54,673 | 14.9 | 8.3 | 6.6 | 2.03 |
| 1967 | 8,335,126 | 124,582 | 74,696 | 49,886 | 14.9 | 9.0 | 6.0 | 2.02 |
| 1968 | 8,404,080 | 141,460 | 72,176 | 69,284 | 16.8 | 8.6 | 8.2 | 2.27 |
| 1969 | 8,464,264 | 143,060 | 80,183 | 62,877 | 16.9 | 9.5 | 7.4 | 2.27 |
| 1970 | 8,514,883 | 138,745 | 77,095 | 61,650 | 16.3 | 9.1 | 7.2 | 2.17 |
| 1971 | 8,557,906 | 135,422 | 82,805 | 52,617 | 15.8 | 9.7 | 6.1 | 2.10 |
| 1972 | 8,594,493 | 131,316 | 84,174 | 47,142 | 15.3 | 9.8 | 5.5 | 2.03 |
| 1973 | 8,647,440 | 139,713 | 81,470 | 58,243 | 16.2 | 9.4 | 6.7 | 2.15 |
| 1974 | 8,710,049 | 149,196 | 85,239 | 63,957 | 17.1 | 9.8 | 7.3 | 2.29 |
| 1975 | 8,731,434 | 144,668 | 89,974 | 54,694 | 16.6 | 10.3 | 6.3 | 2.23 |
| 1976 | 8,785,763 | 144,929 | 88,348 | 56,581 | 16.5 | 10.1 | 6.4 | 2.24 |
| 1977 | 8,822,602 | 141,702 | 94,362 | 47,340 | 16.1 | 10.7 | 5.4 | 2.21 |
| 1978 | 8,805,462 | 136,442 | 92,445 | 43,997 | 15.5 | 10.5 | 5.0 | 2.15 |
| 1979 | 8,846,417 | 135,358 | 94,403 | 40,955 | 15.3 | 10.7 | 4.6 | 2.16 |
| 1980 | 8,876,652 | 128,190 | 97,950 | 30,240 | 14.4 | 11.0 | 3.4 | 2.05 |
| 1981 | 8,905,581 | 124,372 | 95,441 | 28,931 | 14.0 | 10.7 | 3.2 | 2.00 |
| 1982 | 8,929,332 | 124,166 | 100,293 | 23,873 | 13.9 | 11.2 | 2.7 | 2.01 |
| 1983 | 8,950,144 | 122,993 | 102,182 | 20,811 | 13.7 | 11.4 | 2.3 | 2.01 |
| 1984 | 8,971,214 | 122,303 | 101,419 | 20,884 | 13.6 | 11.3 | 2.3 | 2.01 |
| 1985 | 8,949,880 | 118,955 | 107,485 | 11,470 | 13.3 | 12.0 | 1.3 | 1.97 |
| 1986 | 8,966,462 | 120,078 | 104,039 | 16,039 | 13.4 | 11.6 | 1.8 | 2.02 |
| 1987 | 8,976,255 | 116,672 | 107,213 | 9,459 | 13.0 | 11.9 | 1.1 | 1.96 |
| 1988 | 8,986,636 | 117,440 | 107,385 | 10,055 | 13.1 | 11.9 | 1.1 | 1.97 |
| 1989 | 8,767,308 | 112,289 | 106,902 | 5,387 | 12.8 | 12.2 | 0.6 | 1.90 |
| 1990 | 8,669,269 | 105,180 | 108,608 | -3,428 | 12.1 | 12.5 | -0.4 | 1.82 |
| 1991 | 8,595,465 | 95,910 | 110,423 | -14,513 | 11.2 | 12.8 | -1.7 | 1.66 |
| 1992 | 8,484,863 | 89,134 | 107,998 | -18,864 | 10.5 | 12.7 | -2.2 | 1.55 |
| 1993 | 8,459,763 | 84,400 | 109,540 | -25,140 | 10.0 | 12.9 | -3.0 | 1.46 |
| 1994 | 8,427,418 | 79,442 | 111,827 | -32,385 | 9.4 | 13.3 | -3.8 | 1.37 |
| 1995 | 8,384,715 | 71,967 | 114,670 | -42,703 | 8.6 | 13.7 | -5.1 | 1.23 |
| 1996 | 8,340,936 | 72,188 | 117,056 | -44,868 | 8.7 | 14.0 | -5.4 | 1.23 |
| 1997 | 8,283,200 | 64,125 | 121,861 | -57,736 | 7.7 | 14.7 | -7.0 | 1.09 |
| 1998 | 8,230,371 | 65,361 | 118,190 | -52,829 | 7.9 | 14.4 | -6.4 | 1.11 |
| 1999 | 8,190,876 | 72,290 | 111,786 | -39,496 | 8.8 | 13.6 | -4.8 | 1.23 |
| 2000 | 8,149,468 | 73,679 | 115,087 | -41,408 | 9.0 | 14.1 | -5.1 | 1.27 |
| 2001 | 7,868,815 | 68,180 | 112,368 | -44,188 | 8.7 | 14.3 | -5.6 | 1.24 |
| 2002 | 7,805,506 | 66,499 | 112,617 | -46,118 | 8.5 | 14.4 | -5.9 | 1.21 |
| 2003 | 7,745,147 | 67,359 | 111,927 | -44,568 | 8.7 | 14.5 | -5.8 | 1.23 |
| 2004 | 7,688,573 | 69,886 | 110,110 | -40,224 | 9.1 | 14.3 | -5.2 | 1.29 |
| 2005 | 7,629,371 | 71,075 | 113,374 | -42,299 | 9.2 | 14.6 | -5.4 | 1.31 |
| 2006 | 7,572,673 | 73,978 | 113,438 | -39,460 | 9.6 | 14.7 | -5.1 | 1.38 |
| 2007 | 7,518,002 | 75,349 | 113,004 | -37,655 | 9.8 | 14.8 | -5.0 | 1.42 |
| 2008 | 7,467,119 | 77,712 | 110,523 | -32,811 | 10.2 | 14.5 | -4.3 | 1.48 |
| 2009 | 7,421,766 | 80,956 | 108,068 | -27,112 | 10.7 | 14.2 | -3.5 | 1.57 |
| 2010 | 7,369,431 | 75,513 | 110,165 | -34,652 | 10.0 | 14.6 | -4.6 | 1.49 |
| 2011 | 7,327,224 | 70,846 | 108,258 | -37,412 | 9.6 | 14.7 | -5.1 | 1.51 |
| 2012 | 7,284,552 | 69,121 | 109,281 | -40,160 | 9.5 | 15.0 | -5.5 | 1.50 |
| 2013 | 7,245,677 | 66,578 | 104,345 | -37,767 | 9.2 | 14.4 | -5.2 | 1.48 |
| 2014 | 7,202,198 | 67,585 | 108,952 | -41,367 | 9.4 | 15.1 | -5.7 | 1.53 |
| 2015[13] | 7,153,784 | 65,950 | 110,117 | -44,167 | 9.2 | 15.3 | -6.1 | 1.53 |
| 2016[14] | 7,101,859 | 64,984 | 107,580 | -42,596 | 9.1 | 15.1 | -6.0 | 1.54 |
| 2017[15] | 7,050,034 | 63,955 | 109,791 | -45,836 | 9.0 | 15.5 | -6.5 | 1.56 |
| 2018[16] | 7,000,039 | 62,197 | 108,526 | -46,329 | 8.9 | 15.4 | -6.5 | 1.56 |
| 2019[17] | 6,951,482 | 61,538 | 108,083 | -46,545 | 8.8 | 15.5 | -6.7 | 1.58 |
Current vital statistics
- Number of births January–September 2019 = 41,828
- Number of births January–September 2020 =
 41,895
 - Number of deaths January–September 2019 = 77,987
- Number of deaths January–September 2020 =
 75,165
 - Natural Decrease January–September 2019 = -36,159
- Natural Decrease January–September 2020 = -33,270
https://ncpha.government.bg/images/___NCPHA/__HealthStatistics/_Operational/2019/2019_1_BirthsByRegion.pdf https://ncpha.government.bg/images/___NCPHA/__HealthStatistics/_Operational/2019/2019_2_BirthsByRegion.pdf https://ncpha.government.bg/images/___NCPHA/__HealthStatistics/_Operational/2020/liveBirths_I_20.pdf https://ncpha.government.bg/images/___NCPHA/__HealthStatistics/_Operational/2020/liveBirths_II_20.pdf https://ncpha.government.bg/images/___NCPHA/__HealthStatistics/_Operational/2019/2019_3_BirthsByRegion.pdf https://ncpha.government.bg/images/___NCPHA/__HealthStatistics/_Operational/2020/liveBirths_III_20.pdf
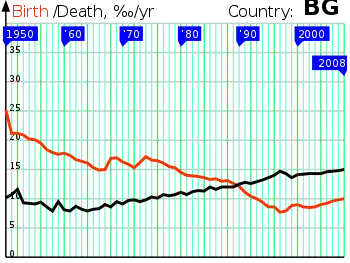
Birth rates and fertility

 Birth rate in 2014
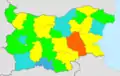 Fertility rate in 2013
 Fertility rate in 2014
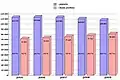 Bulgaria's deaths and births (2005–2009).
In 2016 a total of 64,984 live births were recorded in Bulgaria.[18] The country has a crude birth rate of 9.1‰.
Seventy years ago (in the census of 1946), Bulgaria had a crude birth rate of 25,6‰. Ethnic Bulgarians (23,3‰) had a much lower crude birth rate compared to the two largest minorities: Turks (40,9‰) and Roma (47,2‰).[19] However, it is unlikely that this difference continued since then, as birth rates in the Balkan countries dropped sharply.
Bulgaria has a low total fertility rate of 1.54 children per woman (at the end of 2016). This is up significantly from the late 1990s, but still below replacement and not enough to prevent further population decline, especially with emigration. Provinces with large Roma populations (for example Sliven, Montana and Yambol) tend to have higher fertility rates (and higher death rates) compared to other areas, whereas Turkish fertility is similar to the Bulgarian majority.[20]
| Province | TFR (2010) | TFR (2016) | TFR (2017) | TFR (2018) | TFR (2019) |
|---|---|---|---|---|---|
| Northwest Region | 1.53 | 1.72 | 1.72 | 1.75 | 1.77 |
| Vidin | 1.50 | 1.45 | 1.58 | 1.68 | 1.65 |
| Vratsa | 1.46 | 1.77 | 1.68 | 1.81 | 1.83 |
| Lovech | 1.58 | 1.66 | 1.79 | 1.89 | 1.84 |
| Montana | 1.52 | 1.74 | 1.65 | 1.67 | 1.62 |
| Pleven | 1.56 | 1.80 | 1.79 | 1.71 | 1.81 |
| North Central Region | 1.32 | 1.45 | 1.45 | 1.45 | 1.43 |
| Veliko Tarnovo | 1.19 | 1.40 | 1.43 | 1.34 | 1.27 |
| Gabrovo | 1.43 | 1.41 | 1.49 | 1.58 | 1.69 |
| Razgrad | 1.37 | 1.49 | 1.48 | 1.65 | 1.60 |
| Ruse | 1.34 | 1.40 | 1.37 | 1.41 | 1.30 |
| Silistra | 1.49 | 1.77 | 1.71 | 1.55 | 1.76 |
| Northeast Region | 1.53 | 1.50 | 1.48 | 1.49 | 1.52 |
| Varna | 1.57 | 1.45 | 1.44 | 1.44 | 1.47 |
| Dobrich | 1.44 | 1.53 | 1.51 | 1.44 | 1.56 |
| Targovishte | 1.67 | 1.59 | 1.57 | 1.63 | 1.61 |
| Shumen | 1.42 | 1.54 | 1.45 | 1.53 | 1.51 |
| Southeast Region | 1.67 | 1.82 | 1.88 | 1.84 | 1.87 |
| Burgas | 1.54 | 1.63 | 1.65 | 1.61 | 1.69 |
| Sliven | 1.95 | 2.24 | 2.34 | 2.27 | 2.35 |
| Stara Zagora | 1.64 | 1.73 | 1.80 | 1.76 | 1.72 |
| Yambol | 1.70 | 1.98 | 2.00 | 2.13 | 2.06 |
| Southwest Region | 1.42 | 1.36 | 1.38 | 1.38 | 1.42 |
| Blagoevgrad | 1.46 | 1.46 | 1.45 | 1.50 | 1.62 |
| Kyustendil | 1.33 | 1.63 | 1.75 | 1.76 | 1.95 |
| Pernik | 1.35 | 1.62 | 1.66 | 1.73 | 1.68 |
| Sofia | 1.45 | 1.74 | 1.73 | 1.80 | 1.91 |
| Sofia (city) | 1.39 | 1.27 | 1.29 | 1.26 | 1.28 |
| South Central Region | 1.50 | 1.61 | 1.65 | 1.65 | 1.66 |
| Kardzhali | 1.49 | 1.64 | 1.66 | 1.70 | 1.74 |
| Pazardzhik | 1.58 | 1.72 | 1.75 | 1.85 | 1.81 |
| Plovdiv | 1.49 | 1.56 | 1.60 | 1.61 | 1.60 |
| Smolyan | 1.33 | 1.45 | 1.47 | 1.40 | 1.49 |
| Haskovo | 1.53 | 1.70 | 1.75 | 1.62 | 1.71 |
| Bulgaria | 1.49 | 1.54 | 1.56 | 1.56 | 1.58 |
Regional differences
As of 2017, the municipality of Nikolaevo has the highest crude birth rate with 18.6‰, followed by Tvarditsa (16.7‰) and Kaynardzha (15.7‰). All these municipalities have relatively large Romani populations.
On the other hand, the municipalities of Georgi Damyanovo, Banite and Nevestino have a extremely low birth rates. These municipalities are almost exclusively inhabited by ethnic Bulgarians.
Teenage pregnancy
Bulgaria has one of the highest share of teenage pregnancy in Europe. Nevertheless, this number is declining rapidly in recent years.
| Number of teenage mothers in Bulgaria in the period 1990-2017[23] | ||||||||||||||||||
|---|---|---|---|---|---|---|---|---|---|---|---|---|---|---|---|---|---|---|
| Year | 1990 | 1995 | 2000 | 2005 | 2010 | 2015 | 2017 | |||||||||||
| All live births in Bulgaria | 105,180 | 71,967 | 73,679 | 69,886 | 75,513 | 65,950 | 63,955 | |||||||||||
| Mothers aged under twenty | 22,518 | 16,278 | 12,787 | 10,625 | 8,411 | 6,274 | 6,038 | |||||||||||
| Share of teenage mothers | ||||||||||||||||||
The ten municipalities with the largest absolute number of teenage mothers are: Sliven (373), Sofia (339), Plovdiv (245), Pazardzhik (161), Stara Zagora (141), Nova Zagora (131), Burgas (108), Yambol (106), Haskovo (96) and Varna (86).[24]
| Top ten municipalities with the highest share of mothers aged under twenty (2017)[22] | ||||||||||||||||||
|---|---|---|---|---|---|---|---|---|---|---|---|---|---|---|---|---|---|---|
| Municipality | All live births | Births to mothers aged under twenty | % of all live births | |||||||||||||||
| Bolyarovo Municipality | 25 | 10 | 40.0% | |||||||||||||||
| Gramada Municipality | 10 | 4 | 40.0% | |||||||||||||||
| Bratya Daskalovi Municipality | 98 | 37 | 37.8% | |||||||||||||||
| Nikolaevo Municipality | 82 | 31 | 37.8% | |||||||||||||||
| Gurkovo Municipality | 73 | 27 | 37.0% | |||||||||||||||
| Kaynardzha Municipality | 80 | 29 | 36.3% | |||||||||||||||
| Maglizh Municipality | 121 | 43 | 35.5% | |||||||||||||||
| Yablanitsa Municipality | 82 | 29 | 35.4% | |||||||||||||||
| Ihtiman Municipality | 205 | 71 | 34.6% | |||||||||||||||
| Dimovo Municipality | 65 | 22 | 33.8% | |||||||||||||||
Life expectancy at birth
- Total population: 74.83 years
- Male: 71.37 years
- Female: 78.39 years (2016-2018 est.)[1]
Average life expectancy at age 0 of the total population.[25]
| Period | Life expectancy in Years |
|---|---|
| 1950–1955 | 62.33 |
| 1955–1960 | |
| 1960–1965 | |
| 1965–1970 | |
| 1970–1975 | |
| 1975–1980 | |
| 1980–1985 | |
| 1985–1990 | |
| 1990–1995 | |
| 1995–2000 | |
| 2000–2005 | |
| 2005–2010 | |
| 2010–2015 | |
| 2016–2018 |
Kardzhali Province and Sofia City have the highest life expectancy with 76.6 years for both sexes. The lowest life expectancy is recorded in the Northwestern provinces like Montana (72.7 years), Vratsa (72.8 years) and Vidin (72.9 years).[26]
Infant mortality rate
- Total: 5.8 deaths/1,000 live births (2018)[1]
- Male: 6.2 deaths/1,000 live births (2018)
- Female: 5.3 deaths/1,000 live births (2018)
Projections
The following forecast for the future population is an official estimate of the National Statistical Institute of Bulgaria.[27]
| Year | Population |
| 2015 | 7,159,819 |
| 2020 | 6,950,436 |
| 2025 | 6,734,989 |
| 2030 | 6,519,217 |
| 2035 | 6,311,454 |
| 2040 | 6,115,526 |
| 2045 | 5,929,267 |
| 2050 | 5,748,061 |
| 2055 | 5,567,060 |
| 2060 | 5,384,040 |
Demographic statistics
Demographic statistics according to the World Population Review.[28]
- One birth every 8 minutes
- One death every 5 minutes
- One net migrant every 111 minutes
- Net loss of one person every 11 minutes
Demographic statistics according to the CIA World Factbook, unless otherwise indicated.[29]
- Population
- 7,057,504 (July 2018 est.)
- Ethnic groups
- Bulgarian 76.9%, Turkish 8%, Romani 4.4%, other 0.7% (including Russian, Armenian, and Vlach), other (unknown) 10% (2011 est.)
- note: Romani populations are usually underestimated in official statistics and may represent 9–11% of Bulgaria's population
- Languages
- Bulgarian (official) 76.8%, Turkish 8.2%, Romani 3.8%, other 0.7%, unspecified 10.5% (2011 est.)
- Religions
- Eastern Orthodox 59.4%, Muslim 7.8%, other (including Catholic, Protestant, Armenian Apostolic Orthodox, and Jewish) 1.7%, none 3.7%, unspecified 27.4% (2011 est.)
- Age structure
- 0-14 years: 14.6% (male 530,219 /female 500,398)
- 15-24 years: 9.43% (male 346,588 /female 318,645)
- 25-54 years: 43.12% (male 1,565,770 /female 1,477,719)
- 55-64 years: 13.3% (male 442,083 /female 496,888)
- 65 years and over: 19.54% (male 557,237 /female 821,957) (2018 est.)
- Median age
- total: 43 years. Country comparison to the world: 22nd
- male: 41.2 years
- female: 44.9 years (2018 est.)
- Birth rate
- 8.5 births/1,000 population (2018 est.) Country comparison to the world: 215th
- Death rate
- 14.5 deaths/1,000 population (2018 est.) Country comparison to the world: 4th
- Total fertility rate
- 1.47 children born/woman (2018 est.) Country comparison to the world: 201st
- Net migration rate
- -0.3 migrant(s)/1,000 population (2018 est.) Country comparison to the world: 115th
- Population growth rate
- -0.63% (2018 est.) Country comparison to the world: 225th
- Mother's mean age at first birth
- 26.7 years (2014 est.)
- Dependency ratios
- total dependency ratio: 51.7 (2015 est.)
- youth dependency ratio: 21.2 (2015 est.)
- elderly dependency ratio: 30.5 (2015 est.)
- potential support ratio: 3.3 (2015 est.)
- Urbanization
- urban population: 75% of total population (2018)
.rate of urbanization: -0.22% annual rate of change (2015-20 est.)
- potential support ratio: 3.3 (2015 est.)
- Life expectancy at birth
- total population: 74.8 years. Country comparison to the world: 119th
- male: 71.5 years
- female: 78.3 years (2018 est.)
- Literacy
definition: age 15 and over can read and write (2015 est.)
- total population: 98.4%
- male: 98.7%
- female: 98.1% (2015 est.)
- School life expectancy (primary to tertiary education)
- total: 15 years
- male: 15 years
- female: 15 years (2016)
- Unemployment, youth ages 15–24
- total: 17.2%. Country comparison to the world: 77th
- male: 17.4%
- female: 16.9% (2016 est.)
Demographic policies
The progressive decrease of the Bulgarian population is hindering economic growth and welfare improvement, and the management measures taken to mitigate the negative consequences do not address the essence of the problem. The Government Program for the period 2017 - 2021 is the first one that aims at overturning the trend. The program also identifies the priority means for achieving this goal: measures to increase the birth rate, reduce youth emigration, and build up regulatory and institutional capacity to implement a modern immigration policy tailored to the needs of the Bulgarian business.[30][31]
Ethnic groups
| Ethnic group |
census 1900 | census 1905 | census 1910 | census 1920 | census 1926 | census 1934 | census 1946 | census 1956 | ||||||||||||||||||
|---|---|---|---|---|---|---|---|---|---|---|---|---|---|---|---|---|---|---|---|---|---|---|---|---|---|---|
| Number | % | Number | % | Number | % | Number | % | Number | % | Number | % | Number | % | Number | % | |||||||||||
| Bulgarians[32] | 2,888,219 | 77.1 | 3,203,810 | 79.4 | 3,518,756 | 81.1 | 4,036,056 | 83.3 | 4,557,706 | 83.2 | 5,204,217 | 85.6 | 5,903,580 | 84.0 | 6,506,541 | 85.5 | ||||||||||
| Turks[32] | 531,240 | 14.2 | 488,010 | 12.1 | 465,641 | 10.7 | 520,339 | 10.7 | 577,552 | 10.5 | 591,193 | 9.7 | 675,500 | 9.6 | 656,025 | 8.6 | ||||||||||
| Roma[32] | 89,549 | 2.4 | 99,004 | 2.5 | 122,296 | 2.8 | 98,451 | 2.0 | 134,844 | 2.5 | 149,385 | 2.5 | 170,011 | 2.4 | 197,8651 | 2.6 | ||||||||||
| Russians | 1,685 | 0.0 | 3,275 | 0.2 | 2,505 | 0.2 | 9,080 | 0.2 | 19,706 | 0.4 | 11,928 | 0.2 | 13,200 | 0.2 | 10,551 | 0.1 | ||||||||||
| Armenians | 14,581 | 0.4 | 12,932 | 0.3 | 11,509 | 0.2 | 27,332 | 0.5 | 25,963 | 0.4 | 21,637 | 0.3 | 21,954 | 0.3 | ||||||||||||
| Sarakatsani | 6,128 | 0.2 | 7,251 | 0.2 | 2,085 | 0.0 | ||||||||||||||||||||
| Macedonians | - | - | - | - | - | - | [33] 169,5442 | 2.4 | 187,7892 | 2.5 | ||||||||||||||||
| Greeks | 66,635 | 1.8 | 63,487 | 1.6 | 43,275 | 1.0 | 42,074 | 0.9 | 10,564 | 0.2 | 9,601 | 0.2 | 7,437 | 0.1 | ||||||||||||
| Jews | 33,661 | 0.9 | 37,663 | 0.9 | 40,133 | 0.9 | 43,209 | 0.9 | 46,558 | 0.8 | 48,565 | 0.8 | 44,209 | 0.6 | 6,027 | 0.1 | ||||||||||
| Romanians | 71,063 | 1.9 | 75,773 | 1.9 | 79,429 | 1.8 | 57,312 | 1.2 | 69,080 | 1.2 | 16,504 | 0.3 | 3,749 | 0.0 | ||||||||||||
| Tatars | 18,884 | 0.5 | 17,942 | 0.4 | 18,228 | 0.4 | 6,191 | 0.1 | 5,993 | 0.1 | ||||||||||||||||
| Gagauzes | 10,175 | 0.3 | 4,362 | 0.1 | ||||||||||||||||||||||
| Others | 13,199 | 0.2 | ||||||||||||||||||||||||
| Undeclared | 0 | - | 0 | - | 0 | - | 0 | - | 0 | - | 0 | - | 0 | - | 0 | - | ||||||||||
| Total | 3,744,283 | 4,035,575 | 4,337,513 | 4,846,971 | 5,528,741 | 6,077,939 | 7,029,349 | 7,613,709 | ||||||||||||||||||
| 1 According to x files of the state, the number of the Romani was reduced by 25,000 in 1956.[34]
2There are strong indications that in the 1946 and the 1956 census the population was forced to list as ethnic Macedonians against their will by the communist government in accordance with an agreement with Yugoslavia.[35][36] | ||||||||||||||||||||||||||
| Nationalities | census 1965 | census 1975 | census 19802[34] | census 19892[34] | census 19922[34] | [37] census 1992 | [38] census 2001 | [32] census 20111 | ||||||||||||||||||
|---|---|---|---|---|---|---|---|---|---|---|---|---|---|---|---|---|---|---|---|---|---|---|---|---|---|---|
| Number | % | Number | % | Number | % | Number | % | Number | % | Number | % | Number | % | Number | % / % of Total | |||||||||||
| Bulgarians[32] | 7,231,243 | 87.9 | 7,930,024 | 90.9 | 7,271,185 | 85.7 | 6,655,210 | 83.9 | 5,664,624 | 84.8 / 76.9 | ||||||||||||||||
| Turks[32] | 780,928 | 9.5 | 730,728 | 8.4 | 800,052 | 9.4 | 746,664 | 9.4 | 588,318 | 8.8 / 8.0 | ||||||||||||||||
| Roma[32] | 148,874 | 1.8 | 523,519 | 576,927 | 550,000 | 6.5 | 313,396 | 3.7 | 370,908 | 4.7 | 325,343 | 4.9 / 4.4 | ||||||||||||||
| Russians | 10,815 | 0.1 | 17,139 | 0.2 | 15,595 | 0.2 | 9,978 | 0.1 | ||||||||||||||||||
| Armenians | 20,282 | 0.2 | 14,526 | 0.2 | 13,677 | 0.2 | 10,832 | 0.1 | 6,552 | 0.1 | ||||||||||||||||
| Vlachs | 5,159 | 0.1 | 10,566 | 0.1 | 3,684 | 0.1 | ||||||||||||||||||||
| Sarakatsani | 5,144 | 0.1 | 4,107 | 0.1 | 2,556 | 0.0 | ||||||||||||||||||||
| Ukrainians | 1,864 | 0.0 | 2,489 | 0.0 | 1,789 | 0.0 | ||||||||||||||||||||
| Macedonians | 9,632 | 0.1 | 10,803 | 0.1 | 5,071 | 0.1 | 1,654 | 0.0 | ||||||||||||||||||
| Greeks | 8,241 | 0.1 | 4,930 | 0.1 | 3,408 | 0.0 | 1,379 | 0.0 | ||||||||||||||||||
| Jews | 5,108 | 0.1 | 3,076 | 0.0 | 3,461 | 0.0 | 1,363 | 0.0 | 1,162 | 0.0 | ||||||||||||||||
| Romanians | 2,491 | 0.0 | 1,088 | 0.0 | 891 | 0.0 | ||||||||||||||||||||
| Tatars | 6,430 | 0.1 | 5,963 | 0.1 | 4,515 | 0.1 | 1,803 | 0.0 | ||||||||||||||||||
| Gagauzes | 1,478 | 0.0 | 540 | 0.0 | ||||||||||||||||||||||
| Other | 23,542 | 0.3 | 12,342 | 0.2 | 19,659 | 0.3 | ||||||||||||||||||||
| Undeclared | 0 | - | 0 | - | 8,481 | 0.1 | 86,915 | 1.1 | 736,981 | 10.01 | ||||||||||||||||
| Total | 8,227,966 | 8,727,771 | 8,487,317 | 7,932,984 | 7,364,570 | |||||||||||||||||||||
| 1 The 2011 percentage of the ethnic groups is calculated only from those who answered the optional question on ethnicity (6,680,980 in total) and does not include around 750,000 people who did not answer the question or 10% from the population.
2 Denotes secret backstage censuses ordered by the Ministry of Interior for enumerating Romani people alone. In 1989, over half of the Romani were recorded as Turkified and having fluid Turkish identity.[34] | ||||||||||||||||||||||||||
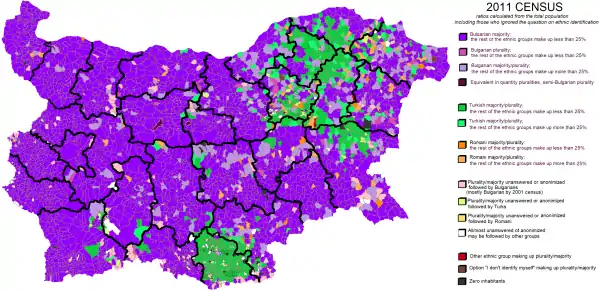
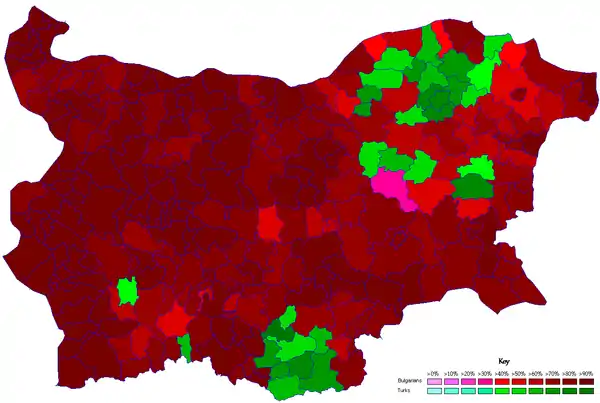
The censuses in 1880, 1887 and 1892 did not have a question on ethnic affiliation. The following table shows the ethnic composition of all Provinces of Bulgaria according to the 2011 census(% from the declared):
| Province | Ethnicity | Ethnicity | Ethnicity |
|---|---|---|---|
| Bulgarian | Turkish | Roma | |
| Blagoevgrad Province | 89% | 6% | 3% |
| Burgas Province | 80% | 13% | 5% |
| Dobrich Province | 75% | 13% | 9% |
| Gabrovo Province | 92% | 6% | 1% |
| Haskovo Province | 79% | 13% | 7% |
| Kardzhali Province | 30% | 66% | |
| Kyustendil Province | 93% | 0% | 6% |
| Lovech Province | 91% | 3% | 4% |
| Montana Province | 86% | 0% | 13% |
| Pazardzhik Province | 84% | 6% | 8% |
| Pernik Province | 96% | 0% | 3% |
| Pleven Province | 91% | 4% | 4% |
| Plovdiv Province | 87% | 6% | 5% |
| Razgrad Province | 43% | 50% | 5% |
| Ruse Province | 81% | 13% | 4% |
| Shumen Province | 59% | 30% | 8% |
| Silistra Province | 57% | 36% | 5% |
| Sliven Province | 77% | 10% | 12% |
| Smolyan Province | 91% | 5% | 0% |
| Sofia City | 96% | 1% | 2% |
| Sofia Province | 91% | 0% | 7% |
| Stara Zagora Province | 86% | 5% | 8% |
| Targovishte Province | 55% | 36% | 7% |
| Varna Province | 87% | 7% | 3% |
| Veliko Tarnovo Province | 90% | 7% | 2% |
| Vidin Province | 91% | 0% | 8% |
| Vratsa Province | 93% | 0% | 6% |
| Yambol Province | 87% | 3% | 8% |
| Source (2011 census):[39] | |||
Languages
| Mother tongue |
census 1880[41][42] | census 1887[43] | census 1892[44] | |||
|---|---|---|---|---|---|---|
| Number | % | Number | % | Number | % | |
| Bulgarian | 1,345,507 | 67.0 | 2,326,250 | 73.7 | 2,505,326 | 75.7 |
| Turkish/Gagauz | 527,284 | 26.3 | 607,331 | 19.3 | 569,728 | 17.2 |
| Vlach | 49,070 | 2.4 | ||||
| Romanian | 62,628 | 1.9 | ||||
| Roma | 37,600 | 1.9 | 50,291 | 1.6 | 52,132 | 1.6 |
| Ladino | 14,020 | 0.7 | 27,531 | 0.8 | ||
| Tatar | 12,376 | 0.6 | 16,290 | 0.5 | ||
| Greek | 11,152 | 0.6 | 58,326 | 1.8 | 58,518 | 1.8 |
| Armenian | 3,837 | 6,445 | 0.2 | |||
| Serbo-Croatian | 1,894 | |||||
| Serbian | 818 | |||||
| German/Yiddish | 1,280 | |||||
| German | 3,620 | |||||
| Russian | 1,123 | 928 | ||||
| Albanian | 530 | |||||
| Italian | 515 | 803 | ||||
| Hungarian | 220 | |||||
| Czech | 174 | |||||
| French | 164 | 356 | ||||
| Arab | 97 | |||||
| Polish | 92 | |||||
| English | 64 | |||||
| Circassian | 63 | |||||
| Persian | 58 | |||||
| Others | 402 | 4,425 | ||||
| Unknown | 1,165 | |||||
| Total | 2,007,919 | 3 154 375 | 3,310,713 | |||
| Territory (km2) | 63,752 | 95,223 | 95,223 | |||
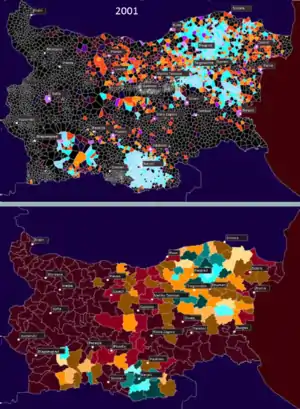
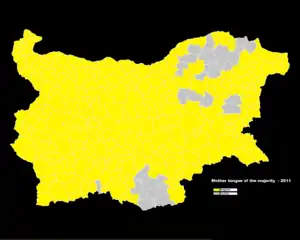
The 2001 census defines an ethnic group as a "community of people, related to each other by origin and language, and close to each other by mode of life and culture"; and one's mother tongue as "the language a person speaks best and usually uses for communication in the family (household)".[45] According to the 2011 census, among the Bulgarians 99.4% indicate Bulgarian as a mother tongue, 0.3% - Turkish, 0.1% - Roma and 0.1% others; among Turks 96.6% have pointed the Turkish as a mother tongue and 3.2% - Bulgarian; among the Roma 85% indicate Roma language as a mother tongue, 7.5% - Bulgarian, 6.7% - Turkish and 0.6% - Romanian.
Religion
Bulgaria's traditional religion according to the constitution is the Orthodox Christianity, while Bulgaria is a secular state too. Since the last two censuses (2001 and 2011) provide widely divergent results, they are both shown in the table below. It is noteworthy that over a fifth of the population chose not to respond to this question in the 2011 census.

2001[46] 2011[7][47] Orthodox Christian 82.6% 59.4% Muslim 12.2% 7.8% (7.4% Sunni; 0.4% Shia) Catholic 0.6% 0.7% Protestant 0.5% 0.9% Other 0.2% 0.15% None 3.9% 9.3% No response - 21.8%
The results of the Bulgarian 2011 Census, in which the indication of answer regarding the question for confession was optional, are as follows:[48]
| Group | Population | % of declared | % of total |
|---|---|---|---|
| Orthodoxy | 4,374,135 | 76.0% | 59.4% |
| Undeclared | 1,606,269 | - | 21.8% |
| Irreligion | 682,162 | 11.8% | 9.3% |
| Islam | 577,139 | 10.0% | 7.8% |
| Protestantism | 64,476 | 1.1% | 0.9% |
| Roman Catholicism | 48,945 | 0.8% | 0.7% |
| Oriental Orthodoxy | 1,715 | 0.0% | 0.0% |
| Jews | 706 | 0.0% | 0.0% |
| Others | 9,023 | 0.2% | 0.1% |
| Figure of percentage | - | 5,758,301 | 7,364,570 |
The results of the Bulgarian 2001 Census by ethnic groups, the latest census in which the indication of identification (whether by confession or as irreligious) in the question for confession was obligatory, are as follows:[49][50]
| Ethnic groups by confession |
Total | Bulgarians | Turks | Roma | Others | |||||
|---|---|---|---|---|---|---|---|---|---|---|
| Number | % | Number | % | Number | % | Number | % | Number | % | |
| Orthodoxy | 6,552,751 | 82.6 | 6,315,938 | 94.9 | 5,425 | 0.7 | 180,326 | 48.6 | 51,062 | |
| Islam | 966,978 | 12.2 | 131,531 | 2.0 | 713,024 | 95.5 | 103,436 | 27.9 | 18,987 | |
| Irreligion | 308,116 | 3.9 | 151,008 | 2.3 | 23,146 | 3.1 | 59,669 | 16.1 | ||
| Roman Catholicism | 43,811 | 0.6 | 37,811 | 0.6 | 2,561 | 0.3 | ||||
| Protestantism | 42,308 | 0.5 | 14,591 | 0.2 | 2,066 | 0.3 | 24,651 | 6.6 | 1,000 | |
| Others | 14,937 | 0.2 | 4,331 | 0.1 | 442 | 0.1 | ||||
| Total population | 7,928,901 | 100.0 | 6,655,210 | 100.0 | 746,664 | 100.0 | 370,908 | 100.0 | 100.0 | |
Migration
In relation to internal migration, according to the 1910 census, 300,000 or almost 10% of the ethnic Bulgarians were born in another Bulgarian municipality than the one they were enumerated in. The same data shows that the foreign-born ethnic Bulgarians numbered 78,000, or 2% of them, most numerous of whom were the 61,000 Ottoman-born, 9,000 Romanian-born and by less than 2,000 Austro-Hungarian, Serbian and Russian-born.[51] By the 1926 census, there had been 253,000 refugees with granted households and land or citizenship but with many more in towns of uncertain number. 35% came from Eastern Thrace, 30% came from Greek Macedonia, another 18% from Western Thrace, 8% from Dobruja, 4% from the Western Outlands, 3% from Asia Minor, and 2% from North Macedonia. They constituted 6% of the country's population. In 1940, 70,000 Bulgarians were exchanged from Northern Dobruja. The total number of refugees in 1878-1940 is estimated at between 700,000 and 1,200,000.[52]
 Percentage of Bulgarians born in a different municipality of Bulgaria calculated from the total of the ethnic Bulgarians in 1910
 Percentage of foreign-born Bulgarians calculated from the total of the ethnic Bulgarians in 1910
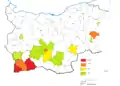 Percentage of Bulgarians born in Greek Macedonia and North Macedonia in 1946 calculated from the total of the ethnic Bulgarians
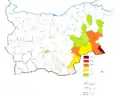 Part of the Bulgarians born in East Thrace, West Thrace and Asia Minor in 1946 calculated from the total of the ethnic Bulgarians
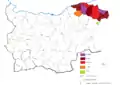 Part of the Bulgarians born in Northern Dobruja, Romania and Serbia in 1946 calculated from the total of the ethnic Bulgarians
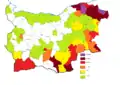 Foreign born as a part of the ethnic Bulgarians in 1946
According to the 2011 census Russian citizens are the most numerous foreigners - 11 991, followed by 8 444 EU citizens (UK- 2 605, Greece - 1 253, Germany- 848, Poland - 819 and Italy - 456), citizens of Ukraine - 3 064, North Macedonia - 1 091, Moldova - 893 and Serbia - 569. 22.8% of them are from Asia, mostly from Turkey. Those with dual Bulgarian and other citizenship were 22 152, or 0.3% of the population. Of them persons with Bulgarian and Russian citizenship were 5 257 (23.7%), followed by persons with Bulgarian and Turkish citizenship - 4 282 (19.3%), Bulgarian and citizenship of the USA- 1 725 (7.8%). There are at least 17,527 Refugees of the Syrian Civil War with applications in Bulgaria. In 2001-2015 185,447 people applied for Bulgarian citizenship and 116,222 were provided with. 113,647 were granted on grounds of proven Bulgarian ancestry, including 59,968 North Macedonia citizens. 29,218 were Moldovan citizens, 5930 Ukrainians, 5374 Serbians, 5194 Russians, 3840 Israeli, 2192 Albanians, 692 Turks and others.[53] In 2016, 12,880 foreigners were naturalized, including 6196 Macedonians.[54]
Population by country of birth:[55]
| 2011 | 2013 | 2015 | |
|---|---|---|---|
| 7,290,666 | 7,188,273 | 7,077,389 | |
| Total foreign-born | 78,621 | 96,113 | 123,803 |
| 18,725 | 19,533 | 24,416 | |
| 3,955 | 6,227 | 9,284 | |
| 1,250 | 1,298 | 8,318 | |
| 4,928 | 7,377 | 7,166 | |
| 5,877 | 6,084 | 7,039 | |
| 2,083 | 3,638 | 5,533 | |
| 3,042 | 5,066 | 6,738 | |
| 1,558 | 4,065 | 5,240 | |
| 6,045 | 5,380 | 4,612 | |
| 1,082 | 2,261 | 2,830 | |
| 2,426 | 2,384 | 2,742 | |
| 1,180 | 2,023 | 2,431 | |
| 1,893 | 1,996 | 2,363 | |
| 2,306 | 2,246 | 2,318 | |
| 2,152 | 1,871 | 1,886 | |
| 562 | 1,255 | 1,781 | |
| 1,196 | 1,443 | 1,648 | |
| 1,472 | 1,422 | 1,565 | |
| 970 | 1,067 | 1,515 | |
| 410 | 1,009 | 1,481 | |
| 860 | 929 | 1,236 | |
| 924 | 1,028 | 1,186 | |
| 1,134 | 1,078 | 1,130 | |
| 298 | 735 | 1,040 | |
| 244 | 679 | 1,008 | |
| Unknown | 144 | 166 | 1,006 |
Foreigners by nationality:
| 2011 | 2015 | |
|---|---|---|
| Total | 36,723 | 65,622 |
| 11,991 | 17,943 | |
| 2,741 | 8,157 | |
| 729 | 7,508 | |
| 3,064 | 3,874 | |
| 2,605 | 3,693 | |
| Unknown | 2,538 | |
| 1,253 | 2,094 | |
| Stateless | 1,875 | |
| 1,091 | 1,289 | |
| 848 | 1,266 | |
| 1,167 | 1,175 | |
| 749 | 1,147 | |
| 893 | 1,018 | |
| 819 | 978 | |
| 876 | ||
| 456 | 815 | |
| 569 | 813 | |
| 706 | 806 | |
| 712 |
Age structure
- 0–14 years:
 13.2%
13.2% - 15–65 years: 68.3%
- 65 years and over: 18.5% (Census 2011)[7]
At the 2011 census the largest decadal age group of the identified as Romani people is the 0–9 years old or 21% of them, the same age group accounted for 10% of the Turks and 7% of the Bulgarians.[56] Experts estimate that the Romani in some provinces make up 40% of all aged between 0 and 9 years.[57] Amongst those who did not answer the question on ethnic group lowest is the share of people aged 60+ years.
| Children aged up to nine years old by ethnic structure per province(% from the declared) | |||
| Province | Ethnicity | Ethnicity | Ethnicity |
|---|---|---|---|
| Bulgarian | Turkish | Roma | |
| Bulgaria | 72.9% | 10.6% | 12.0% |
| Blagoevgrad Province | 80.9% | 7.3% | 7.8% |
| Burgas Province | 68.5% | 16.2% | 9.7% |
| Dobrich Province | 56.9% | 17.1% | 18.9% |
| Gabrovo Province | 85.0% | 8.2% | 3.8% |
| Haskovo Province | 62.7% | 16.5% | 16.7% |
| Kardzhali Province | 23.8% | 67.8% | 2.7% |
| Kyustendil Province | 79.4% | 0.0% | 16.1% |
| Lovech Province | 78.0% | 3.6% | 14.8% |
| Montana Province | 66.8% | 0.1% | 29.0% |
| Pazardzhik Province | 67.3% | 8.7% | 16.7% |
| Pernik Province | 90.3% | 0.1% | 7.5% |
| Pleven Province | 78.5% | 4.4% | 13.5% |
| Plovdiv Province | 74.1% | 9.3% | 11.9% |
| Razgrad Province | 33.9% | 50.0% | 10.2% |
| Ruse Province | 72.2% | 15.1% | 8.9% |
| Shumen Province | 45.5% | 31.5% | 17.6% |
| Silistra Province | 38.2% | 43.1% | 14.4% |
| Sliven Province | 55.0% | 11.6% | 28.3% |
| Smolyan Province | 87.6% | 5.0% | 1.9% |
| Sofia City | 92.2% | 0.5% | 3.6% |
| Sofia Province | 77.1% | 0.2% | 18.8% |
| Stara Zagora Province | 68.3% | 7.3% | 19.9% |
| Targovishte Province | 39.6% | 38.0% | 15.5% |
| Varna Province | 79.2% | 8.9% | 7.0% |
| Veliko Tarnovo Province | 79.9% | 11.0% | 4.4% |
| Vidin Province | 74.3% | 0.1% | 20.6% |
| Vratsa Province | 80.3% | 0.4% | 15.6% |
| Yambol Province | 62.4% | 5.8% | 26.7% |
| Source (2011 census):[32] | |||
Bulgarian children constitute the majority of all children in 23 out of 28 provinces. They constitute more than ninety percent of all children in two provinces: Sofia (city) (92%) and Pernik Province (90%).
Turkish children constitute the majority in Kardzhali Province (68% of self-declared) and Razgrad Province (50% of self-declared); they also constitute the largest group of all children in Silistra Province (43%).
Roma children constitute 12% of all children in Bulgaria and more than a quarter in three provinces: Montana (29%), Sliven (28%) and Yambol (27%).
Bulgaria is ageing rapidly, especially in some remote rural areas.
| Age Structure (2011) | |||
|---|---|---|---|
| Under working age (0 – 17) | Working age (18 – 64) | Above working age (65 and over) | |
| 1 172 208 (16.0%) | 4 789 967 (65.1%) | 1 389 059 (18.9%) | |
| Age Structure (2017)[59] | |||
| Under working age (0 – 17) | Working age (18 – 64) | Above working age (65 and over) | |
| 1 065 993 (15.1%) | 4 248 503 (60.3%) | 1 735 538 (24.6%) | |
The ageing of the population leads to an increase of the median age. The median age is 43.6 as of 2017, up from 40.4 years in 2001.[60]
Education
.png.webp)
Over 98% of the population is literate, the males being more literate than the females.
According to the 2011 census, about 112,778 people aged nine or more are illiterate. There are considerable differences in the share of illiterate persons amongst the three main ethnic groups. Amongst the Bulgarian ethnic group the share of illiterate is 0.5%, amongst the Turkish - 4.7% and amongst the Roma ethnic group - 11.8%.[62] About 81 thousand people aged seven or more never visited school.[63]
Unemployment

The median unemployment for the country in 2011 was 10.1%.
The number of unemployed people declined to 207 thousand people (or around 6.2% of the population) in 2017.[64]
Most unemployed people are aged 15 to 24 years old.
The unemployment rate in rural areas (around 10.0%) is nearly two times higher than the unemployment rate in urban areas (approximately 5.1%).
Vidin Province has the highest unemployment rate with almost one fifth of its labour force being unemployed. The provinces of Shumen (15.9%), Silistra (12.5%) and Targovishte (12.4%) have also very high unemployment rates.
Other statistics
Home ownership
According to Eurostat, 82.3% per cent of the population live in privately owned and owner-occupied homes, ranking it as 12th highest in ownership globally.[65] It is down from a recent peak of 87.6% in 2008, and has been steadily falling since.[65]
Internet penetration
The number of Internet users has increased rapidly since 2000—from 430,000 their number grew to 1.55 million in 2004, and 3.4 million (48 per cent penetration rate) in 2010.[66] Bulgaria has the third-fastest average Broadband Internet speed in the world after South Korea and Romania with an average speed of 1,611 kbit/s.[67][68]
Mobile phone adoption
Currently there are three active mobile phone operators—Mtel, Telenor and Vivacom, Mtel is the largest one with 5.2 million users as of 2010,[69] Telenor has 3,9 million as of 2007 and Vivacom over 1 million.
HIV
Bulgaria's HIV rate is among the lowest in the world, being 0.1% or 3,800 infected as of 2009.
Urbanization
Most Bulgarians (72.5 per cent) reside in urban areas. Approximately one-sixth of them live in Sofia, which has a population exceeding 1,200,000 people.
- Urban population: 5,338,261 or 72.5% of total population (Census 2011)[7]
- Rural: 2,026,309 or 27.5%
- Rate of urbanization: -0.3% annual rate of change (2005–10 est.)
Largest cities
See also
- Immigration to Bulgaria
- Immigration to Europe
- List of countries by immigrant population
- Bulgaria
- Ageing of Europe
Notes
- In fertility rates, 2.1 and above is a stable population and has been marked blue, 2 and below leads to an aging population and the result is that the population decreases.
References
- "National statistical institute" (PDF). Nsi.bg. 14 April 2018. Retrieved 18 April 2018.
- "Crude birth rate by statistical regions, districts and place of residence - National statistical institute". www.nsi.bg.
- Demographic situation in Bulgaria in 2017
- "2013 Human Development Report - Human Development Reports". hdr.undp.org. Retrieved 24 August 2017.
- "Interactive Infographic of the World's Best Countries". Newsweek.com. 15 August 2010. Retrieved 24 July 2011.
- Arkadiev, D (24 January 2014). "The population of Bulgaria during the Middle Ages (seventh to fourteenth centuries)". Naselenie. 4 (2): 3–11. PMID 12280532.
- "Census 2011" (PDF). Nsi.bg. Retrieved 24 August 2017.
- "Population projections by sex and age - National statistical institute". Nsi.bg. Retrieved 24 August 2017.
- Max Roser (2014), "Total Fertility Rate around the world over the last centuries", Our World in Data, Gapminder Foundation
- B.R. Mitchell. European historical statistics, 1750–1975.
- Demographic Yearbook 1948 (PDF). Statistical Office of the United Nations. Retrieved 20 February 2015.
- "National Statistical Institute of Bulgaria". Archived from the original on 31 July 2010. Retrieved 10 October 2014.
- "POPULATION AND DEMOGRAPHIC PROCESSES IN 2015" (PDF). Nsi.bg. Retrieved 25 August 2017.
- "POPULATION AND DEMOGRAPHIC PROCESSES IN 2016" (PDF). Nsi.bg. Retrieved 25 August 2017.
- "Population and Demographic Processes in 2017". Nsi.bg. Retrieved 25 August 2017.
- "POPULATION AND DEMOGRAPHIC PROCESSES IN 2018" (PDF).
- "POPULATION AND DEMOGRAPHIC PROCESSES IN 2019" (PDF).
- "Live births by districts, municipalities and sex - National statistical institute". www.nsi.bg.
- "Report" (PDF). geoproblems.eu.
- Judah, Timothy (9 July 2020). "Bulgaria Writes New Chapter In Long Story Of Demographic Decline". The Economist. Balkan Insight. Retrieved 28 October 2020.
- "Total fertility rate by statistical regions, districts and place of residence - National statistical institute". www.nsi.bg.
- "Live births". www.nsi.bg.
- Live births by districts, municipalities and mother’s age
- National statistical institute December 2017
- "World Population Prospects - Population Division - United Nations". esa.un.org. Archived from the original on 19 September 2016. Retrieved 26 August 2018.
- - National Statistical Institute
- "Official forecast for the population of Bulgaria". National Statistical Institute of Bulgaria. Archived from the original on 28 May 2013.
- "Bulgaria Population 2018", World Population Review
- "World Factbook EUROPE : BULGARIA", The World Factbook, 12 July 2018
 This article incorporates text from this source, which is in the public domain.
 - L. Ivanov. Demographic priorities and goals of the Government Program 2017–2021. Presentation at the round table Demographic Policies and Labour Mobility organized by the Ministry of Labour and Social Policy, and the State Agency for the Bulgarians Abroad. Sofia, 19 September 2017. 4 pp.
- L. Ivanov. Measures to solve demographic problems. Business Club Magazine. Issue 11, 2017. pp. 18-20. ISSN 2367-623X (in Bulgarian and English)
- "Население по местоживеене, пол и етническа група" [Population by place of residence, sex and ethnic group]. Censusresults.nsi.bg (in Bulgarian). 1900–2011. Archived from the original on 30 May 2017. Retrieved 27 January 2012.
- Georgeoff, Peter John (with David Crowe), "National Minorities in Bulgaria, 1919– 1980" in Horak, Stephen, ed., Eastern European National Minorities 1919/1980: A Handbook, (Littleton, Co: Libraries Limited, Inc.).
- Ilieva, Nadezhda (2012). NUMBER OF ROMA ETHNIC GROUP IN BULGARIA FROM THE LIBERATION TO THE BEGINNING OF THE 21ST CENTURY (BASED ON REGULAR CENSUSES) (Part 1) (PDF). Bulgarian Academy of Sciences. pp. 74–75.
- v, Joseph. The Communist Party of Bulgaria; Origins and Development, 1883–1936. Columbia University Press. p. 126.
- A. Cook, Bernard (2001). Europe Since 1945: An Encyclopedia. Taylor & Francis. p. 810. ISBN 978-0-8153-4058-4.
- "6.1 European population committee (The demographic characteristics of the main ethnic/national minorities in Bulgaria)". Council of Europe.
- "НАСЕЛЕНИЕ КЪМ 1 March 2001 Г. ПО ОБЛАСТИ И ЕТНИЧЕСКА ГРУПА (Inhabitants as at 1 March 2001 by province and ethnic group)". Nsi.bg. 1 March 2001.
- Population by province, municipality, settlement and ethnic identification, by 1 February 2011; Bulgarian National Statistical Institute Archived 21 May 2013 at the Wayback Machine (in Bulgarian)
- "Population by mother tongue". Nsi.bg. Archived from the original on 27 June 2013. Retrieved 24 August 2017.
- "ILib - Lister". Archived from the original on 4 February 2017. Retrieved 3 February 2017.
- Kalionski, Alexei. Communities, Identities and Migrations in Southeast Europe Collected Articles. Anamnesis. ISBN 978-619-90188-4-2, p. 48
- 6.1 European population committee (CDPO) The demographic characteristics of national minorities in certain European States The demographic characteristics of the main ethnic/national minorities in Bulgaria CM(99)138 Addendum 2 (restricted) 27 October 1999
- "ILib - Lister". Archived from the original on 4 February 2017. Retrieved 3 February 2017.
- Cultrual Policies and Trends in Europe. "Population by ethnic group and mother tongue, 2001". Archived from the original on 23 September 2015. Retrieved 2 December 2008.
- "Archived copy". Archived from the original on 7 September 2010. Retrieved 6 October 2010.CS1 maint: archived copy as title (link)
- "Census 2011 final results > Population > Population by place of residence, age and religion". Archived from the original on 28 January 2012. Retrieved 17 October 2017.CS1 maint: bot: original URL status unknown (link)
- "Население по местоживеене, възраст и вероизповедание". Censusresults.nsi.bg (in Bulgarian). 2011. Retrieved 11 April 2016.
- "Структура на населението по вероизповедание (Structure of the population by confession)". Nccedi.government.bg. Archived from the original on 25 December 2009. Retrieved 24 August 2017.
- "Етнически малцинствени общности (Ethnic minority communities)". Nccedi.government.bg. Archived from the original on 24 August 2017. Retrieved 24 August 2017.
- "iLib - Lister". 6 February 2017. Archived from the original on 6 February 2017. Retrieved 15 October 2017.
- "Communities, Identities and Migrations in Southeast Europe - PDF". docplayer.net. Retrieved 24 August 2017.
- "59 968 македонци доказали български произход - Благоевград". DarikNews.bg. Retrieved 24 August 2017.
- "Президент на Република България". President.bg. Retrieved 24 August 2017.
- Perspectives migrations internationales 2016 et Eurostat.
- "Archived copy". Archived from the original on 2 June 2012. Retrieved 13 June 2012.CS1 maint: archived copy as title (link)
- "Проф. Илона Томова: Има области с 40% деца роми, държавата им е длъжник | Заман България". Archived from the original on 4 February 2017. Retrieved 4 February 2017.
- "Population by districts, municipalities, settlements and age as of 01.02.2011". Nsi.bg. Retrieved 24 August 2017.
- Time series: Pop_6.1.10_Pop_DR_EN.xls. "Population by working age status, place of residence, sex, and by districts and municipalities | National statistical institute". Nsi.bg. Retrieved 5 May 2018.
- "POPULATION AND DEMOGRAPHIC PROCESSES IN 2017" (PDF). Retrieved 5 May 2018.
- "С. Игнатов: За 48% от първокласниците майчиният език не е български".
- 2011 census results
- "Risk report" (PDF). sociobrains.com.
- Unemployed and unemployment rates - national level; statistical regions; districts
- "Eurostat - Data Explorer - Distribution of population by tenure status, type of household and income group". Eurostat. Retrieved 23 October 2016.
- "Bulgaria Internet Usage Stats and Market Report". Internetworldstats.com. 30 June 2010. Retrieved 20 December 2011.
- "Bulgaria ranks third in global Internet speed survey". The Sofia Echo. 21 September 2011. Retrieved 8 June 2012.
- "The World in 2011 – Facts and Figures" (PDF). International Telecommunication Union. February 2012. Retrieved 27 April 2012.
- ""М-Тел" блиц с Андреас Майерхофер - списание МЕНИДЖЪР". Manager.bg. 23 April 2012. Archived from the original on 23 April 2012. Retrieved 24 August 2017.
- "Census results" (PDF). 2011.
External links
| Wikimedia Commons has media related to Demographics of Bulgaria. |
- 2005 Report on European Demography, Eurostat
- Annual report of the National Statistics Institute for 2005 regarding population and demographic processes
- Bulgarian Subject Files – Social Issues: Minorities Open Society Archives, Budapest
- Bulgarians – Species on the Brink
.svg.png.webp)
according to 2011 census data | |
|