Demographics of Poland
The demographics of Poland constitute all demographic features of the population of Poland, including population density, ethnicity, education level, health of the populace, economic status, religious affiliations and other aspects of the population.
| Year | Pop. | ±% |
|---|---|---|
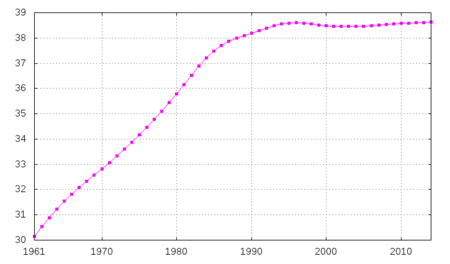
| 1950 | 24,824,018 | — |
| 1960 | 29,614,201 | +19.3% |
| 1970 | 32,639,258 | +10.2% |
| 1980 | 35,539,720 | +8.9% |
| 1990 | 37,960,653 | +6.8% |
| 2000 | 38,556,693 | +1.6% |
| 2010 | 38,321,789 | −0.6% |
| 2020 | 37,846,611 | −1.2% |
| Source: United Nations Population Division[1] | ||
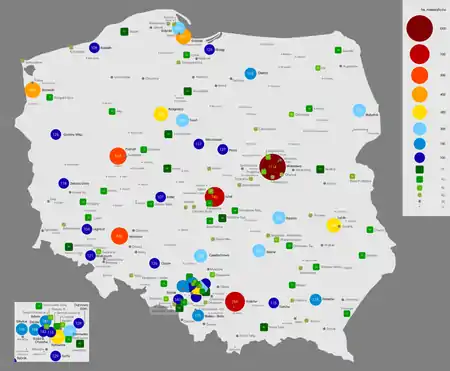
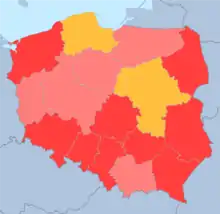
Alternative map
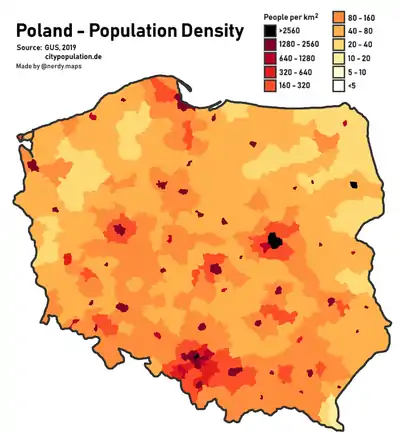
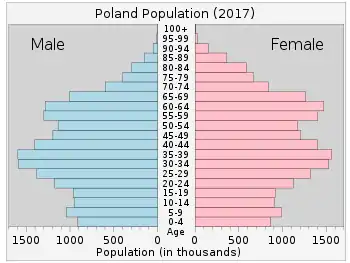
According to the 2011 census by the Polish Central Statistical Office (GUS), at the end of 2011 Poland had a population of 38,538,447,[2] which translates into an average population density of 123 people/km2 (urban 1105 per 1 km2, rural 50 per 1 km2). 61.5% of the Polish population lives in urban areas, a number which is slowly diminishing. Poland is the 37th most populous country in the world (8th in Europe, with 5.4% of the European population). Total population of Poland is almost stagnant (population growth was 0.08%). In 2018, the average life expectancy was 77.9 years; 74.1 for men and 82 for women. Population distribution is uneven. Ethnically, Poland is a very homogeneous country, with 96.7% of population being Polish.
A number of censuses have assessed this data, including a national census in 2002, and a survey by the Helsinki Foundation for Human Rights (HFHR), which confirmed there are numerous autochthonous ethnic groups in Poland. Estimates by INTEREG and Eurominority present a similar demographic picture of Poland but they provide estimates only for the most numerous of these ethnic groups.
Like many developed nations, Poland is ageing. In 1950, the median age was 25.8: half of the Polish population was younger, half older. Today it is 38.2. If current trends continue, it may be 51 by 2050.[3] As the population is ageing, it also started to decline in the 1990s mainly due to low birth rates and continued emigration overseas which impacted the local economy; however this has started to change, with the Polish government encouraging citizens to return to Poland with increased wage incentives. The number of children born in Polish families (TFR of 1.31, down from 2 in 1990) is one of the lowest in Central Europe, but has started to increase in recent years.[4][5]
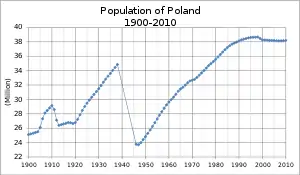
Historical population
For many centuries, until the end of World War II in 1945, the population of Poland included many significant ethnic minorities.
Twentieth century
The population of Poland decreased by about six million due to the losses sustained during the Holocaust and German occupation during World War II (1939-1945), and Poland became one of the most ethnically homogeneous areas in Europe (next to the populations of Slovakia and the Czech Republic) as a result of radically altered borders and population expulsions at the end of and after the war. The post-war population movements were accompanied by waves of forced migrations ordered by the Soviet and Polish communist authorities, including the transfers of sizable Polish populations (1944–1946) from Poland's pre-war eastern territories which were incorporated into the Soviet Union, the expulsion of ethnic Ukrainians to the USSR (1944–1946), Operation Vistula (1947), and the expulsion of Germans (1945–1950) from former German provinces awarded to Poland.
Recent trends
According to GUS, about 38,325,000 people live in Poland, however, the same report states that the number of residents living in the country all the time is approximately 37,200,000; with 1,125,000 people living abroad for 6 to 7 months or more. It means that the permanent population may be correspondingly smaller.[6]
In the 21st century many Poles migrated following Poland's accession to the European Union in 2004 and the opening of the EU's labor market; with approximately 2 million (primarily young) Poles taking up jobs abroad.[7]
Vital statistics
|
1.4 - 1.5 1.3 - 1.4 < 1.3 |
Total fertility rate from 1800 to 1920
The total fertility rate is the number of children born per woman. It is based on fairly good data for the entire period. Sources: Our World In Data and Gapminder Foundation.[11]
| Years | 1800 | 1801 | 1802 | 1803 | 1804 | 1805 | 1806 | 1807 | 1808 | 1809 | 1810[11] |
|---|---|---|---|---|---|---|---|---|---|---|---|
| Total Fertility Rate in Poland | 6.28 | 6.26 | 6.25 | 6.23 | 6.22 | 6.2 | 6.19 | 6.17 | 6.16 | 6.14 | 6.12 |
| Years | 1811 | 1812 | 1813 | 1814 | 1815 | 1816 | 1817 | 1818 | 1819 | 1820[11] |
|---|---|---|---|---|---|---|---|---|---|---|
| Total Fertility Rate in Poland | 6.11 | 6.09 | 6.08 | 6.06 | 6.05 | 6.03 | 6.03 | 6.16 | 6.3 | 6.03 |
| Years | 1821 | 1822 | 1823 | 1824 | 1825 | 1826 | 1827 | 1828 | 1829 | 1830[11] |
|---|---|---|---|---|---|---|---|---|---|---|
| Total Fertility Rate in Poland | 6.3 | 6.03 | 5.76 | 5.49 | 6.83 | 6.16 | 6.3 | 6.22 | 6.14 | 6.06 |
| Years | 1831 | 1832 | 1833 | 1834 | 1835 | 1836 | 1837 | 1838 | 1839 | 1840[11] |
|---|---|---|---|---|---|---|---|---|---|---|
| Total Fertility Rate in Poland | 5.98 | 5.9 | 6.43 | 6.83 | 5.9 | 6.3 | 6.57 | 6.03 | 6.43 | 6.57 |
| Years | 1841 | 1842 | 1843 | 1844 | 1845 | 1846 | 1847 | 1848 | 1849 | 1850[11] |
|---|---|---|---|---|---|---|---|---|---|---|
| Total Fertility Rate in Poland | 6.16 | 6.43 | 6.3 | 6.03 | 5.36 | 5.49 | 5.09 | 4.82 | 5.49 | 5.63 |
| Years | 1851 | 1852 | 1853 | 1854 | 1855 | 1856 | 1857 | 1858 | 1859 | 1860[11] |
|---|---|---|---|---|---|---|---|---|---|---|
| Total Fertility Rate in Poland | 5.63 | 5.49 | 5.63 | 5.36 | 4.82 | 5.36 | 5.76 | 6.3 | 6.57 | 6.57 |
| Years | 1861 | 1862 | 1863 | 1864 | 1865 | 1866 | 1867 | 1868 | 1869 | 1870[11] |
|---|---|---|---|---|---|---|---|---|---|---|
| Total Fertility Rate in Poland | 6.43 | 6.97 | 6.57 | 6.2 | 5.83 | 5.46 | 5.09 | 5.63 | 5.63 | 6.16 |
| Years | 1871 | 1872 | 1873 | 1874 | 1875 | 1876 | 1877 | 1878 | 1879 | 1880[11] |
|---|---|---|---|---|---|---|---|---|---|---|
| Total Fertility Rate in Poland | 5.76 | 5.49 | 5.76 | 5.76 | 5.49 | 5.49 | 5.23 | 5.23 | 5.36 | 5.23 |
| Years | 1881 | 1882 | 1883 | 1884 | 1885 | 1886 | 1887 | 1888 | 1889 | 1890[11] |
|---|---|---|---|---|---|---|---|---|---|---|
| Total Fertility Rate in Poland | 5.09 | 5.23 | 5.23 | 5.09 | 5.36 | 5.36 | 5.36 | 5.49 | 5.76 | 5.63 |
| Years | 1891 | 1892 | 1893 | 1894 | 1895 | 1896 | 1897 | 1898 | 1899 | 1900[11] |
|---|---|---|---|---|---|---|---|---|---|---|
| Total Fertility Rate in Poland | 5.63 | 5.36 | 5.63 | 5.9 | 5.9 | 5.76 | 5.63 | 5.49 | 5.49 | 5.49 |
| Years | 1901 | 1902 | 1903 | 1904 | 1905 | 1906 | 1907 | 1908 | 1909 | 1910[11] |
|---|---|---|---|---|---|---|---|---|---|---|
| Total Fertility Rate in Poland | 5.36 | 5.36 | 5.09 | 5.09 | 4.96 | 5.09 | 5.09 | 4.96 | 4.96 | 4.82 |
| Years | 1911 | 1912 | 1913 | 1914 | 1915 | 1916 | 1917 | 1918 | 1919 | 1920[11] |
|---|---|---|---|---|---|---|---|---|---|---|
| Total Fertility Rate in Poland | 4.69 | 4.56 | 4.69 | 4.82 | 3.89 | 3.62 | 3.22 | 3.22 | 4.42 | 4.69 |
Vital statistics from 1921 to 1938
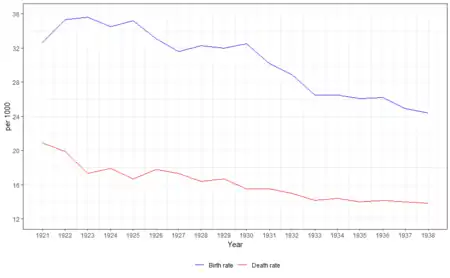
| Year [12] | Average population | Live births | Deaths | Natural change | Crude birth rate (per 1000) | Crude death rate (per 1000) | Natural change (per 1000) | Total fertility rates[fn 1][11] |
|---|---|---|---|---|---|---|---|---|
| 1921 | 27,224,000 | 890,400 | 568,300 | 322,100 | 32.7 | 20.9 | 11.8 | 4.40 |
| 1922 | 27,846,000 | 983,100 | 554,600 | 482,500 | 35.3 | 19.9 | 15.4 | 4.73 |
| 1923 | 28,480,000 | 1,014,700 | 493,800 | 520,900 | 35.6 | 17.3 | 18.3 | 4.82 |
| 1924 | 29,007,000 | 1,000,100 | 519,200 | 480,900 | 34.5 | 17.9 | 16.6 | 4.69 |
| 1925 | 29,475,000 | 1,036,600 | 492,200 | 544,400 | 35.2 | 16.7 | 18.5 | 4.74 |
| 1926 | 29,906,000 | 989,100 | 532,700 | 456,400 | 33.1 | 17.8 | 15.3 | 4.44 |
| 1927 | 30,302,000 | 958,733 | 525,633 | 433,100 | 31.6 | 17.3 | 14.3 | 4.23 |
| 1928 | 30,693,000 | 990,993 | 504,207 | 486,786 | 32.3 | 16.4 | 15.9 | 4.29 |
| 1929 | 31,084,000 | 994,101 | 518,929 | 475,172 | 32.0 | 16.7 | 15.3 | 4.26 |
| 1930 | 31,490,000 | 1,022,811 | 488,417 | 534,394 | 32.5 | 15.5 | 17.0 | 4.33 |
| 1931 | 31,935,000 | 964,573 | 493,703 | 470,870 | 30.2 | 15.5 | 14.7 | 4.05 |
| 1932 | 32,394,000 | 934,663 | 486,548 | 448,115 | 28.9 | 15.0 | 13.8 | 3.87 |
| 1933 | 32,823,000 | 868,675 | 466,210 | 402,465 | 26.5 | 14.2 | 12.3 | 3.55 |
| 1934 | 33,223,000 | 881,615 | 479,684 | 401,931 | 26.5 | 14.4 | 12.1 | 3.56 |
| 1935 | 33,616,000 | 876,667 | 470,998 | 405,669 | 26.1 | 14.0 | 12.1 | 3.50 |
| 1936 | 34,020,000 | 892,320 | 482,633 | 409,687 | 26.2 | 14.2 | 12.0 | 3.51 |
| 1937 | 34,441,000 | 856,064 | 481,594 | 374,470 | 24.9 | 14.0 | 10.9 | 3.34 |
| 1938 | 34,849,000 | 849,873 | 479,602 | 370,271 | 24.4 | 13.8 | 10.6 | 3.26 |
| Years | 1939 | 1940 | 1941 | 1942 | 1943 | 1944 | 1945[11] |
|---|---|---|---|---|---|---|---|
| Total Fertility Rate in Poland | 3.23 | 3.21 | 3.18 | 3.16 | 3.13 | 3.11 | 3.08 |
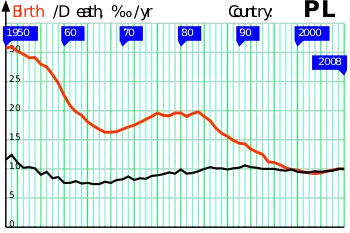
After World War II
[13] [14] [15] [16] [17] [18][11][19][20]
| Average population | Live births | Deaths | Natural change | Crude birth rate (per 1000) | Crude death rate (per 1000) | Natural change (per 1000) | Total fertility rates | Life expectancy (males) | Life expectancy (females) | Share of births outside marriage | Immigration | Emigration | Net external migration | |
|---|---|---|---|---|---|---|---|---|---|---|---|---|---|---|
| 1946 | 23,777,000 | 570,000 | 335,000 | 235,000 | 24.0 | 14.1 | 9.9 | 3.06 | ||||||
| 1947 | 23,970,000 | 630,000 | 271,000 | 359,000 | 26.3 | 11.3 | 15.0 | 3.51 | ||||||
| 1948 | 23,980,000 | 704,772 | 268,000 | 436,772 | 29.4 | 11.2 | 18.2 | 3.93 | ||||||
| 1949 | 24,410,000 | 725,061 | 284,000 | 441,061 | 29.7 | 11.6 | 18.1 | 3.94 | ||||||
| 1950 | 24,824,000 | 763,108 | 288,685 | 474,423 | 30.7 | 11.6 | 19.1 | 3.71 | 56.07 | 61.68 | ||||
| 1951 | 25,271,000 | 783,597 | 312,314 | 471,283 | 31.0 | 12.4 | 18.6 | 3.75 | 55.11 | 60.67 | ||||
| 1952 | 25,753,000 | 778,962 | 286,730 | 492,232 | 30.2 | 11.1 | 19.1 | 3.67 | 57.59 | 63.07 | ||||
| 1953 | 26,255,000 | 779,000 | 266,527 | 512,473 | 29.7 | 10.2 | 19.5 | 3.61 | 59.58 | 65.05 | ||||
| 1954 | 26,761,000 | 778,054 | 276,406 | 501,648 | 29.1 | 10.3 | 18.7 | 3.58 | 59.80 | 65.06 | ||||
| 1955 | 27,281,000 | 793,847 | 261,576 | 532,271 | 29.1 | 9.6 | 19.5 | 3.61 | 60.82 | 66.19 | ||||
| 1956 | 27,815,000 | 779,835 | 249,606 | 530,229 | 28.0 | 9.0 | 19.1 | 3.61 | 62.29 | 67.52 | ||||
| 1957 | 28,310,000 | 782,319 | 269,137 | 513,182 | 27.6 | 9.5 | 18.1 | 3.49 | 61.20 | 66.70 | ||||
| 1958 | 28,770,000 | 752,600 | 241,435 | 511,165 | 26.2 | 8.4 | 17.8 | 3.36 | 63.08 | 68.57 | ||||
| 1959 | 29,240,000 | 722,928 | 252,430 | 470,498 | 24.7 | 8.6 | 16.1 | 3.22 | 62.71 | 68.30 | ||||
| 1960 | 29,561,000 | 669,485 | 224,167 | 445,318 | 22.6 | 7.6 | 15.1 | 2.98 | 64.94 | 70.60 | ||||
| 1961 | 29,965,000 | 627,624 | 227,759 | 399,865 | 20.9 | 7.6 | 13.3 | 2.83 | 64.91 | 70.78 | ||||
| 1962 | 30,324,000 | 599,505 | 239,199 | 360,306 | 19.8 | 7.9 | 11.9 | 2.72 | 64.53 | 70.49 | ||||
| 1963 | 30,691,000 | 588,235 | 230,072 | 358,163 | 19.2 | 7.5 | 11.7 | 2.70 | 65.41 | 71.52 | ||||
| 1964 | 31,161,000 | 562,855 | 235,919 | 326,936 | 18.1 | 7.6 | 10.5 | 2.57 | 65.78 | 71.60 | ||||
| 1965 | 31,496,000 | 546,362 | 232,421 | 313,941 | 17.3 | 7.4 | 10.0 | 2.52 | 66.58 | 72.40 | ||||
| 1966 | 31,698,000 | 530,307 | 232,945 | 297,362 | 16.7 | 7.3 | 9.4 | 2.33 | 66.87 | 72.85 | ||||
| 1967 | 31,944,000 | 520,383 | 247,705 | 272,678 | 16.3 | 7.8 | 8.5 | 2.30 | 66.44 | 72.61 | ||||
| 1968 | 32,426,000 | 524,174 | 244,115 | 280,059 | 16.2 | 7.5 | 8.6 | 2.24 | 67.04 | 73.55 | ||||
| 1969 | 32,555,000 | 531,135 | 262,823 | 268,312 | 16.3 | 8.1 | 8.2 | 2.20 | 66.50 | 73.09 | ||||
| 1970 | 32,526,000 | 545,973 | 266,799 | 279,174 | 16.8 | 8.2 | 8.6 | 2.22 | 66.62 | 73.33 | 5.0 | |||
| 1971 | 32,805,000 | 562,341 | 283,702 | 278,639 | 17.1 | 8.6 | 8.5 | 2.25 | 66.13 | 73.25 | ||||
| 1972 | 33,068,000 | 575,725 | 265,250 | 310,475 | 17.4 | 8.0 | 9.4 | 2.24 | 67.32 | 74.17 | ||||
| 1973 | 33,363,000 | 598,559 | 277,188 | 321,371 | 17.9 | 8.3 | 9.6 | 2.24 | 67.15 | 74.30 | ||||
| 1974 | 33,691,000 | 621,080 | 277,085 | 343,995 | 18.4 | 8.2 | 10.2 | 2.26 | 67.80 | 74.64 | ||||
| 1975 | 34,022,000 | 643,772 | 296,896 | 346,876 | 18.9 | 8.7 | 10.2 | 2.27 | 67.02 | 74.26 | 4.7 | |||
| 1976 | 34,362,000 | 670,140 | 304,057 | 366,083 | 19.5 | 8.8 | 10.7 | 2.31 | 66.92 | 74.55 | ||||
| 1977 | 34,698,000 | 662,582 | 312,956 | 349,626 | 19.1 | 9.0 | 10.1 | 2.33 | 66.49 | 74.50 | ||||
| 1978 | 35,010,000 | 666,336 | 325,104 | 341,232 | 19.0 | 9.3 | 9.7 | 2.30 | 66.36 | 74.53 | ||||
| 1979 | 35,257,000 | 688,293 | 323,048 | 365,245 | 19.5 | 9.2 | 10.4 | 2.39 | 66.79 | 74.91 | 4.8 | |||
| 1980 | 35,578,000 | 692,798 | 350,203 | 342,595 | 19.5 | 9.8 | 9.6 | 2.42 | 66.01 | 74.44 | ||||
| 1981 | 35,902,000 | 678,696 | 328,923 | 349,773 | 18.9 | 9.2 | 9.7 | 2.34 | 67.10 | 75.24 | ||||
| 1982 | 36,227,000 | 702,351 | 334,869 | 367,482 | 19.4 | 9.2 | 10.1 | 2.38 | 67.24 | 75.20 | ||||
| 1983 | 36,571,000 | 720,756 | 349,388 | 371,368 | 19.7 | 9.6 | 10.2 | 2.41 | 67.04 | 75.16 | ||||
| 1984 | 36,914,000 | 699,041 | 364,883 | 334,158 | 18.9 | 9.9 | 9.1 | 2.36 | 66.84 | 74.97 | ||||
| 1985 | 37,203,000 | 677,576 | 381,458 | 296,118 | 18.2 | 10.3 | 8.0 | 2.33 | 66.50 | 74.81 | 5.0 | |||
| 1986 | 37,456,000 | 634,748 | 376,316 | 258,432 | 16.9 | 10.0 | 6.9 | 2.21 | 66.76 | 75.13 | ||||
| 1987 | 37,664,000 | 605,492 | 378,365 | 227,127 | 16.1 | 10.0 | 6.0 | 2.15 | 66.81 | 75.20 | ||||
| 1988 | 37,862,000 | 587,741 | 370,821 | 216,920 | 15.5 | 9.8 | 5.7 | 2.12 | 67.15 | 75.67 | ||||
| 1989 | 37,963,000 | 562,530 | 381,173 | 181,357 | 14.8 | 10.0 | 4.8 | 2.08 | 66.76 | 75.45 | ||||
| 1990 | 38,119,000 | 545,817 | 390,343 | 155,474 | 14.3 | 10.2 | 4.1 | 2.04 | 66.23 | 75.24 | 6.2 | |||
| 1991 | 38,245,000 | 547,719 | 405,716 | 142,003 | 14.3 | 10.6 | 3.7 | 2.05 | 65.88 | 75.06 | 6.6 | |||
| 1992 | 38,365,000 | 515,214 | 394,729 | 120,485 | 13.4 | 10.3 | 3.1 | 1.91 | 66.47 | 75.48 | 7.2 | |||
| 1993 | 38,459,000 | 494,310 | 392,259 | 102,051 | 12.9 | 10.2 | 2.7 | 1.86 | 67.17 | 75.81 | 8.2 | |||
| 1994 | 38,544,000 | 481,285 | 386,398 | 94,887 | 12.5 | 10.0 | 2.5 | 1.78 | 67.50 | 76.08 | 9.0 | |||
| 1995 | 38,588,000 | 443,109 | 386,084 | 57,025 | 11.5 | 10.0 | 1.5 | 1.65 | 67.62 | 76.39 | 9.5 | |||
| 1996 | 38,618,000 | 428,203 | 385,496 | 42,707 | 11.1 | 10.0 | 1.1 | 1.58 | 68.12 | 76.57 | 10.2 | |||
| 1997 | 38,650,000 | 412,635 | 380,201 | 32,434 | 10.7 | 9.8 | 0.8 | 1.52 | 68.45 | 76.99 | 11.0 | |||
| 1998 | 38,666,000 | 395,619 | 375,354 | 20,265 | 10.2 | 9.7 | 0.5 | 1.44 | 68.87 | 77.34 | 11.6 | |||
| 1999 | 38,654,000 | 382,002 | 381,415 | 587 | 9.9 | 9.9 | 0.0 | 1.37 | 68.83 | 77.49 | 11.7 | |||
| 2000 | 38,649,000 | 378,348 | 368,028 | 10,320 | 9.8 | 9.5 | 0.3 | 1.35 | 69.74 | 78.00 | 12.1 | |||
| 2001 | 38,248,000 | 368,205 | 363,220 | 4,985 | 9.6 | 9.5 | 0.1 | 1.32 | 70.21 | 78.38 | 13.1 | |||
| 2002 | 38,218,531 | 353,765 | 359,486 | -5,721 | 9.3 | 9.4 | -0.1 | 1.25 | 70.40 | 78.80 | 14.4 | 6,587 | 24,532 | -17,945 |
| 2003 | 38,190,608 | 351,072 | 365,230 | -14,158 | 9.2 | 9.6 | -0.4 | 1.22 | 70.50 | 78.90 | 15.8 | 7,048 | 20,813 | -13,765 |
| 2004 | 38,173,835 | 356,131 | 363,522 | -7,391 | 9.3 | 9.5 | -0.2 | 1.23 | 70.70 | 79.20 | 17.1 | 9,495 | 18,877 | -9,382 |
| 2005 | 38,157,055 | 364,383 | 368,285 | -3,902 | 9.5 | 9.6 | -0.1 | 1.24 | 70.80 | 79.40 | 18.5 | 9,364 | 22,242 | -12,878 |
| 2006 | 38,125,479 | 374,244 | 369,686 | 4,558 | 9.8 | 9.7 | 0.1 | 1.27 | 70.90 | 79.60 | 18.9 | 10,802 | 46,936 | -36,134 |
| 2007 | 38,115,641 | 387,873 | 377,226 | 10,647 | 10.2 | 9.9 | 0.3 | 1.31 | 71.00 | 79.70 | 19.5 | 14,995 | 35,480 | -20,485 |
| 2008 | 38,135,876 | 414,499 | 379,399 | 35,100 | 10.9 | 10.0 | 0.9 | 1.39 | 71.30 | 80.00 | 19.9 | 15,275 | 30,140 | -14,865 |
| 2009 | 38,167,329 | 417,589 | 384,940 | 32,649 | 10.9 | 10.1 | 0.9 | 1.40 | 71.50 | 80.10 | 20.2 | 17,424 | 18,620 | -1,196 |
| 2010 | 38,529,866 | 413,300 | 378,478 | 34,822 | 10.7 | 9.8 | 0.9 | 1.38 | 72.10 | 80.60 | 20.6 | 15,246 | 17,360 | -2,114 |
| 2011 | 38,538,447 | 388,416 | 375,501 | 12,915 | 10.1 | 9.7 | 0.3 | 1.30 | 72.40 | 80.90 | 21.2 | 15,524 | 19,858 | -4,334 |
| 2012 | 38,533,299 | 387,858 | 384,788 | 3,070 | 10.1 | 10.0 | 0.1 | 1.30 | 72.70 | 81.00 | 22.3 | 14,583 | 21,200 | -6,617 |
| 2013 | 38,495,659 | 369,576 | 387,312 | -17,736 | 9.6 | 10.1 | -0.5 | 1.26 | 73.10 | 81.10 | 23.4 | 12,199 | 32,103 | -19,904 |
| 2014 | 38,478,602 | 375,160 | 376,467 | -1,307 | 9.7 | 9.8 | -0.1 | 1.29 | 73.80 | 81.60 | 24.2 | 12,330 | 28,080 | -15,750 |
| 2015 | 38,437,239 | 369,308 | 394,921 | -25,613 | 9.6 | 10.3 | -0.7 | 1.29 | 73.60 | 81.60 | 24.6 | 12,330 | 28,080 | -15,750 |
| 2016 | 38,432,992 | 382,257 | 388,009 | -5,752 | 9.9 | 10.1 | -0.2 | 1.36 | 73.90 | 81.90 | 25.0 | 13,475 | 11,970 | 1,505 |
| 2017 | 38,433,558 | 401,982 | 402,852 | -870 | 10.5 | 10.5 | -0.0 | 1.45 | 74.00 | 81.80 | 24.1 | 13,324 | 11,888 | 1,436 |
| 2018 | 38,411,148 | 388,178 | 414,200 | -26,022 | 10.1 | 10.8 | -0.7 | 1.44 | 73.80 | 81.70 | 26.4 | 15,461 | 11,849 | 3,612 |
| 2019 | 38,382,576 | 374,954 | 409,709 | -34,755 | 9.8 | 10.7 | -0.9 | 1.42 | 74.1 | 81.8 | 25.4 | 16,909 | 10,726 | 6,183 |
| 2020 | 38,268,000 | 355,000 | 477,000 | -122,000 | 9.3 | 12.5 | -3.2 | 1.38 | 7,000 |
Current vital statistics
Number of births from January–October 2019 = ![]() 318,700 (10.0‰)
318,700 (10.0‰)
Number of births from January–October 2020 = ![]() 302,800 (9.5‰)
302,800 (9.5‰)
Number of deaths from January–October 2019 = ![]() 341,300 (10.7‰)
341,300 (10.7‰)
Number of deaths from January–October 2020 = ![]() 356,700 (11.2‰)
356,700 (11.2‰)
Natural increase from January–October 2019 = ![]() -22,600 (-0.7‰)
-22,600 (-0.7‰)
Natural increase from January–October 2020 = ![]() -53,900 (-1.7‰)
-53,900 (-1.7‰)
Life expectancy
| Period | Life expectancy in Years |
Period | Life expectancy in Years |
|---|---|---|---|
| 1950–1955 | 61.4 | 1985–1990 | 70.7 |
| 1955–1960 | 65.9 | 1990–1995 | 71.2 |
| 1960–1965 | 68.3 | 1995–2000 | 72.7 |
| 1965–1970 | 69.8 | 2000–2005 | 74.6 |
| 1970–1975 | 70.3 | 2005–2010 | 75.6 |
| 1975–1980 | 70.4 | 2010–2015 | 77.0 |
| 1980–1985 | 70.7 |
Source: UN World Population Prospects[22]
Structure of the population
| Age group | Male | Female | Total | % |
|---|---|---|---|---|
| Total | 18 651 441 | 19 882 348 | 38 533 789 | 100 |
| 0-4 | 1 058 874 | 1 005 069 | 2 063 943 | 5,36 |
| 5-9 | 945 643 | 897 723 | 1 843 366 | 4,78 |
| 10-14 | 974 509 | 925 506 | 1 900 015 | 4,93 |
| 15-19 | 1 158 367 | 1 108 267 | 2 266 634 | 5,88 |
| 20-24 | 1 394 761 | 1 341 393 | 2 736 154 | 7,10 |
| 25-29 | 1 623 072 | 1 575 546 | 3 198 618 | 8,30 |
| 30-34 | 1 602 736 | 1 558 622 | 3 161 358 | 8,20 |
| 35-39 | 1 470 751 | 1 432 822 | 2 903 573 | 7,54 |
| 40-44 | 1 231 083 | 1 209 751 | 2 440 834 | 6,33 |
| 45-49 | 1 196 548 | 1 192 952 | 2 389 500 | 6,20 |
| 50-54 | 1 369 258 | 1 414 996 | 2 784 254 | 7,23 |
| 55-59 | 1 404 141 | 1 522 140 | 2 926 281 | 7,59 |
| 60-64 | 1 163 935 | 1 350 684 | 2 514 619 | 6,53 |
| 65-69 | 675 573 | 861 584 | 1 537 157 | 3,99 |
| 70-74 | 529 739 | 776 722 | 1 306 461 | 3,39 |
| 75-79 | 424 407 | 720 249 | 1 144 656 | 2,97 |
| 80-84 | 278 428 | 566 126 | 844 554 | 2,19 |
| 85-89 | 115 213 | 311 388 | 426 601 | 1,11 |
| 90-94 | 28 565 | 91 223 | 119 788 | 0,31 |
| 95-99 | 4 614 | 18 265 | 22 879 | 0,06 |
| 100+ | 224 | 1 320 | 1 544 | <0,01 |
| Age group | Male | Female | Total | Percent |
|---|---|---|---|---|
| 0-14 | 2 979 026 | 2 828 298 | 5 807 324 | 15,07 |
| 15-64 | 13 615 652 | 13 707 173 | 27 322 825 | 70,91 |
| 65+ | 2 056 763 | 3 346 877 | 5 403 640 | 14,02 |
| Age Group | Male | Female | Total | % |
|---|---|---|---|---|
| Total | 18 607 417 | 19 847 159 | 38 454 576 | 100 |
| 0-4 | 982 639 | 928 662 | 1 911 301 | 4.97 |
| 5-9 | 1 047 830 | 996 205 | 2 044 035 | 5.32 |
| 10-14 | 924 671 | 877 780 | 1 802 451 | 4.69 |
| 15-19 | 1 028 884 | 979 585 | 2 008 469 | 5.22 |
| 20-24 | 1 257 703 | 1 209 498 | 2 467 201 | 6.42 |
| 25-29 | 1 464 438 | 1 417 040 | 2 881 478 | 7.49 |
| 30-34 | 1 647 147 | 1 602 930 | 3 250 077 | 8.45 |
| 35-39 | 1 561 396 | 1 522 202 | 3 083 598 | 8.02 |
| 40-44 | 1 354 899 | 1 329 476 | 2 684 375 | 6.98 |
| 45-49 | 1 166 358 | 1 160 878 | 2 327 236 | 6.05 |
| 50-54 | 1 211 294 | 1 238 398 | 2 449 692 | 6.37 |
| 55-59 | 1 386 303 | 1 489 816 | 2 876 119 | 7.48 |
| 60-64 | 1 256 035 | 1 443 985 | 2 700 020 | 7.0 |
| 65-69 | 917 893 | 1 147 725 | 2 065 618 | 5.37 |
| 70-74 | 501 311 | 716 224 | 1 217 535 | 3.17 |
| 75-79 | 426 059 | 715 629 | 1 141 688 | 2.97 |
| 80-84 | 287 908 | 573 415 | 861 323 | 2.24 |
| 85+ | 184 649 | 497 711 | 682 360 | 1.77 |
| Age group | Male | Female | Total | Percent |
|---|---|---|---|---|
| 0-14 | 2 955 140 | 2 802 647 | 5 757 787 | 14.97 |
| 15-64 | 13 334 457 | 13 393 808 | 26 728 265 | 69.51 |
| 65+ | 2 317 820 | 3 650 704 | 5 968 524 | 15.52 |
Demographic statistics
Demographic statistics according to the World Population Review in 2019.[25]
- One birth every 2 minutes
- One death every 1 minutes
- Net loss of one person every 7 minutes
- One net migrant every 53 minutes
Demographic statistics according to the CIA World Factbook, unless otherwise indicated.[20]
- Population
- 38,420,687 (July 2018 est.)
- 38,476,269 (July 2017 est.)
- Age structure
- 0-14 years: 14.8% (male 2,924,077 /female 2,762,634)
- 15-24 years: 10.34% (male 2,040,043 /female 1,932,009)
- 25-54 years: 43.44% (male 8,431,045 /female 8,260,124)
- 55-64 years: 13.95% (male 2,538,566 /female 2,819,544)
- 65 years and over: 17.47% (male 2,663,364 /female 4,049,281) (2018 est.)
- 0-14 years: 14.76% (male 2,919,353/female 2,757,923)
- 15-24 years: 10.7% (male 2,113,358/female 2,003,033)
- 25-54 years: 43.48% (male 8,447,418/female 8,283,757)
- 55-64 years: 14.21% (male 2,586,097/female 2,880,031)
- 65 years and over: 16.86% (male 2,560,847/female 3,924,452) (2017 est.)
- 0–14 years: 14.8% (male 2,931,732/female 2,769,021)
- 15–64 years: 71.7% (male 13,725,939/female 13,863,103)
- 65 years and over: 13.5% (male 1,971,763/female 3,202,131) (2010 est.)
- Median age
- total: 41.1 years. Country comparison to the world: 44th
- male: 39.4 years
- female: 42.8 years (2018 est.)
- total: 40.7 years. Country comparison to the world: 47th
- male: 39 years
- female: 42.4 years (2017 est.)
- total: 38.5 years
- male: 36.8 years
- female: 40.3 years (2011 est.)
- Birth rate
- 9.3 births/1,000 population (2018 est.) Country comparison to the world: 202nd
- 9.5 births/1,000 population (2017 est.)
- Death rate
- 10.5 deaths/1,000 population (2018 est.) Country comparison to the world: 29th
- 10.4 deaths/1,000 population (2017 est.)
- Total fertility rate
- 1.36 children born/woman (2018 est.) Country comparison to the world: 214th
- Population growth rate
- -0.16% (2018 est.) Country comparison to the world: 206th
- -0.13% (2017 est.)
- Net migration rate
- -0.4 migrant(s)/1,000 population (2017 est.) Country comparison to the world: 124th
- Mother's mean age at first birth
- 27.4 years (2014 est.)
- Infant mortality rate
- total: 4.4 deaths/1,000 live births. Country comparison to the world: 182nd
- male: 4.8 deaths/1,000 live births
- female: 4 deaths/1,000 live births (2017 est.)
- total: 6.42 deaths/1,000 live births
- male: 7.12 deaths/1,000 live births
- female: 5.67 deaths/1,000 live births (2012 est.)
- Dependency ratios
- total dependency ratio: 43.9 (2015 est.)
- youth dependency ratio: 21.4 (2015 est.)
- elderly dependency ratio: 22.5 (2015 est.)
- potential support ratio: 4.5 (2015 est.)
- Life expectancy at birth
- total population: 77.9 years
- male: 74.1 years
- female: 82 years (2018 est.)
- total population: 75.85 years
- male: 71.88 years
- female: 80.06 years (2010 est.)
- total population: 76.25 years
- male: 72.31 years
- female: 80.43 years (2012 est.)
- Urbanization
- urban population: 60.1% of total population (2018)
- rate of urbanization: -0.25% annual rate of change (2015-20 est.)
- Literacy
definition: age 15 and over can read and write (2015 est.)
- total population: 99.8%
- male: 99.9%
- female: 99.7% (2015 est.)
- School life expectancy (primary to tertiary education)
- total: 16 years
- male: 16 years
- female: 17 years (2013)
- Unemployment, youth ages 15–24
- total: 17.7%. Country comparison to the world: 74th
- male: 17.4%
- female: 18% (2016 est.)
- total: 20.8%
- male: 20.7%
- female: 20.9% (2015 est.)
- Sex ratio
- at birth: 1.06 male(s)/female
- under 15 years: 1.06 male(s)/female
- 15-64 years: 0.99 male(s)/female
- 65 years and over: 0.62 male(s)/female
- total population: 0.94 male(s)/female (2012 est.)
- Population distribution
Population concentrated in the southern area around Krakow and the central area around Warsaw and Lodz, with an extension to the northern coastal city of Gdansk
- Ethnic groups
Polish 96.9%, Silesian 1.1%, German 0.2%, Ukrainian 0.1%, other and unspecified 1.7% note: represents ethnicity declared first (2011 est.)
- Languages
Polish (official) 98.2%, Silesian 1.4%, other 1.1%, unspecified 1.3% note: data represents the language spoken at home; shares sum to more than 100% because some respondents gave more than one answer on the census; Poland ratified the European Charter for Regional or Minority Languages in 2009 recognizing Kashub as a regional language, Czech, Hebrew, Yiddish, Belarusian, Lithuanian, German, Armenian, Russian, Slovak, and Ukrainian as national minority languages, and Karaim, Lemko, Romani (Polska Roma and Bergitka Roma), and Tatar as ethnic minority languages (2011 est.)
- Religions
Catholic 87.2% (includes Roman Catholic 86.9% and Greek Catholic, Armenian Catholic, and Byzantine-Slavic Catholic .3%), Orthodox 1.3% (almost all are Polish Autocephalous Orthodox), Protestant 0.4% (mainly Augsburg Evangelical and Pentecostal), other 0.4% (includes Jehovah's Witness, Buddhist, Hare Krishna, Gaudiya Vaishnavism, Muslim, Jewish, Mormon), unspecified 10.8% (2012 est.)
Nationalities
97.10% of the people of Poland claim sole or partial Polish nationality, and 98.19% declare that they speak Polish at home (2011). Among minority groups, the largest numbers of respondents claimed Silesian nationality, followed by Kashubian, German, Ukrainian and Belarusian.[26] The statistics on Ukrainians do not include recently arrived migrant workers, which a report by the National Bank of Poland estimated at around 1 million in 2015.[27]
Largest metropolitan and urban areas
| Area | ESPON [28] | Eurostat LUZ [29] | Ministry of Regional Development[30] | United Nations [31] | Demographia.com[32] | Citypopulation.de[33] | Scientific study by T. Markowski[34] | Scientific study by Swianiewicz, Klimska [35] |
|---|---|---|---|---|---|---|---|---|
| Katowice (Katowice urban area) | 3,029,000[36](5,294,000) | 2,710,397 | 3,239,200 | 3,069,000 | 2,500,000 | 2,775,000 | 2,746,000 | 2,733,000 |
| Warsaw | 2,785,000 | 2,660,406 | 2,680,600 | 2,194,000 | 2,030,000 | 2,375,000 | 2,631,900 | 2,504,000 |
| Kraków | 1,236,000 | 1,264,322 | 1,227,200 | 818,000 | 750,000 | Not listed | 1,257,500 | 1,367,000 |
| Łódź | 1,165,000 | 1,163,516 | 1,061,600 | 974,000 | 950,000 | 1,060,000 | 1,178,000 | 1,129,000 |
| Gdańsk | 993,000 | 1,105,203 | 1,220,800 | 854,000 | 775,000 | No data | 1,098,400 | 1,210,000 |
| Poznań | 919,000 | 1,018,511 | 1,227,200 | No data | 600,000 | No data | 1,011,200 | 846,000 |
| Wrocław | 861,000 | 1,031,439 | 1,136,900 | No data | 700,000 | No data | 1,029,800 | 956,000 |
| Szczecin | 721,000 | 878,314 | 724,700 | No data | 500,000 | No data | No data | 755,806 |
Demographics by town
| City | Voivodeship | Inhabitants May 20, 2002 |
Inhabitants December 31, 2006 |
Inhabitants December 31, 2010 |
Inhabitants December 31, 2019 | |
|---|---|---|---|---|---|---|
| 1 | Warsaw | Masovian | 1,671,670 | 1,702,139 | 1,720,398 | 1,790,658 |
| 2 | Kraków | Lesser Poland | 758,544 | 756,267 | 756,183 | 779,115 |
| 3 | Łódź | Łódź | 789,318 | 760,251 | 737,098 | 679,941 |
| 4 | Wrocław | Lower Silesia | 640,367 | 634,630 | 632,996 | 642,869 |
| 5 | Poznań | Greater Poland | 578,886 | 564,951 | 551,627 | 534,813 |
| 6 | Gdańsk | Pomeranian | 461,334 | 456,658 | 456,967 | 470,907 |
| 7 | Szczecin | Western Pomeranian | 415,399 | 409,068 | 405,606 | 401,907 |
| 8 | Bydgoszcz | Kuyavia-Pomeranian | 373,804 | 363,468 | 356,177 | 348,190 |
| 9 | Lublin | Lublin | 357,110 | 353,483 | 348,450 | 339,784 |
| 10 | Białystok | Podlaskie | 291,383 | 294,830 | 295,198 | 297,554 |
| 11 | Katowice | Silesia | 327,222 | 314,500 | 306,826 | 292,774 |
| 12 | Gdynia | Pomerania | 253,458 | 251,844 | 247,324 | 246,348 |
| 13 | Częstochowa | Silesian | 251,436 | 245,030 | 238,042 | 220,433 |
| 14 | Radom | Masovian | 229,699 | 225,810 | 222,496 | 211,371 |
| 15 | Toruń | Kuyavia-Pomerania | 211,243 | 207,190 | 205,312 | 201,447 |
| 16 | Sosnowiec | Silesia | 232,622 | 225,030 | 217,638 | 199,974 |
| 17 | Rzeszów | Subcarpathia | 160,376 | 165,578 | 178,227 | 196,208 |
| 18 | Kielce | Świętokrzyskie | 212,429 | 207,188 | 203,804 | 194,852 |
| 19 | Gliwice | Silesia | 203,814 | 198,499 | 195,472 | 178,603 |
| 20 | Zabrze | Silesia | 195,293 | 190,110 | 186,913 | 172,360 |
| 21 | Olsztyn | Warmia-Masuria | 173,102 | 174,941 | 176,463 | 171,979 |
| 22 | Bielsko-Biała | Silesia | 178,028 | 176,453 | 175,008 | 170,663 |
| 23 | Bytom | Silesia | 193,546 | 186,540 | 181,617 | 165,263 |
| 24 | Zielona Góra | Lubusz | 118,293 | 138,512 | 117,699 | 141,222 |
| 25 | Rybnik | Silesia | 142,731 | 141,388 | 141,410 | 138,098 |
| 26 | Ruda Śląska | Silesia | 150,595 | 145,471 | 142,950 | 137,360 |
| 27 | Opole | Opole | 129,946 | 127,602 | 125,710 | 128,035 |
| 28 | Tychy | Silesia | 132,816 | 130,492 | 129,386 | 127,590 |
| 29 | Gorzów Wielkopolski | Lubusz | 125,914 | 125,504 | 125,394 | 123,609 |
| 30 | Płock | Masovian | 128,361 | 127,224 | 126,061 | 119,425 |
| 31 | Dąbrowa Górnicza | Silesia | 132,236 | 129,559 | 127,431 | 119,373 |
| 32 | Elbląg | Warmia-Masuria | 128,134 | 126,985 | 126,049 | 119,317 |
| 33 | Wałbrzych | Lower Silesia | 130,268 | 124,988 | 120,197 | 111,356 |
| 34 | Włocławek | Kuyavia-Pomerania | 121,229 | 119,256 | 116,914 | 109,883 |
| 35 | Tarnów | Lesser Poland | 119,913 | 116,967 | 114,635 | 108,470 |
| 36 | Chorzów | Silesia | 117,430 | 113,978 | 112,697 | 107,807 |
| 37 | Koszalin | Western Pomerania | 108,709 | 107,693 | 107,948 | 107,048 |
| 38 | Kalisz | Greater Poland | 109,498 | 108,477 | 106,664 | 100,246 |
| 39 | Legnica | Lower Silesia | 107,100 | 105,186 | 103,892 | 99,350 |
| 40 | Grudziądz | Kuyavia-Pomerania | 99,943 | 99,244 | 98,757 | 94,368 |
| 41 | Jaworzno | Silesia | 96,791 | 95,771 | 94,831 | 91,115 |
| 42 | Słupsk | Pomerania | 100,376 | 98,092 | 96,665 | 90,681 |
| 43 | Jastrzębie-Zdrój | Silesia | 96,821 | 94,716 | 92,622 | 88,743 |
| 44 | Nowy Sącz | Lesser Poland | 84,421 | 84,487 | 84,537 | 83,794 |
| 45 | Jelenia Góra | Lower Silesia | 88,866 | 86,503 | 84,023 | 79,061 |
| 46 | Siedlce | Masovian | 76,686 | 77,051 | 76,303 | 78,185 |
| 47 | Mysłowice | Silesia | 75,642 | 75,063 | 75,501 | 74,618 |
| 48 | Konin | Greater Poland | 82,177 | 80,471 | 78,670 | 73,522 |
| 49 | Piła | Greater Poland | 75,197 | 74,720 | 74,550 | 73,139 |
| 50 | Piotrków Trybunalski | Łódź | 80,923 | 78,954 | 77,669 | 73,090 |
Demographics by voivodeship
| Inhabitants of voivodeships (2008, according to GUS) | |||
|---|---|---|---|
| Lower Silesian | 19 947 | 2 887 059 | -0,04 |
| Kuyavian-Pomeranian | 17 972 | 2 067 918 | +0,07 |
| Lublin | 25 122 | 2 161 832 | -0,15 |
| Lubusz | 13 998 | 1 008 926 | 0,00 |
| Łódź | 18 219 | 2 548 861 | -0,20 |
| Lesser Poland | 15 183 | 3 287 136 | +0.22 |
| Masovian | 35 558 | 5 204 495 | +0,26 |
| Opole | 9412 | 1 033 040 | -0,31 |
| Subcarpathian | 17 846 | 2 099 495 | +0,03 |
| Podlaskie (Demographics) | 20 187 | 1 191 470 | -0,07 |
| Pomeranian | 18 310 | 2 219 512 | +0,32 |
| Silesian | 12 334 | 4 645 665 | -0.12 |
| Świętokrzyskie | 11 710 | 1 272 784 | -0,20 |
| Warmian-Masurian | 24 173 | 1 427 073 | +0,03 |
| Greater Poland | 29 827 | 3 397 617 | +0.26 |
| West Pomeranian | 22 892 | 1 692 957 | +0,04 |
| Poland | 312 679 | 38 135 876 | +0,05 |
Immigration
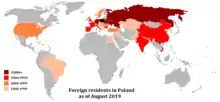
Immigration to Poland has only picked up recently after 2014, when unemployment started falling and more workforce was needed. Most migration is temporary, with workers arriving for 3 to 12 months and then returning home with the earned money. Some of them stay long enough to acquire permanent and long-term stay permits (table below), but the actual amount of migrants in Poland is far higher. On June 4 GUS published an estimate[37] of foreigners residing in Poland as of 31 December 2019, which amounted to 2,106,101 people, the biggest groups being citizens of Ukraine (1,351,418), Belarus (105,404), Germany (77,073), Moldova (37,338), Russia (37,030), India (33,107), Georgia (27,917), Vietnam (27,386), Turkey (25,049), China (23,838) and 360,541 people representing all other nationalities.
| Nationality | Population (2020) |
|---|---|
| 233,828 | |
| 27,929 | |
| 21,019 | |
| 12,815 | |
| 11,699 | |
| 10,174 | |
| 8,485 | |
| 8,234 | |
| 6,860 | |
| 6,336 | |
| 5,889 | |
| 5,690 | |
| 5,362 | |
| 4,948 | |
| 4,450 | |
| 3,366 | |
| 3,030 | |
| 2,593 | |
| 2,505 | |
| 2,477 | |
| 2,390 | |
| 2,313 | |
| 2,257 | |
| 2,240 | |
| 2,196 |
| Country | 2014 | 2015 | 2016 | 2017 | 2018 | 2019 |
|---|---|---|---|---|---|---|
| 26,315 | 50,465 | 106,223 | 192,547 | 238,334 | 330,495 | |
| 1,834 | 2,037 | 4,870 | 10,518 | 19,233 | 27,130 | |
| 402 | 596 | 1,211 | 7,075 | 19,912 | 9,175 | |
| 1,027 | 1,488 | 2,844 | 3,792 | 6,035 | 8,341 | |
| 1,242 | 1,425 | 1,772 | 3,938 | 8,362 | 8,063 | |
| 225 | 88 | 142 | 398 | 2,752 | 7,438 | |
| 283 | 319 | 721 | 2,412 | 8,341 | 6,986 | |
| 246 | 179 | 249 | 733 | 2,057 | 6,317 | |
| 1,060 | 1,433 | 836 | 1,409 | 2,634 | 6,309 | |
| 2,369 | 732 | 439 | 658 | 1,313 | 3,367 | |
| 103 | 116 | 193 | 1,336 | 3,302 | 3,183 | |
| 689 | 550 | 672 | 1,228 | 1,481 | 2,936 | |
| 654 | 579 | 1,008 | 1,433 | 1,903 | 2,862 | |
| 94 | 75 | 111 | 148 | 352 | 2,023 | |
| 2,133 | 1,288 | 1,205 | 1,179 | 1,473 | 1,935 | |
| 301 | 153 | 150 | 219 | 720 | 1,838 | |
| 126 | 74 | 112 | 321 | 803 | 1,689 | |
| 103 | 59 | 98 | 353 | 868 | 1,323 | |
| 133 | 42 | 19 | 81 | 654 | 1,283 | |
| 274 | 184 | 187 | 427 | 1,065 | 911 | |
| 613 | 650 | 804 | 878 | 930 | 911 | |
| 16 | 42 | 42 | 73 | 302 | 835 | |
| 40 | 24 | 88 | 640 | 522 | 740 | |
| 211 | 212 | 291 | 348 | 376 | 625 | |
| 505 | 544 | 391 | 405 | 479 | 560 | |
| 2 | 1 | 0 | 17 | 328 | 505 | |
| 52 | 51 | 36 | 139 | 261 | 499 | |
| 97 | 113 | 247 | 354 | 458 | 458 | |
| 363 | 140 | 156 | 181 | 281 | 433 | |
| 155 | 134 | 127 | 172 | 246 | 364 | |
| Others | 1,996 | 1,993 | 2,150 | 2,214 | 2,991 | 5,204 |
| Total | 43,663 | 65,786 | 127,394 | 235,626 | 328,768 | 444,738 |
Most immigrants are hired using short-term work registrations, which are an easier way for employers to hire foreigners, than work permits, and only apply to workers from 6 former CIS countries.[40][41] Between 2007 and 2017, they figured as "Declaration of intention to entrust work to a foreigner", though it led to numerous abuses, since after submitting the statement, employers were not obliged to report whether the foreigner had come, and whether he had taken the job. Migrants would sometimes take up different work than previously indicated, use the permit to move to Western Europe, or not arrive at all. On 1 January 2018, it was replaced by "Declaration of entrusting work to a foreigner". Since then, employers are obliged to report the fact that the migrant has taken up employment. The change limits the comparability of the data from the previous periods.[42]
| Country | 2018 | 2019 | 2020 |
|---|---|---|---|
| 1,446,304 | 1,475,923 | 1,329,491 | |
| 62,805 | 66,045 | 78,905 | |
| 36,742 | 39,414 | 45,281 | |
| 28,008 | 45,137 | 44,270 | |
| 6,718 | 11,262 | 19,246 | |
| 1,648 | 2,302 | 2,406 | |
| Total | 1,582,225 | 1,640,083 | 1,519,599 |
Since January 2018, employers may hire foreigners on a seasonal work permit, used specifically for agricultural and tourism-related work.[43] In 2020, 60,8% of hired foreigners were women, 42% were under 35 years old, and most worked in Poland from 31 to 90 days.[44] The vast majority of migrants comes from Ukraine, as well as Belarus, Moldova and Georgia, since the law doesn't require the employer to look for potential Polish workers before hiring a foreigner from said countries.
| Country | 2018 | 2019 | 2020 |
|---|---|---|---|
| 119,926 | 129,683 | 135,482 | |
| 607 | 659 | 625 | |
| 359 | 380 | 342 | |
| 199 | 302 | 291 | |
| 3 | 66 | 122 | |
| 0 | 1 | 120 | |
| 15 | 78 | 78 | |
| 1 | 0 | 62 | |
| 45 | 79 | 62 | |
| 0 | 3 | 44 | |
| Others | 35 | 97 | 175 |
| Total | 121,436 | 131,446 | 137,403 |
Ethnic groups
| Population background | % | Population[45] |
|---|---|---|
| European | 98.6 | 37,962,000 |
| European Union | 98.2 | 37,813,000 |
| Ethnic Polish (including Silesians and Kashubians) | 97.7 | 37,602,000 |
| Other EU member states (primarily German) | 0.5 | 211,000 |
| European Other (primarily Ukrainian and Belarusian) | 0.4 | 149,000 |
| Other background (primarily Vietnamese and Chechen) | 0.1 | 29,000 |
| Mixed or unspecified background | 1.4 | 521,000 |
| Total population | 100 | 38,512,000 |
Religions
Religion in Poland in 2015 conducted by the Central Statistical Office (GUS)[46]
Languages
- Polish 97.8%, other and unspecified 2.2% (2002 census)
See also
Notes
- In fertility rates, 2.1 and above is a stable population and has been marked blue, 2 and below leads to an aging population and the result is that the population decreases.
References
- "Historical and current population of Poland, based on United Nations data".
- "Ludność w gminach według stanu w dniu 31.12.2011 r. - bilans opracowany w oparciu o wyniki NSP 2011". Stat.gov.pl. Retrieved 31 August 2017.
- "Poland: Aging and the Economy". Worldbank.org. Retrieved 31 August 2017.
- "Poland Total fertility rate". Indexmundi.com. Retrieved 20 June 2015.
- "Russia experiences baby boom". Euromonitor.typepad.com. Archived from the original on 6 January 2015. Retrieved 31 August 2017.
- (2018 est.) male: 4.7 deaths/1,000 live births (2018 est.) a=v&q=cache:FPKzOUeamXsJ:www.stat.gov.pl/cps/rde/xbcr/gus/PUBL_lu_wyniki_wstepne_NSP_2011.pdf+wyniki+spisu+powszechnego+2011&hl=pl&gl=pl&pid=bl&srcid=ADGEESg_wnDuuA5l8omr6wwucTp9PzbFgKvIPAosqkXslBy7g5DBp1LFgMTYqZg_uHPD6m_S4UX_azmFLvVmDdGfgzgmFfRkWwBu2hkSOcfcA2uCQxmF_eadAEufCM91H96y2Rmct7QB&sig=AHIEtbRBTGAFs8jCrfMfgrRMkLh21z1V3g
- ""Sueddeutsche Zeitung": Polska przeżywa największą falę emigracji od 100 lat". Wiadomosci.onet.pl. 26 September 2014. Retrieved 31 August 2017.
- B.R. Mitchell. European historical statistics, 1750-1975.
- "United Nations : Demographic Yearbook 1948" (PDF). Unstats.un.org. Retrieved 30 August 2017.
- "Archived copy". Archived from the original on 2008-09-17. Retrieved 2008-08-29.CS1 maint: archived copy as title (link)
- Max Roser (2014), "Total Fertility Rate around the world over the last centuries", Our World In Data, Gapminder Foundation
- "Démographie des pays développés". Ined.fr. Archived from the original on 2 July 2014. Retrieved 20 June 2015.
- "Archived copy". Archived from the original on 2014-06-16. Retrieved 2014-06-09.CS1 maint: archived copy as title (link)
- "Archived copy". Archived from the original on 2011-12-27. Retrieved 2012-01-03.CS1 maint: archived copy as title (link)
- "Archived copy". Archived from the original on 2014-05-25. Retrieved 2014-05-24.CS1 maint: archived copy as title (link)
- "Informacja o sytuacji społeczno-gospodarczej kraju w 2016 r." Stat.gov.pl. Retrieved 31 August 2017.
- Główny Urząd Statystyczny / Obszary tematyczne / Inne opracowania / Informacje o sytuacji społeczno-gospodarczej / Informacja o sytuacji społeczno-gospodarczej kraju w 2017 r
- Statistics Poland / Topics / Other studies / Informations on socio-economic situation / Statistical Bulletin No 2/2020
- Eurostat - Tables, Graphs and Maps Interface (TGM) table
- "World Factbook EUROPE : POLAND", The World Factbook, July 12, 2018
- "Statistical Bulletin No 11/2020 - Population". Central Statistical Office of Poland. Retrieved 23 December 2020.
- "World Population Prospects – Population Division – United Nations". Retrieved 2017-07-15.
- "United Nations Statistics Division - Demographic and Social Statistics". Unstats.un.org. Retrieved 31 August 2017.
- "Ludność. Stan i struktura ludności oraz ruch naturalny w przekroju terytorialnym. Stan w dniu 30 VI 2015 r." Stat.gov.pl. Retrieved 31 August 2017.
- "Poland Population 2019", World Population Review
- "Struktura narodowo-etniczna, językowa i wyznaniowa ludności Polski - NSP 2011". Stat.gov.pl (in Polish). Retrieved 2017-01-31.
- "Obywatele Ukrainy pracujący w Polsce – raport z badania" (PDF). Nbp.pl. Retrieved 31 August 2017.
- "Project 1.4.3". 28 July 2009. Archived from the original on 28 July 2009. Retrieved 31 August 2017.
- "Archived copy". Archived from the original on 2011-04-06. Retrieved 2010-09-05.CS1 maint: archived copy as title (link)
- ["Archived copy" (PDF). Archived from the original (PDF) on 2010-03-31. Retrieved 2016-01-19.CS1 maint: archived copy as title (link)
- "World Urbanization Prospects" (PDF). United Nations - Department of Economic and Social Affairs / Population Division, The 2003 Revision (data of 2000). Retrieved 31 August 2017.
- "World Urban Areas" (PDF). Demographia.com. Retrieved 31 August 2017.
- "Major Agglomerations of the World - Population Statistics and Maps". Citypopulation.de. Retrieved 31 August 2017.
- "Archived copy" (PDF). Archived from the original (PDF) on 2009-03-27. Retrieved 2009-03-28.CS1 maint: archived copy as title (link)
- "Archived copy" (PDF). Archived from the original (PDF) on 2009-01-24. Retrieved 2009-04-04.CS1 maint: archived copy as title (link)
- Data of polycentric Silesian metropolitan area
- https://stat.gov.pl/statystyki-eksperymentalne/kapital-ludzki/populacja-cudzoziemcow-w-polsce-w-czasie-covid-19,12,1.html
- https://migracje.gov.pl/en/statistics/scope/poland/type/statuses/view/tables/year/2020/
- https://psz.praca.gov.pl/web/urzad-pracy/-/8180075-zezwolenia-na-prace-cudzoziemcow
- https://psz.praca.gov.pl/web/urzad-pracy/-/8180205-rejestracja-oswiadczen-pracodawcow-o-zamiarze-powierzenia-pracy-cudzoziemcowi
- https://psz.praca.gov.pl/web/urzad-pracy/-/8180211-oswiadczenia-o-powierzeniu-wykonywania-pracy-cudzoziemcowi-wpisane-do-ewidencji-oswiadczen-obowiazujace-od-2018-r-
- https://stat.gov.pl/obszary-tematyczne/ludnosc/migracje-zagraniczne-ludnosci/sytuacja-demograficzna-polski-do-roku-2019-migracje-zagraniczne-ludnosci,16,1.html
- https://www.gov.pl/web/rodzina/zezwolenie-na-prace-sezonowa1
- https://psz.praca.gov.pl/web/urzad-pracy/-/8180228-zezwolenia-na-prace-sezonowa-cudzoziemca
- Główny Urząd Statystyczny (January 2013). Ludność. Stan i struktura demograficzno-społeczna [Narodowy Spis Powszechny Ludności i Mieszkań 2011] (PDF) (in Polish). Główny Urząd Statystyczny. Retrieved 12 December 2014.
- GUS. "Infographic - Religiousness of Polish inhabitiants". stat.gov.pl. Retrieved 2019-06-17.
