Demography of Northern Ireland
Northern Ireland is the smallest of the four components of the United Kingdom in terms of both area and population, containing 2.9% of the total population and 5.7% of the total area of the United Kingdom. It is the smaller of the two political entities on the island of Ireland by area and population, the other being the Republic of Ireland, a sovereign state which gained partial independence from the United Kingdom in 1921, as “ the Irish Free State”. Northern Ireland contains 28.3% of the total population and 16.75% of the total area of the island of Ireland.
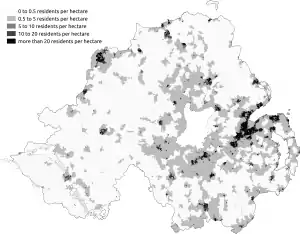
Northern Ireland, as recorded by the 2011 United Kingdom census, has a population of 1,810,863, an increase of 125,800 (7.5%) over the ten-year period since the last census.[1] The population density is 133 people per km2, about half that of the United Kingdom as a whole but about twice that of the Republic.[2] The Belfast Metropolitan Area dominates in population terms, with over a third of the inhabitants of Northern Ireland.
Like Great Britain (but unlike most of the Republic of Ireland), Northern Ireland has a plurality of Protestants (48% of the resident population are either Protestant, or brought up Protestant, while 45% of the resident population are either Catholic, or brought up Catholic, according to the 2011 census)[3] and its people speak both Irish and dialects of English heavily influenced by the Scots language. This is both because of historic links with Scotland going back centuries, and because of settlements of lowland Scots Protestants in Ulster in the 17th century, such as the Plantation of Ulster. Also unlike the Republic, a large proportion of people in Northern Ireland have a British national identity. Many people in Northern Ireland have a Northern Irish identity, whether in addition to a British or Irish identity or by itself.
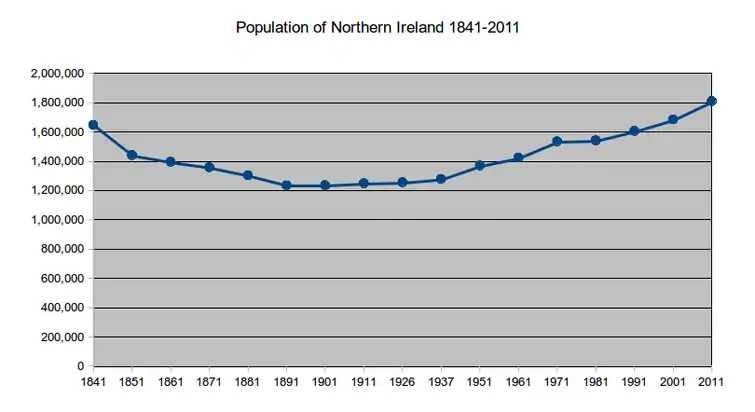
Historic population trends
| Year | Pop. | ±% |
|---|---|---|
| 1841 | 1,648,945 | — |
| 1851 | 1,442,517 | −12.5% |
| 1861 | 1,396,453 | −3.2% |
| 1871 | 1,359,190 | −2.7% |
| 1881 | 1,304,816 | −4.0% |
| 1891 | 1,236,056 | −5.3% |
| 1901 | 1,236,952 | +0.1% |
| 1911 | 1,250,531 | +1.1% |
| 1926 | 1,256,561 | +0.5% |
| 1951 | 1,370,921 | +9.1% |
| 1961 | 1,425,042 | +3.9% |
| 1971 | 1,536,065 | +7.8% |
| 1981 | 1,543,000 | +0.5% |
| 1991 | 1,607,300 | +4.2% |
| 2001 | 1,685,267 | +4.9% |
| 2011 | 1,810,863 | +7.5% |
| 2019 | 1,893,667 | +4.6% |
| Note: 1981 and 1991 data[4]
Data for years prior to 1926 are from the Census of Ireland, for those counties that became Northern Ireland in 1920. 2019 estimates[5] | ||
Place of birth
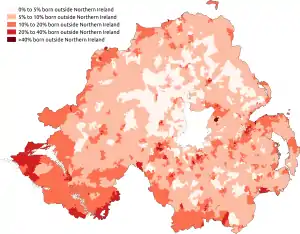
In 2001, 91.0% of the population were born in Northern Ireland, 7.2% were born in other parts of the UK and Ireland, and 1.8% were born elsewhere. By 2011, the proportion of immigrants from outside the UK and Ireland had risen to 4.3%, while the proportion born within them (outside Northern Ireland) had fallen to 6.7%. The highest number of non-British/Irish immigrants are in Belfast, followed by Craigavon Urban Area and Dungannon. Dungannon has a bigger share of immigrants than any town in Northern Ireland, while Strabane has the smallest share of these immigrants.[6]
| Place of Birth | 2001 population[7] | 2001% | 2011 population[8] | 2011% |
|---|---|---|---|---|
| Northern Ireland | 1,534,268 | 91.04 | 1,608,853 | 88.84 |
| 61,609 | 3.66 | 64,717 | 3.57 | |
| 16,772 | 1.00 | 15,455 | 0.85 | |
| 3,008 | 0.18 | 2,552 | 0.14 | |
| 39,051 | 2.32 | 37,833 | 2.09 | |
| Other | 10,355 | 0.61 | ||
| — Member countries prior to 2004 expansion | 9,703 | 0.54 | ||
| — Accession countries 2004 onwards | 35,704 | 1.97 | ||
| Other outside the EU | 20,204 | 1.20 | 36,046 | 1.99 |
| Total | 1,685,267 | 100.00 | 1,810,863 | 100.00 |
Age bands broken down by place of birth in the 2011 census.[9]
| Place of birth | All ages | 0 to 15 | 16 to 34 | 35 to 64 | 65 and over |
|---|---|---|---|---|---|
| Northern Ireland | 88.8% | 93.7% | 86.3% | 87.4% | 90.2% |
| England | 3.6% | 2.0% | 3.4% | 4.7% | 3.1% |
| Scotland | 0.9% | 0.4% | 0.7% | 1.1% | 1.1% |
| Wales | 0.1% | 0.1% | 0.1% | 0.2% | 0.2% |
| Republic of Ireland | 2.1% | 0.6% | 1.6% | 2.4% | 4.3% |
| EU member countries prior to 2004 expansion | 0.5% | 0.3% | 0.8% | 0.6% | 0.2% |
| EU accession countries 2004 onwards | 2.0% | 1.5% | 4.3% | 1.4% | 0.1% |
| Other | 2.0% | 1.4% | 2.7% | 2.3% | 0.8% |
Below are the 5 largest foreign-born groups in Northern Ireland according to 2014 ONS estimates.[10]
| Country of birth | Estimated population, 2013 | Estimated population, 2014 | Estimated population, 2015 |
|---|---|---|---|
| 25,000 | 20,000 | 18,000 | |
| 7,000 | 8,000 | 13,000 | |
| 8,000 | 6,000 | 6,000 | |
| 3,000 | 4,000 | 5,000 |
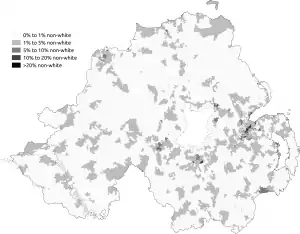
Ethnicity
The following table shows the ethnic group of respondents in the 2001 and 2011 censuses.
| Ethnic group | 2001 population[11] | 2001% | 2011 population[12] | 2011% |
|---|---|---|---|---|
| White: | 1,670,988 | 99.15 | 1,778,449 | 98.21 |
| White: Irish Traveller/White Gypsy | 1,710 | 0.10 | 1,301 | 0.07 |
| White: Total | 1,672,698 | 99.25 | 1,779,750 |
98.28 |
| Asian or Asian British: Indian | 1,567 | 0.09 | 6,198 | 0.34 |
| Asian or Asian British: Pakistani | 668 | 0.04 | 1,091 | 0.06 |
| Asian or Asian British: Bangladeshi | 252 | 0.01 | 540 | 0.03 |
| Asian or Asian British: Chinese | 4,145 | 0.25 | 6,303 | 0.35 |
| Asian or Asian British: Asian Other | 194 | 0.01 | 4,998 | 0.28 |
| Asian or Asian British: Total | 6,824 | 0.40 | 19,130 | 1.06 |
| Black or Black British: Caribbean | 255 | 0.02 | 372 | 0.02 |
| Black or Black British: African | 494 | 0.03 | 2,345 | 0.13 |
| Black or Black British: Other | 387 | 0.02 | 899 | 0.05 |
| Black or Black British: Total | 1,136 | 0.07 | 3,616 |
0.20 |
| Mixed: Total | 3,319 | 0.20 | 6,014 | 0.33 |
| Other: Any other ethnic group:Total | 1,290 | 0.08 | 2,353 |
0.13 |
| Total | 1,685,267 | 100 | 1,810,863 | 100 |
Languages spoken
English is by far the most commonly spoken language in Northern Ireland. Two regional languages of Northern Ireland, Irish and Ulster Scots, are protected under the European Charter for Regional or Minority Languages. Several other languages are spoken by immigrants to Northern Ireland, the most common of which is Polish.
Main language of all usual residents aged 3 and over in the 2011 Census[13]
| Main language | Usual residents aged 3+ | Proportion |
|---|---|---|
| English | 1,681,171 | 96.86% |
| Polish | 17,731 | 1.02% |
| Lithuanian | 6,250 | 0.36% |
| Irish | 4,164 | 0.24% |
| Portuguese | 2,293 | 0.13% |
| Slovak | 2,257 | 0.13% |
| Chinese | 2,214 | 0.13% |
| Tagalog/Filipino | 1,895 | 0.11% |
| Latvian | 1,273 | 0.07% |
| Russian | 1,191 | 0.07% |
| Hungarian | 1,008 | 0.06% |
| Other | 13,090 | 0.75% |
Ability in Irish of all usual residents aged 3 and over in the Census[14][15]
| Ability in Irish | 2001 | 2011 | ||
|---|---|---|---|---|
| Usual residents aged 3+ | Proportion | Usual residents aged 3+ | Proportion | |
| Can understand | 133,352 | 8.2% | 161,662 | 9.3% |
| Can speak | 115,731 | 7.2% | 104,943 | 6.0% |
| Can read | 102,784 | 6.4% | 87,871 | 5.1% |
| Can write | 90,879 | 5.6% | 76,647 | 4.4% |
| Has some ability | 167,490 | 10.4% | 184,898 | 10.7% |
| Can understand, speak, read and write | 75,125 | 4.6% | 64,847 | 3.7% |
Ability in Ulster Scots of all usual residents aged 3 and over in the Census[16]
| Ability in Ulster Scots | 2011 | |
|---|---|---|
| Usual residents aged 3+ | Proportion | |
| Can understand | 134,157 | 7.7% |
| Can speak | 35,404 | 2.0% |
| Can read | 37,501 | 2.2% |
| Can write | 18,187 | 1.0% |
| Has some ability | 140,204 | 8.1% |
| Can understand, speak, read and write | 16,373 | 0.9% |
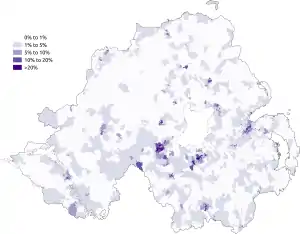
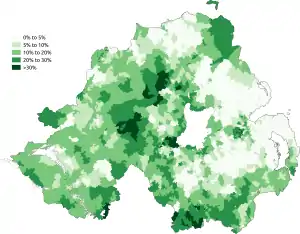
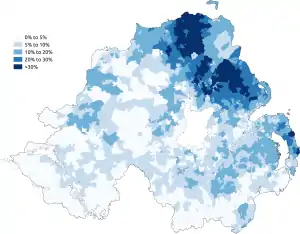
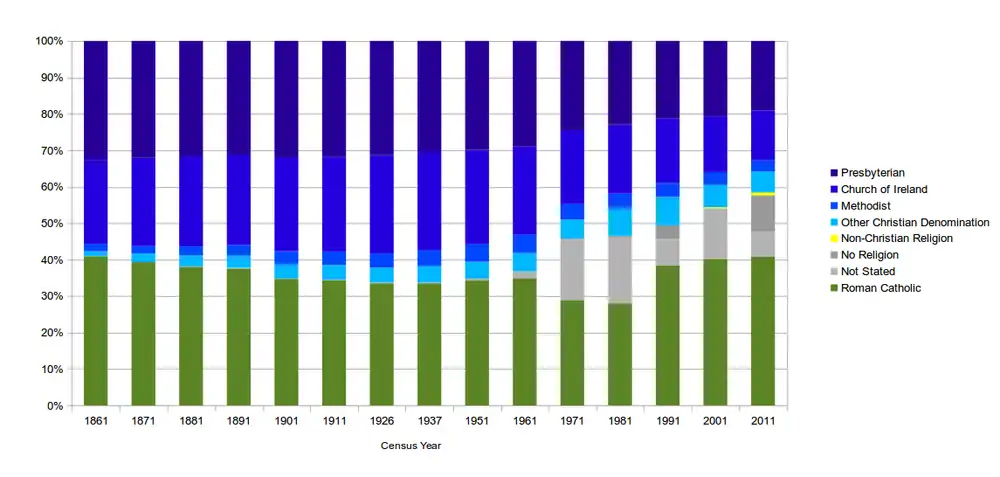
Religion
The following table shows the religion stated by respondents to the 2001 and 2011 censuses.
| Religion stated | 2001[17] | 2011[18] | ||
|---|---|---|---|---|
| Number | % | Number | % | |
| Roman Catholic | 678,462 | 40.2 | 738,033 | 40.8 |
| Presbyterian Church in Ireland | 348,742 | 20.7 | 345,101 | 19.1 |
| Church of Ireland | 257,788 | 15.3 | 248,821 | 13.7 |
| Methodist Church in Ireland | 59,173 | 3.5 | 54,253 | 3.0 |
| Other Christian | 102,221 | 6.1 | 104,380 | 5.8 |
| (Total non-Roman Catholic Christian) | 767,924 | 45.6 | 752,555 | 41.6 |
| (Total Christian) | 1,446,386 | 85.8 | 1,490,588 | 82.3 |
| Other religion | 5,028 | 0.3 | 14,859 | 0.8 |
| No religion | 183,164 | 10.1 | ||
| Religion not stated | 122,252 | 6.8 | ||
| (No religion and Religion not stated) | 233,853 | 13.9 | 305,416 | 16.9 |
| Total population | 1,685,267 | 100.0 | 1,810,863 | 100.0 |
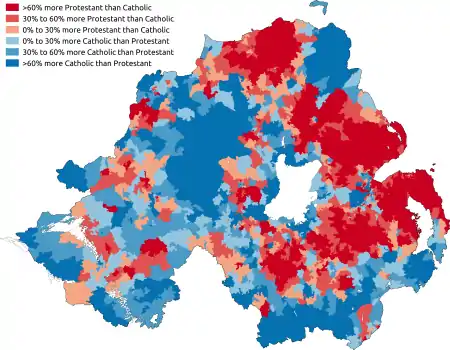
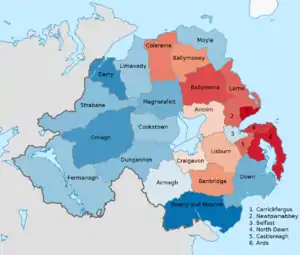
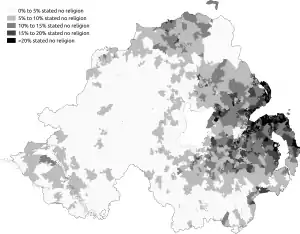
The religious affiliations in the districts of Northern Ireland at the time of the 2011 census were as follows. Note that these boundaries changed in 2015.
| District | 2001[19] | 2011[20] | ||||
|---|---|---|---|---|---|---|
| Catholic | Protestant and other Christian | Other | Catholic | Protestant and other Christian | Other | |
| Antrim | 35.2% | 47.2% | 17.6% | 37.5% | 43.2% | 19.2% |
| Ards | 10.4% | 68.7% | 20.9% | 10.9% | 65.4% | 23.6% |
| Armagh | 45.4% | 45.5% | 9.1% | 44.8% | 43.0% | 12.2% |
| Ballymena | 19.0% | 67.8% | 13.3% | 20.4% | 63.3% | 16.3% |
| Ballymoney | 29.5% | 59.1% | 11.3% | 29.6% | 56.7% | 13.6% |
| Banbridge | 28.6% | 58.7% | 12.7% | 29.4% | 55.3% | 15.3% |
| Belfast | 42.1% | 40.3% | 17.5% | 41.9% | 34.1% | 24.0% |
| Carrickfergus | 6.5% | 70.4% | 23.1% | 7.6% | 67.2% | 25.2% |
| Castlereagh | 15.8% | 64.9% | 19.3% | 19.5% | 57.3% | 23.2% |
| Coleraine | 24.1% | 60.5% | 15.4% | 25.0% | 56.8% | 18.2% |
| Cookstown | 55.2% | 38.0% | 6.8% | 55.1% | 34.0% | 11.0% |
| Craigavon | 41.7% | 46.7% | 11.6% | 42.1% | 42.1% | 15.8% |
| Derry | 70.9% | 20.8% | 8.4% | 67.4% | 19.4% | 13.1% |
| Down | 57.1% | 29.2% | 13.7% | 57.5% | 27.1% | 15.4% |
| Dungannon | 57.3% | 34.9% | 7.7% | 58.7% | 29.8% | 11.5% |
| Fermanagh | 55.5% | 36.1% | 8.4% | 54.9% | 34.3% | 10.8% |
| Larne | 22.2% | 61.9% | 15.9% | 21.8% | 59.7% | 18.5% |
| Limavady | 53.1% | 36.1% | 10.7% | 56.0% | 34.3% | 9.7% |
| Lisburn | 30.1% | 53.6% | 16.4% | 32.8% | 47.9% | 19.3% |
| Magherafelt | 61.5% | 32.0% | 6.5% | 62.4% | 28.3% | 9.3% |
| Moyle | 56.6% | 33.8% | 9.6% | 54.4% | 32.3% | 13.3% |
| Newry and Mourne | 75.9% | 16.4% | 7.7% | 72.1% | 15.2% | 12.7% |
| Newtownabbey | 17.1% | 64.5% | 18.4% | 19.9% | 57.8% | 22.3% |
| North Down | 10.0% | 64.5% | 25.5% | 11.2% | 60.3% | 28.5% |
| Omagh | 65.1% | 26.3% | 8.6% | 65.4% | 24.8% | 9.8% |
| Strabane | 63.1% | 30.9% | 6.0% | 60.1% | 30.7% | 9.2% |
Religions broken down by place of birth in the 2011 census.[21]
| Place of birth | Catholic | Protestant and other Christian | Other Religion | None or not stated | Population |
|---|---|---|---|---|---|
| Northern Ireland | 40.7% | 43.5% | 0.5% | 15.4% | 1,608,853 (88.8%) |
| England | 30.1% | 36.7% | 1.6% | 31.6% | 64,717 (3.6%) |
| Scotland | 25.0% | 41.9% | 1.1% | 32.0% | 15,455 (0.9%) |
| Wales | 17.6% | 42.0% | 2.1% | 38.2% | 2,552 (0.1%) |
| Republic of Ireland | 63.8% | 22.6% | 0.7% | 12.9% | 37,833 (2.1%) |
| Other EU: Member countries prior to 2004 expansion | 28.8% | 26.1% | 1.6% | 43.5% | 9,703 (0.5%) |
| Other EU: Accession countries 2004 onwards | 63.1% | 6.2% | 0.8% | 29.9% | 35,720 (2.0%) |
| Other | 28.2% | 23.9% | 15.4% | 32.5% | 36,030 (2.0%) |
The religious affiliations in the different age bands in the 2011 census were as follows:[22]
| Ages attained (years) | Catholic | Protestant and other Christian | Other Religion | None or not stated |
|---|---|---|---|---|
| 0 to 4 | 44.3% | 31.7% | 0.9% | 23.2% |
| 5 to 9 | 45.5% | 36.1% | 0.7% | 17.7% |
| 10 to 14 | 45.9% | 37.9% | 0.6% | 15.6% |
| 15 to 19 | 44.8% | 37.6% | 0.6% | 17.0% |
| 20 to 24 | 43.4% | 35.2% | 0.7% | 20.7% |
| 25 to 29 | 44.8% | 33.1% | 1.1% | 21.0% |
| 30 to 34 | 44.0% | 34.3% | 1.4% | 20.3% |
| 35 to 39 | 41.5% | 37.8% | 1.2% | 19.5% |
| 40 to 44 | 40.4% | 41.1% | 0.9% | 17.7% |
| 45 to 49 | 40.0% | 42.8% | 0.8% | 16.3% |
| 50 to 54 | 39.2% | 44.9% | 0.7% | 15.1% |
| 55 to 59 | 38.1% | 46.5% | 0.8% | 14.6% |
| 60 to 64 | 35.8% | 50.0% | 0.7% | 13.4% |
| 65 to 69 | 33.7% | 54.4% | 0.7% | 11.2% |
| 70 to 74 | 32.9% | 56.4% | 0.7% | 10.1% |
| 75 to 79 | 32.0% | 58.1% | 0.6% | 9.3% |
| 80 to 84 | 30.0% | 60.0% | 0.6% | 9.3% |
| 85 to 89 | 28.1% | 61.8% | 0.5% | 9.6% |
| 90 and over | 25.8% | 64.0% | 0.5% | 9.6% |
National identity
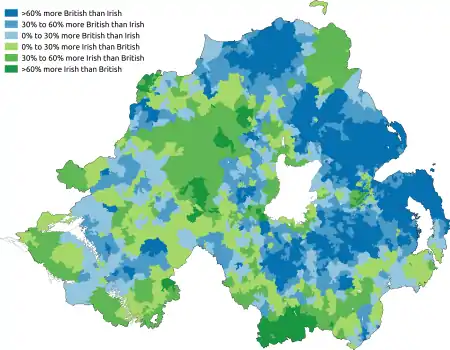
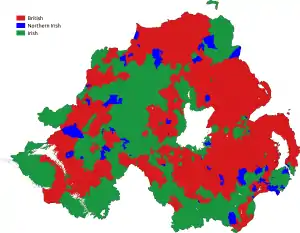
In Northern Ireland national identity is complex. Many in Northern Ireland have a British national identity and view the English, Scots and Welsh as fellow members of their common nation while regarding people from the Republic of Ireland as foreigners. Many others in Northern Ireland view people from the Republic of Ireland as being members of their common nation encompassing the island of Ireland and regard the English, Scots and Welsh as foreigners. Co-existing with this dichotomy is a Northern Irish identity, which can be held alone or, as is also the case with Englishness, Scottishness and Welshness, alongside a British identity, or alongside an Irish identity. A small number of people see themselves as being both British and Irish.
Although there is a strong correlation between religion and national identity, Catholics tending to identify as Irish and Protestants tending to identify as British, this is not an absolute relationship, and the correlation is much weaker amongst Catholics than it is amongst Protestants. Amongst Catholics, geography also plays an important role, with Catholics in heavily Protestant parts of Northern Ireland being more likely to call themselves British and less likely to call themselves Irish than Catholics in more Catholic areas of Northern Ireland. (The reverse is true for Protestants, but to a lesser extent.) In the 2011 census there were four of the twenty-six districts of Northern Ireland, all on the east coast, where more Catholics considered themselves British than considered themselves Irish.
While in the 2011 census Protestants outnumbered Catholics in only half of the districts in Northern Ireland, those who considered themselves British outnumbered those who considered themselves Irish in twenty of the twenty-six districts in Northern Ireland. This is partly because Catholics were more likely to see themselves as British than Protestants were to see themselves as Irish (13% vs. 4% respectively), but is also partly because those of no religion were substantially more likely to see themselves as British as see themselves as Irish. The irreligious tend to live in Protestant areas, suggesting that they are mostly of Protestant descent. Members of the immigrant population, which includes many Poles, are also more likely to consider themselves Catholic.
Northern Irish identity was almost equally held amongst Protestants as amongst Catholics, and it varied little according to geography.
In the 2011 census respondents gave their national identity as follows.
| National identity | Respondents |
|---|---|
| British | 876,577 |
| Northern Irish | 533,085 |
| Irish | 513,390 |
| English, Scottish or Welsh | 29,187 |
| Other | 61,884 |
National identity by religion[25]
| National identity | All | Catholic | Protestant and other Christian | Other religions | No religion |
|---|---|---|---|---|---|
| British | 48.4% | 12.9% | 81.6% | 50.1% | 55.9% |
| Irish | 28.4% | 57.2% | 3.9% | 12.4% | 14.0% |
| Northern Irish | 29.4% | 30.7% | 26.9% | 18.0% | 35.2% |
| English, Scottish or Welsh | 1.6% | 0.8% | 1.5% | 2.9% | 5.2% |
| All other | 3.4% | 4.4% | 1.0% | 29.1% | 7.1% |
Detail by religion[26]
| National identity | All | Catholic | Protestant and other Christian | Other religions | No religion |
|---|---|---|---|---|---|
| British only | 39.9% | 10.3% | 68.3% | 42.4% | 42.9% |
| Irish only | 25.3% | 53.2% | 2.1% | 8.1% | 9.4% |
| Northern Irish only | 20.9% | 26.9% | 14.5% | 12.0% | 23.7% |
| British and Northern Irish only | 6.2% | 0.9% | 11.1% | 3.3% | 7.9% |
| Irish and Northern Irish only | 1.1% | 2.0% | 0.2% | 0.5% | 0.8% |
| British, Irish and Northern Irish only | 1.0% | 0.8% | 1.0% | 1.0% | 2.1% |
| British and Irish only | 0.7% | 0.8% | 0.5% | 0.7% | 1.0% |
| English, Scottish or Welsh only | 1.0% | 0.6% | 0.8% | 2.1% | 3.5% |
| Other | 4.0% | 4.7% | 1.6% | 29.9% | 8.7% |
| Total | 100.0% | 100.0% | 100.0% | 100.0% | 100.0% |
National identity by age[24]
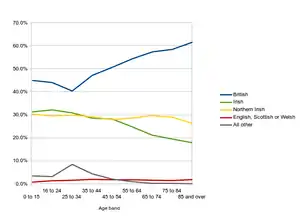
| Ages attained (years) | British | Irish | Northern Irish | English, Scottish or Welsh | All other |
|---|---|---|---|---|---|
| 0 to 15 | 45.1% | 31.4% | 30.5% | 0.9% | 3.6% |
| 16 to 24 | 44.2% | 32.3% | 29.6% | 1.5% | 3.3% |
| 25 to 34 | 40.5% | 31.0% | 30.0% | 1.7% | 8.6% |
| 35 to 44 | 47.3% | 28.7% | 29.3% | 2.1% | 4.5% |
| 45 to 54 | 50.8% | 28.3% | 28.0% | 1.9% | 2.2% |
| 55 to 64 | 54.5% | 24.9% | 28.8% | 1.9% | 1.1% |
| 65 to 74 | 57.5% | 21.3% | 29.8% | 1.7% | 0.4% |
| 75 to 84 | 58.6% | 19.6% | 29.1% | 1.6% | 0.3% |
| 85 and over | 61.7% | 18.0% | 26.5% | 2.0% | 0.2% |
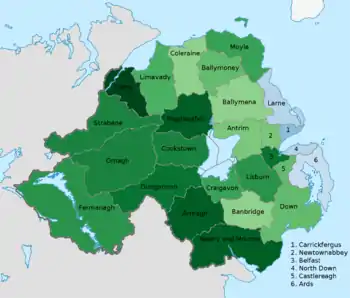
National identity by district[27]
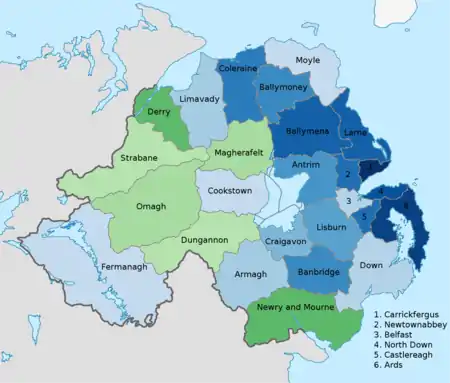
| District | British | Irish | Northern Irish | English, Scottish or Welsh | All Other |
|---|---|---|---|---|---|
| Antrim | 55.2% | 20.1% | 30.4% | 2.3% | 3.9% |
| Ards | 73.6% | 7.5% | 31.9% | 1.9% | 1.5% |
| Armagh | 44.4% | 32.4% | 27.1% | 1.1% | 3.9% |
| Ballymena | 69.0% | 11.1% | 27.9% | 1.4% | 3.8% |
| Ballymoney | 60.6% | 16.4% | 30.9% | 1.7% | 1.7% |
| Banbridge | 61.1% | 16.2% | 31.8% | 1.5% | 1.8% |
| Belfast | 43.2% | 34.8% | 26.8% | 1.5% | 5.1% |
| Carrickfergus | 76.5% | 5.3% | 30.3% | 2.1% | 1.8% |
| Castlereagh | 66.2% | 14.7% | 31.3% | 1.5% | 2.6% |
| Coleraine | 62.4% | 14.5% | 31.6% | 2.0% | 3.2% |
| Cookstown | 37.3% | 33.5% | 32.1% | 1.2% | 3.7% |
| Craigavon | 48.3% | 25.6% | 28.7% | 1.4% | 6.4% |
| Derry | 23.7% | 55.0% | 24.6% | 1.4% | 2.0% |
| Down | 40.2% | 32.2% | 34.1% | 1.9% | 2.0% |
| Dungannon | 30.9% | 38.8% | 27.1% | 0.9% | 9.6% |
| Fermanagh | 37.2% | 36.1% | 29.5% | 1.7% | 3.1% |
| Larne | 69.8% | 10.1% | 31.4% | 2.1% | 1.2% |
| Limavady | 42.2% | 32.0% | 30.7% | 1.5% | 1.4% |
| Lisburn | 55.6% | 24.7% | 28.7% | 2.0% | 2.4% |
| Magherafelt | 31.4% | 42.7% | 29.8% | 1.0% | 2.8% |
| Moyle | 38.6% | 34.1% | 32.1% | 2.2% | 1.4% |
| Newry and Mourne | 20.2% | 53.0% | 27.6% | 1.2% | 4.3% |
| Newtownabbey | 66.5% | 13.4% | 31.2% | 1.3% | 2.4% |
| North Down | 71.1% | 9.1% | 33.0% | 3.0% | 2.4% |
| Omagh | 28.6% | 40.9% | 32.7% | 1.1% | 3.4% |
| Strabane | 33.0% | 39.2% | 31.8% | 1.4% | 1.3% |
National identity by religion or religion brought up in for each district[27]
| District | Catholic | Protestant and other Christian | Other Religion or None | |||||||||
|---|---|---|---|---|---|---|---|---|---|---|---|---|
| British | Irish | Northern Irish | All Other | British | Irish | Northern Irish | All Other | British | Irish | Northern Irish | All Other | |
| Antrim | 23.1% | 43.7% | 34.2% | 7.1% | 80.6% | 3.1% | 27.8% | 3.3% | 60.4% | 6.5% | 26.8% | 19.0% |
| Ards | 34.1% | 31.7% | 38.2% | 6.4% | 80.9% | 3.7% | 30.4% | 2.2% | 67.7% | 6.0% | 35.1% | 9.1% |
| Armagh | 7.1% | 62.5% | 28.7% | 6.2% | 81.6% | 3.6% | 25.7% | 2.3% | 49.3% | 10.5% | 25.1% | 25.3% |
| Ballymena | 24.6% | 38.9% | 34.7% | 11.0% | 83.6% | 2.7% | 25.7% | 2.5% | 62.3% | 6.5% | 28.4% | 14.4% |
| Ballymoney | 19.0% | 44.5% | 38.8% | 4.1% | 81.1% | 2.9% | 27.2% | 2.2% | 65.1% | 8.4% | 28.0% | 13.3% |
| Banbridge | 22.6% | 41.7% | 39.4% | 4.5% | 81.2% | 3.8% | 27.7% | 2.0% | 59.1% | 8.3% | 33.8% | 11.5% |
| Belfast | 11.7% | 64.3% | 25.0% | 5.6% | 78.3% | 5.5% | 28.7% | 3.6% | 47.7% | 13.3% | 27.5% | 26.3% |
| Carrickfergus | 41.1% | 24.6% | 35.6% | 10.7% | 82.0% | 3.0% | 29.2% | 2.4% | 68.3% | 5.3% | 33.7% | 8.5% |
| Castlereagh | 22.1% | 50.0% | 34.5% | 6.3% | 81.3% | 3.9% | 29.9% | 2.3% | 61.9% | 8.9% | 33.7% | 11.8% |
| Coleraine | 25.0% | 39.2% | 36.5% | 8.4% | 79.1% | 4.3% | 29.3% | 2.6% | 56.5% | 10.3% | 33.4% | 16.8% |
| Cookstown | 8.1% | 53.8% | 37.7% | 5.2% | 82.5% | 3.6% | 24.0% | 2.1% | 44.2% | 9.1% | 24.4% | 31.5% |
| Craigavon | 12.2% | 51.2% | 31.5% | 10.6% | 82.5% | 3.2% | 26.3% | 2.7% | 49.9% | 9.1% | 26.7% | 26.4% |
| Derry | 7.3% | 70.5% | 24.3% | 2.5% | 76.7% | 7.2% | 25.9% | 3.5% | 39.4% | 24.7% | 21.9% | 26.2% |
| Down | 20.1% | 47.4% | 37.1% | 2.9% | 77.4% | 5.6% | 28.7% | 3.6% | 52.1% | 14.4% | 32.1% | 16.7% |
| Dungannon | 5.7% | 57.6% | 28.6% | 13.0% | 79.6% | 4.5% | 24.5% | 3.0% | 33.3% | 12.0% | 22.8% | 42.1% |
| Fermanagh | 11.4% | 56.2% | 32.4% | 4.8% | 77.1% | 6.2% | 25.5% | 3.0% | 43.4% | 16.8% | 24.0% | 28.1% |
| Larne | 38.8% | 30.6% | 37.7% | 3.0% | 81.7% | 3.0% | 28.6% | 2.5% | 64.1% | 6.5% | 35.4% | 12.1% |
| Limavady | 18.1% | 50.5% | 34.4% | 2.5% | 79.8% | 4.1% | 24.9% | 2.5% | 51.4% | 10.9% | 28.8% | 18.7% |
| Lisburn | 16.5% | 58.6% | 27.8% | 4.3% | 80.2% | 4.7% | 29.0% | 3.2% | 62.2% | 8.8% | 30.3% | 13.9% |
| Magherafelt | 6.5% | 62.1% | 33.0% | 3.8% | 82.4% | 4.2% | 23.1% | 2.3% | 46.9% | 13.4% | 30.2% | 22.1% |
| Moyle | 14.6% | 53.1% | 35.3% | 2.8% | 76.3% | 5.0% | 27.8% | 3.3% | 49.4% | 17.8% | 23.8% | 19.8% |
| Newry and Mourne | 7.1% | 64.7% | 28.0% | 5.0% | 76.3% | 5.8% | 26.8% | 3.8% | 34.6% | 22.8% | 22.1% | 28.9% |
| Newtownabbey | 24.7% | 46.1% | 34.1% | 5.7% | 80.9% | 3.4% | 30.1% | 1.7% | 63.1% | 7.3% | 32.1% | 12.3% |
| North Down | 37.1% | 31.5% | 36.1% | 9.7% | 78.8% | 5.2% | 31.9% | 3.4% | 63.7% | 7.9% | 35.7% | 11.6% |
| Omagh | 8.7% | 55.7% | 36.0% | 4.4% | 78.5% | 4.9% | 25.0% | 2.5% | 40.6% | 15.9% | 23.7% | 28.9% |
| Strabane | 8.9% | 57.4% | 35.4% | 2.6% | 79.2% | 4.7% | 25.2% | 1.9% | 40.9% | 21.1% | 25.5% | 26.4% |
National identity by place of birth[28]
| Place of birth | British | Irish | Northern Irish | English, Scottish or Welsh | All Other |
|---|---|---|---|---|---|
| Northern Ireland | 49.8% | 28.8% | 31.9% | 0.3% | 0.4% |
| Republic of Ireland | 15.9% | 77.6% | 10.9% | 0.2% | 0.5% |
| Channel Islands and Isle of Man | 58.4% | 19.9% | 12.6% | 2.5% | 17.2% |
| Great Britain | 60.7% | 13.5% | 10.7% | 29.0% | 0.7% |
| England | 64.4% | 14.8% | 11.2% | 22.8% | 0.8% |
| Scotland | 46.6% | 8.7% | 9.0% | 51.3% | 0.4% |
| Wales | 50.2% | 7.5% | 7.8% | 51.4% | 0.7% |
| EU countries excluding the UK and Ireland | 12.4% | 7.4% | 6.4% | 1.1% | 80.4% |
| EU member countries prior to 2004 expansion excluding the UK and Ireland | 35.5% | 10.1% | 12.1% | 2.8% | 52.7% |
| Germany | 62.4% | 8.0% | 17.3% | 5.3% | 21.9% |
| Portugal | 8.2% | 9.6% | 5.2% | 0.6% | 85.8% |
| EU accession countries 2004 onwards | 6.2% | 6.6% | 4.8% | 0.6% | 88.0% |
| Poland | 5.1% | 6.0% | 4.6% | 0.6% | 89.9% |
| Lithuania | 5.2% | 7.7% | 4.5% | 0.5% | 87.7% |
| Slovakia | 6.0% | 5.1% | 4.3% | 0.2% | 89.0% |
| Latvia | 7.8% | 7.7% | 4.9% | 0.7% | 84.9% |
| Romania | 12.3% | 9.1% | 6.8% | 0.5% | 79.5% |
| Other Europe: Non EU countries | 34.2% | 11.3% | 10.5% | 1.7% | 30.3% |
| Africa | 44.6% | 17.1% | 13.6% | 1.9% | 41.7% |
| South Africa | 51.5% | 14.6% | 15.4% | 2.1% | 35.4% |
| Middle East and Asia | 42.3% | 7.4% | 6.4% | 0.9% | 53.6% |
| China | 30.5% | 6.3% | 4.8% | 0.9% | 65.2% |
| Hong Kong | 76.1% | 3.5% | 6.9% | 1.3% | 21.4% |
| India | 38.5% | 5.3% | 4.8% | 0.8% | 57.8% |
| Pakistan | 46.1% | 7.7% | 7.7% | 0.6% | 47.9% |
| Bangladesh | 52.8% | 9.4% | 3.9% | 0.6% | 42.8% |
| Philippines | 46.8% | 5.1% | 4.0% | 0.2% | 56.9% |
| North America and Caribbean | 29.2% | 32.1% | 18.2% | 1.0% | 45.3% |
| United States of America | 18.3% | 39.1% | 17.1% | 0.7% | 52.4% |
| Canada | 46.7% | 21.5% | 20.7% | 1.2% | 34.6% |
| Central America | 35.6% | 11.3% | 16.0% | 2.1% | 62.9% |
| South America | 33.7% | 15.7% | 9.0% | 1.3% | 62.1% |
| Antarctica and Oceania | 36.1% | 23.2% | 18.5% | 1.6% | 42.8% |
| Australia | 36.3% | 26.5% | 20.7% | 0.9% | 38.2% |
| New Zealand | 40.1% | 15.8% | 14.2% | 3.9% | 48.1% |
| All outside Northern Ireland | 37.6% | 24.5% | 9.8% | 12.4% | 27.3% |
| All outside the UK and Ireland | 24.3% | 11.0% | 8.5% | 1.1% | 66.6% |
National identity by ethnic group[29]
| Ethnic group | British | Irish | Northern Irish | English, Scottish or Welsh | All Other |
|---|---|---|---|---|---|
| White: | 48.5% | 28.6% | 29.8% | 1.6% | 2.7% |
| White: Irish Traveller/White Gypsy | 12.2% | 68.0% | 22.3% | 2.8% | 0.3% |
| White: Total | 48.5% | 28.6% | 29.8% | 1.6% | 3.4% |
| Asian or Asian British: Indian | 41.1% | 7.6% | 5.3% | 0.7% | 53.5% |
| Asian or Asian British: Pakistani | 58.9% | 8.5% | 10.7% | 0.9% | 32.0% |
| Asian or Asian British: Bangladeshi | 63.5% | 8.3% | 4.4% | 0.4% | 31.3% |
| Asian or Asian British: Chinese | 52.6% | 7.0% | 7.3% | 1.0% | 41.5% |
| Asian or Asian British: Asian Other | 42.2% | 7.7% | 4.8% | 0.3% | 59.6% |
| Asian or Asian British: Total | 46.8% | 7.5% | 6.1% | 0.7% | 49.3% |
| Black or Black British: Caribbean | 44.4% | 9.9% | 7.8% | 6.7% | 43.5% |
| Black or Black British: African | 25.8% | 15.5% | 7.7% | 1.1% | 69.1% |
| Black or Black British: Other | 29.1% | 20.5% | 12.6% | 2.3% | 54.2% |
| Black or Black British: Total | 28.6% | 16.2% | 8.9% | 2.0% | 62.7% |
| Mixed: Total | 47.3% | 24.6% | 26.6% | 3.0% | 18.7% |
| Other: Any other ethnic group:Total | 29.8% | 22.8% | 13.9% | 3.4% | 48.4% |
Passports held
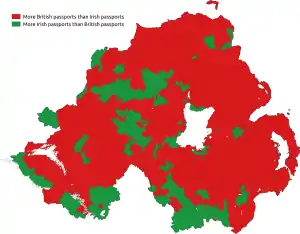
Those born in Northern Ireland have automatic British citizenship on the same basis and with the same provisos as those born elsewhere in the United Kingdom. As well as this, and despite the withdrawal of its constitutional claim to Northern Ireland in 1999, the Irish Government also grants the right to Irish citizenship to those born in Northern Ireland on the same basis and with the same provisos as those born within the Republic of Ireland. This means that most people in Northern Ireland are entitled to a British passport, an Irish passport, or both, as they so choose. By agreement between the Irish Government and Post Office Ltd, post offices in Northern Ireland provide a service whereby customers can apply for an Irish passport, operating alongside their service whereby customers can apply for a British passport. In the 2011 census, respondents stated that they held the following passports.[30][31]
| Passport | All usual residents | Religion or religion brought up in | |||
|---|---|---|---|---|---|
| Catholic | Protestant and other Christian | Other Religions | None | ||
| No passport | 18.9% | 19.2% | 18.5% | 9.9% | 20.2% |
| EU/EEA Countries | 82.1% | 82.4% | 82.4% | 69.3% | 78.4% |
| United Kingdom | 59.1% | 38.4% | 77.8% | 56.0% | 65.2% |
| Republic of Ireland | 20.8% | 40.5% | 4.1% | 10.0% | 7.2% |
| Poland | 1.0% | 2.0% | 0.1% | 0.6% | 0.9% |
| Lithuania | 0.4% | 0.7% | 0.0% | 0.2% | 0.8% |
| Other EU/EEA | 0.8% | 0.9% | 0.4% | 2.4% | 4.2% |
| Other | 1.2% | 0.9% | 0.7% | 26.0% | 3.5% |
| Passport | All usual residents | Religion or religion brought up in | |||
|---|---|---|---|---|---|
| Catholic | Protestant and other Christian | Other Religions | None | ||
| No passport | 18.9% | 19.2% | 18.5% | 9.9% | 20.2% |
| United Kingdom only | 57.2% | 36.1% | 76.3% | 51.6% | 63.3% |
| Republic of Ireland only | 18.9% | 38.1% | 2.7% | 7.4% | 5.9% |
| United Kingdom and ROI only | 1.7% | 2.1% | 1.3% | 1.8% | 1.1% |
| United Kingdom and other (not ROI) | 0.2% | 0.1% | 0.2% | 2.4% | 0.7% |
| ROI and other (not United Kingdom) | 0.1% | 0.2% | 0.0% | 0.6% | 0.2% |
| EU/EEA (not United Kingdom or ROI) | 2.2% | 3.5% | 0.4% | 3.1% | 5.9% |
| Other | 0.8% | 0.6% | 0.4% | 23.0% | 2.7% |
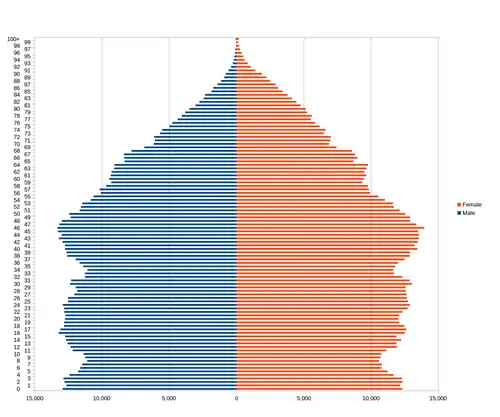
Age
According to the Northern Ireland Statistics and Research Authority the average (median) age increased from 34 years to 37 years between the 2001 and 2011 censuses. Over the same period, the share of the population represented by children aged under 16 years fell from 24 per cent to 21 per cent, while the proportion of people aged 65 years and over rose from 13 per cent to 15 per cent.[32]
| Ages attained (years) |
Population[33] | % of total population |
|---|---|---|
| 0–4 | 124,382 | 6.9 |
| 5–9 | 111,287 | 6.1 |
| 10–14 | 119,034 | 6.6 |
| 15–19 | 126,241 | 7.0 |
| 20–24 | 126,013 | 7.0 |
| 25–29 | 124,099 | 6.9 |
| 30–34 | 119,839 | 6.6 |
| 35–39 | 122,260 | 6.8 |
| 40–44 | 131,848 | 7.3 |
| 45–49 | 131,645 | 7.3 |
| 50–54 | 116,933 | 6.5 |
| 55–59 | 99,272 | 5.5 |
| 60–64 | 94,290 | 5.2 |
| 65–69 | 82,121 | 4.5 |
| 70–74 | 63,479 | 3.5 |
| 75–79 | 50,358 | 2.8 |
| 80–84 | 36,366 | 2.0 |
| 85–89 | 21,165 | 1.2 |
| 90+ | 10,231 | 0.6 |
Summary of vital statistics since 1900
| Average population [34][35][36][37] | Live births | Deaths | Natural change | Crude birth rate (per 1000) | Crude death rate (per 1000) | Natural change (per 1000) | Total fertility rate | |
|---|---|---|---|---|---|---|---|---|
| 1901 | 30,782 | 23,954 | 6,828 | |||||
| 1902 | 30,707 | 23,171 | 7,536 | |||||
| 1903 | 31,290 | 23,096 | 8,194 | |||||
| 1904 | 31,550 | 23,536 | 8,014 | |||||
| 1905 | 31,405 | 22,949 | 8,456 | |||||
| 1906 | 31,389 | 23,039 | 8,350 | |||||
| 1907 | 30,969 | 23,754 | 7,215 | |||||
| 1908 | 30,600 | 23,133 | 7,467 | |||||
| 1909 | 30,640 | 22,275 | 8,365 | |||||
| 1910 | 1,246,000 | 30,219 | 22,576 | 7,643 | 24.3 | 18.1 | 6.1 | |
| 1911 | 1,249,000 | 30,407 | 21,326 | 9,081 | 24.3 | 17.1 | 7.3 | |
| 1912 | 1,248,000 | 30,301 | 21,698 | 8,603 | 24.3 | 17.4 | 6.9 | |
| 1913 | 1,243,000 | 29,880 | 22,510 | 7,370 | 24.0 | 18.1 | 5.9 | |
| 1914 | 1,242,000 | 29,704 | 21,671 | 8,033 | 23.9 | 17.4 | 6.5 | |
| 1915 | 1,210,000 | 28,082 | 22,438 | 5,644 | 23.2 | 18.5 | 4.7 | |
| 1916 | 1,205,000 | 26,623 | 20,764 | 5,859 | 22.1 | 17.2 | 4.9 | |
| 1917 | 1,208,000 | 24,949 | 21,011 | 3,938 | 20.7 | 17.4 | 3.3 | |
| 1918 | 1,214,000 | 26,212 | 25,013 | 1,199 | 21.6 | 20.6 | 1.0 | |
| 1919 | 1,250,000 | 27,496 | 22,836 | 4,660 | 22.0 | 18.2 | 3.8 | |
| 1920 | 1,258,000 | 32,521 | 21,017 | 11,504 | 25.8 | 16.7 | 9.1 | |
| 1921 | 1,264,000 | 29,710 | 19,301 | 10,409 | 23.7 | 15.4 | 8.3 | |
| 1922 | 1,269,000 | 29,531 | 19,795 | 9,736 | 23.2 | 15.6 | 7.6 | |
| 1923 | 1,259,000 | 30,097 | 18,790 | 11,307 | 23.9 | 14.9 | 9.1 | |
| 1924 | 1,258,000 | 28,496 | 20,299 | 8,197 | 22.7 | 16.1 | 6.5 | |
| 1925 | 1,257,000 | 27,686 | 19,784 | 7,902 | 22.0 | 15.8 | 6.3 | |
| 1926 | 1,254,000 | 28,162 | 18,827 | 9,335 | 22.5 | 15.1 | 7.4 | |
| 1927 | 1,250,000 | 26,676 | 18,216 | 8,460 | 21.4 | 14.6 | 6.8 | |
| 1928 | 1,247,000 | 25,963 | 18,004 | 7,959 | 20.9 | 14.4 | 6.4 | |
| 1929 | 1,240,000 | 25,410 | 19,822 | 5,588 | 20.5 | 16.0 | 4.4 | |
| 1930 | 1,237,000 | 25,879 | 17,148 | 8,731 | 20.9 | 13.9 | 7.0 | |
| 1931 | 1,243,000 | 25,673 | 18,049 | 7,624 | 20.7 | 14.5 | 6.2 | |
| 1932 | 1,251,000 | 25,107 | 17,812 | 7,295 | 20.1 | 14.2 | 5.8 | |
| 1933 | 1,258,000 | 24,601 | 18,154 | 6,447 | 19.6 | 14.5 | 5.1 | |
| 1934 | 1,265,000 | 25,365 | 17,521 | 7,844 | 20.1 | 13.9 | 6.2 | |
| 1935 | 1,271,000 | 24,742 | 18,592 | 6,150 | 19.5 | 14.6 | 4.8 | |
| 1936 | 1,276,000 | 25,909 | 18,429 | 7,480 | 20.3 | 14.4 | 5.9 | |
| 1937 | 1,281,000 | 25,412 | 19,282 | 6,130 | 19.8 | 15.1 | 4.8 | |
| 1938 | 1,286,000 | 25,742 | 17,649 | 8,093 | 20.0 | 13.7 | 6.3 | |
| 1939 | 1,295,000 | 25,240 | 17,542 | 7,698 | 19.5 | 13.5 | 5.9 | |
| 1940 | 1,299,000 | 25,363 | 18,941 | 6,422 | 19.5 | 14.6 | 4.9 | |
| 1941 | 1,308,000 | 26,887 | 20,034 | 6,853 | 20.6 | 15.3 | 5.2 | |
| 1942 | 1,329,000 | 29,645 | 17,570 | 12,075 | 22.3 | 13.2 | 9.1 | |
| 1943 | 1,341,000 | 31,521 | 17,720 | 13,801 | 23.5 | 13.2 | 10.3 | |
| 1944 | 1,357,000 | 30,900 | 16,980 | 13,920 | 22.8 | 12.5 | 10.3 | |
| 1945 | 1,359,000 | 29,007 | 16,432 | 12,575 | 21.3 | 12.1 | 9.3 | |
| 1946 | 1,350,000 | 30,134 | 16,706 | 13,428 | 22.3 | 12.4 | 9.9 | |
| 1947 | 1,350,000 | 31,254 | 16,944 | 14,310 | 23.2 | 12.6 | 10.6 | |
| 1948 | 1,362,000 | 29,532 | 15,145 | 14,387 | 21.7 | 11.1 | 10.6 | |
| 1949 | 1,371,000 | 29,106 | 15,670 | 13,436 | 21.2 | 11.4 | 9.8 | |
| 1950 | 1,377,000 | 28,794 | 15,839 | 12,955 | 20.9 | 11.5 | 9.4 | |
| 1951 | 1,373,000 | 28,477 | 17,628 | 10,849 | 20.7 | 12.8 | 7.9 | |
| 1952 | 1,375,000 | 28,760 | 14,812 | 13,948 | 20.9 | 10.8 | 10.1 | |
| 1953 | 1,384,000 | 28,984 | 14,813 | 14,171 | 20.9 | 10.7 | 10.2 | |
| 1954 | 1,387,000 | 28,803 | 15,124 | 13,679 | 20.8 | 10.9 | 9.9 | |
| 1955 | 1,394,000 | 28,965 | 15,407 | 13,558 | 20.8 | 11.1 | 9.7 | |
| 1956 | 1,397,000 | 29,489 | 14,858 | 14,631 | 21.1 | 10.6 | 10.5 | |
| 1957 | 1,399,000 | 30,108 | 15,187 | 14,921 | 21.5 | 10.9 | 10.7 | |
| 1958 | 1,402,000 | 30,301 | 15,132 | 15,169 | 21.6 | 10.8 | 10.8 | |
| 1959 | 1,408,000 | 30,809 | 15,403 | 15,406 | 21.9 | 10.9 | 10.9 | |
| 1960 | 1,420,000 | 31,989 | 15,296 | 16,693 | 22.5 | 10.8 | 11.8 | |
| 1961 | 1,427,000 | 31,915 | 16,108 | 15,807 | 22.4 | 11.3 | 11.1 | |
| 1962 | 1,435,000 | 32,565 | 15,226 | 17,339 | 22.7 | 10.6 | 12.1 | |
| 1963 | 1,446,000 | 33,414 | 15,899 | 17,515 | 23.1 | 11.0 | 12.1 | |
| 1964 | 1,458,000 | 34,345 | 15,354 | 18,991 | 23.6 | 10.5 | 13.0 | |
| 1965 | 1,469,000 | 33,890 | 15,551 | 18,339 | 23.1 | 10.6 | 12.5 | |
| 1966 | 1,478,000 | 33,228 | 16,441 | 16,787 | 22.5 | 11.1 | 11.4 | |
| 1967 | 1,491,000 | 33,415 | 14,671 | 18,744 | 22.4 | 9.8 | 12.6 | |
| 1968 | 1,502,000 | 33,173 | 15,933 | 17,240 | 22.1 | 10.6 | 11.5 | |
| 1969 | 1,513,000 | 32,428 | 16,338 | 16,090 | 21.4 | 10.8 | 10.6 | |
| 1970 | 1,525,000 | 32,086 | 16,551 | 15,535 | 21.0 | 10.9 | 10.2 | |
| 1971 | 1,540,000 | 31,765 | 16,202 | 15,563 | 20.6 | 10.5 | 10.1 | |
| 1972 | 1,539,000 | 29,994 | 17,032 | 12,962 | 19.5 | 11.1 | 8.4 | |
| 1973 | 1,530,000 | 29,200 | 17,669 | 11,531 | 19.1 | 11.5 | 7.5 | |
| 1974 | 1,527,000 | 27,160 | 17,327 | 9,833 | 17.8 | 11.3 | 6.4 | 2.78 |
| 1975 | 1,524,000 | 26,130 | 16,511 | 9,619 | 17.2 | 10.8 | 6.4 | 2.68 |
| 1976 | 1,524,000 | 26,361 | 17,030 | 9,331 | 17.3 | 11.2 | 6.1 | 2.70 |
| 1977 | 1,523,000 | 25,437 | 16,921 | 8,516 | 16.7 | 11.1 | 5.6 | 2.59 |
| 1978 | 1,523,000 | 26,239 | 16,153 | 10,086 | 17.2 | 10.6 | 6.6 | 2.66 |
| 1979 | 1,528,000 | 28,178 | 16,811 | 11,367 | 18.4 | 11.0 | 7.4 | 2.82 |
| 1980 | 1,533,000 | 28,582 | 16,835 | 11,747 | 18.6 | 11.0 | 7.7 | 2.79 |
| 1981 | 1,543,000 | 27,166 | 16,256 | 10,910 | 17.6 | 10.5 | 7.1 | 2.59 |
| 1982 | 1,545,000 | 26,872 | 15,918 | 10,954 | 17.4 | 10.3 | 7.1 | 2.53 |
| 1983 | 1,551,000 | 27,026 | 16,039 | 10,987 | 17.4 | 10.3 | 7.1 | 2.51 |
| 1984 | 1,557,000 | 27,477 | 15,692 | 11,785 | 17.6 | 10.1 | 7.5 | 2.50 |
| 1985 | 1,565,000 | 27,427 | 15,955 | 11,472 | 17.5 | 10.2 | 7.3 | 2.45 |
| 1986 | 1,574,000 | 27,975 | 16,065 | 11,910 | 17.8 | 10.2 | 7.6 | 2.44 |
| 1987 | 1,582,000 | 27,653 | 15,334 | 12,319 | 17.5 | 9.7 | 7.8 | 2.39 |
| 1988 | 1,585,000 | 27,514 | 15,813 | 11,701 | 17.4 | 10.0 | 7.4 | 2.35 |
| 1989 | 1,590,000 | 25,831 | 15,844 | 9,987 | 16.2 | 10.0 | 6.2 | 2.19 |
| 1990 | 1,596,000 | 26,251 | 15,426 | 10,825 | 16.5 | 9.7 | 6.8 | 2.21 |
| 1991 | 1,607,000 | 26,028 | 15,096 | 10,932 | 16.2 | 9.4 | 6.9 | 2.16 |
| 1992 | 1,623,000 | 25,354 | 14,988 | 10,366 | 15.6 | 9.2 | 6.4 | 2.08 |
| 1993 | 1,636,000 | 24,722 | 15,633 | 9,089 | 15.1 | 9.6 | 5.5 | 2.01 |
| 1994 | 1,644,000 | 24,098 | 15,114 | 8,984 | 14.7 | 9.2 | 5.5 | 1.95 |
| 1995 | 1,649,000 | 23,693 | 15,310 | 8,383 | 14.4 | 9.3 | 5.1 | 1.91 |
| 1996 | 1,662,000 | 24,382 | 15,218 | 9,164 | 14.7 | 9.2 | 5.5 | 1.95 |
| 1997 | 1,671,000 | 24,087 | 14,971 | 9,116 | 14.4 | 9.0 | 5.4 | 1.93 |
| 1998 | 1,678,000 | 23,668 | 14,993 | 8,675 | 14.1 | 8.9 | 5.2 | 1.90 |
| 1999 | 1,679,000 | 22,957 | 15,663 | 7,294 | 13.7 | 9.3 | 4.3 | 1.86 |
| 2000 | 1,683,000 | 21,512 | 14,903 | 6,609 | 12.8 | 8.9 | 3.9 | 1.75 |
| 2001 | 1,689,000 | 21,962 | 14,513 | 7,449 | 13.0 | 8.6 | 4.4 | 1.81 |
| 2002 | 1,697,000 | 21,385 | 14,586 | 6,799 | 12.6 | 8.6 | 4.0 | 1.76 |
| 2003 | 1,703,000 | 21,648 | 14,462 | 7,186 | 12.7 | 8.5 | 4.2 | 1.79 |
| 2004 | 1,710,000 | 22,318 | 14,354 | 7,964 | 13.0 | 8.4 | 4.7 | 1.84 |
| 2005 | 1,724,000 | 22,328 | 14,224 | 8,104 | 12.9 | 8.2 | 4.7 | 1.84 |
| 2006 | 1,742,000 | 23,272 | 14,532 | 8,740 | 13.4 | 8.3 | 5.0 | 1.90 |
| 2007 | 1,759,000 | 24,451 | 14,649 | 9,802 | 13.9 | 8.3 | 5.6 | 1.98 |
| 2008 | 1,775,000 | 25,631 | 14,907 | 10,724 | 14.4 | 8.4 | 6.0 | 2.05 |
| 2009 | 1,789,000 | 24,910 | 14,413 | 10,497 | 13.9 | 8.1 | 5.8 | 1.99 |
| 2010 | 1,799,000 | 25,315 | 14,457 | 10,858 | 14.1 | 8.0 | 6.1 | 2.02 |
| 2011 | 1,809,000 | 25,273 | 14,204 | 11,069 | 14.0 | 7.8 | 6.2 | 2.02 |
| 2012 | 1,820,000 | 25,269 | 14,756 | 10,513 | 14.0 | 8.1 | 5.9 | 2.03 |
| 2013 | 1,830,000 | 24,277 | 14,968 | 9,309 | 13.3 | 8.2 | 5.1 | 1.96 |
| 2014 | 1,840,000 | 24,394 | 14,678 | 9,716 | 13.3 | 8.0 | 5.3 | 1.96 |
| 2015 | 1,851,000 | 24,215 | 15,553 | 8,662 | 13.1 | 8.4 | 4.7 | 1.95 |
| 2016 | 1,862,000 | 24,076 | 15,430 | 8,646 | 12.9 | 8.3 | 4.6 | 1.95 |
| 2017 | 1,871,000 | 23,075 | 16,036 | 7,039 | 12.3 | 8.6 | 3.7 | 1.87 |
| 2018 | 1,882,000 | 22,829 | 15,923 | 6,906 | 12.1 | 8.5 | 3.6 | 1.85 |
| 2019 | 1,893,700 | 22,466 | 15,758 | 6,708 | 11.8 | 8.3 | 3.5 | 1.82 |
| 2020 | 1,900,200 | 20,815 | 17,613 | 3,202 | 11.0 | 9.3 | 1.7 |
Current vital statistics
- Births from January-November 2019 =
 21,008
 - Births from January-November 2020 = 19,286 ***
- Deaths from January-November 2019 =
 14,339
 - Deaths from January-November 2020 =
 15,958
- Natural population growth from January-November 2019 = 6,669
- Natural population growth from January-November 2020 = 3,328
* * * During the months from March to June 2020 the registration of births was affected by the ongoing coronavirus pandemic.
Other statistics
Life expectancy at birth:[40]
Men: 77.2 years
Women: 80.8 years
Infant mortality rate:[40]
6.4 deaths/1,000 live births (1999)
Total Period Fertility Rate (TPFR):[41]
2.06 children born/woman (2011)
HIV/AIDS prevalence rate:[42]
0.024% (2005 est.)
People living with HIV/AIDS:[42]
408 (2005)
See also
References
- Population at Census Day 2011: Usually resident population by single year of age and sex -Table 1 NISRA September 2012 Archived 4 March 2016 at the Wayback Machine, Accessed 16 August 2013
- Country Profiles: Key Statistics - Northern Ireland, August 2012, Accessed 5 February 2014
- https://www.ons.gov.uk/census/2011census
- "NISRA: Historic Population Trends" (PDF). Retrieved 22 July 2014.
- "NISRA: Population Clock". Retrieved 7 March 2019.
- "NI migrant population triples in decade, says study". BBC News. 26 June 2014.
- "Northern Ireland Neighbourhood Information Service" (XLS). Ninis2.nisra.gov.uk. Retrieved 22 July 2014.
- "Northern Ireland Neighbourhood Information Service". Archived from the original on 4 March 2016. Retrieved 22 July 2014.
- "Northern Ireland Neighbourhood Information Service". Retrieved 22 July 2014.
- "Table 1.3: Overseas-born population in the United Kingdom, excluding some residents in communal establishments, by sex, by country of birth, January 2014 to December 2014". Office for National Statistics. 27 August 2015. Retrieved 17 April 2016. Figures given are the central estimates. See the source for 95 per cent confidence intervals.
- "Northern Ireland Neighbourhood Information Service". Retrieved 22 July 2014.
- "Northern Ireland Neighbourhood Information Service". Retrieved 22 July 2014.
- "Northern Ireland Neighbourhood Information Service". Retrieved 22 July 2014.
- "Northern Ireland Neighbourhood Information Service". Retrieved 22 July 2014.
- "Northern Ireland Neighbourhood Information Service". Retrieved 22 July 2014.
- "Northern Ireland Neighbourhood Information Service". Retrieved 22 July 2014.
- "Northern Ireland Neighbourhood Information Service". Retrieved 22 July 2014.
- "Northern Ireland Neighbourhood Information Service". Retrieved 22 July 2014.
- "Northern Ireland Neighbourhood Information Service". Retrieved 22 July 2014.
- "Northern Ireland Neighbourhood Information Service". Retrieved 22 July 2014.
- "Northern Ireland Neighbourhood Information Service". Retrieved 22 July 2014.
- "Northern Ireland Neighbourhood Information Service". Retrieved 22 July 2014.
- "CAIN Web Service". Retrieved 22 July 2014.
- "Northern Ireland Neighbourhood Information Service". Retrieved 22 July 2014.
- "Northern Ireland Neighbourhood Information Service". Retrieved 22 July 2014.
- "Northern Ireland Neighbourhood Information Service". Retrieved 22 July 2014.
- "Northern Ireland Neighbourhood Information Service". Retrieved 22 July 2014.
- "Northern Ireland Neighbourhood Information Service". Retrieved 22 July 2014.
- "Northern Ireland Neighbourhood Information Service". Retrieved 22 July 2014.
- "Northern Ireland Neighbourhood Information Service". Retrieved 22 July 2014.
- "Northern Ireland Neighbourhood Information Service". Retrieved 22 July 2014.
- Census 2011: Key Statistics for Northern Ireland Statistics Bulletin December 2012, Accessed 22 December 2012
- "ONS: 2011 Census: Usual resident population by five-year age group and sex, United Kingdom and constituent countries". Retrieved 22 July 2014.
- B.R. Mitchell. European historical statistics, 1750–1975
- "United Nations. Demographic Yearbook 1948" (PDF). Unstats.un.org. Retrieved 3 October 2017.
- "Northern Ireland Statistics & Research Agency". Nisra.gov.uk. Retrieved 3 October 2017.
- "Population and vital events, 1926-2014" (PDF). Nisra.gov.uk. Retrieved 3 October 2017.
- "Births". NISRA. Retrieved 20 December 2020.
- "Deaths". NISRA. Retrieved 11 December 2020.
- "publichealthmatters.org". Publichealthmatters.org. Retrieved 3 October 2017.
- "Archived copy". Archived from the original on 29 August 2014. Retrieved 20 February 2011.CS1 maint: archived copy as title (link)
- "Sexually Transmitted Infections" (PDF). Health Promotion Agency. January 2007. Archived from the original (PDF) on 11 January 2012.
Further reading
- Anderson, James; Shuttleworth, Ian (1998). "Sectarian demography, territoriality and political development in Northern Ireland". Political Geography. 17 (2): 187–208. doi:10.1016/S0962-6298(97)00035-8. ISSN 0962-6298.
- Cooley, Laurence (2020). "Census politics in Northern Ireland from the Good Friday Agreement to Brexit: Beyond the 'sectarian headcount'?". The British Journal of Politics and International Relations: 136914812095904. doi:10.1177/1369148120959045. ISSN 1369-1481.
- Kaufmann, Eric (2011). "Demographic Change and Conflict in Northern Ireland: Reconciling Qualitative and Quantitative Evidence". Ethnopolitics. 10 (3–4): 369–389. doi:10.1080/17449057.2011.596117. ISSN 1744-9057.