Demographics of Iceland
This article is about the demographic features of the population of Iceland, including population density, ethnicity, education level, health of the populace, economic status, religious affiliations and other aspects of the population.
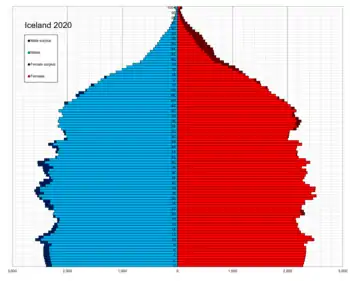
As of 2020, the Icelandic population stands at a little over 360,000. 91.1% of the residents of Iceland are Icelandic citizens and 15.7% are foreign-born.[1][2]
99% of the nation's inhabitants live in urban areas (localities with populations greater than 200) and 60% live in the Capital Region.
History
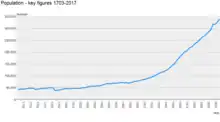
The population of Iceland since settlement times has probably wavered between about 30,000 and 80,000. Official statistics begin in 1703, since when the population of Iceland has grown from 50,358 to 364,134 in January 2020.[3]
Settlement
Most Icelandic people are descendants of Norwegian settlers, and of Gaels from Ireland and Scotland who were brought over as slaves during the Settlement of Iceland in the ninth century CE. Recent DNA analysis suggests that around 66 percent of the male settler-era population was of Norse ancestry, whereas the female population was 60 percent Celtic.[4][5] Iceland remained extremely homogenous from Settlement until the twentieth century.
Emigration
Large numbers of Icelanders began to emigrate from Iceland in the 1850s. It has been estimated that around 17,000 Icelanders emigrated to North America in the period 1870–1914, with some 2,000 people returning to Iceland. A net total of around 15,000 individuals amount to roughly 20% of the Icelandic population in 1887.[6] According to historian Gunnar Karlsson, "migration from Iceland is unique in that most went to Canada, whereas from most or all other European countries the majority went to the United States. This was partly due to the late beginning of emigration from Iceland after the Canadian authorities had begun to promote emigration in cooperation with the Allan Line, which already had an agent in Iceland in 1873. Contrary to most European countries, this promotion campaign was successful in Iceland, because emigration was only just about to start from there and Icelandic emigrants had no relatives in the United States to help them take the first steps".[6]
In the wake of the 2008 Icelandic financial crisis, many Icelanders went to work abroad.[7]
Immigration
There was little immigration to Iceland prior to the 1990s, and during that period was mostly from other Scandinavian countries: around 1% of the population of Iceland in 1900 was of Danish heritage (either born in Denmark or to Danish parents).[8] In the mid-1990s, 95% of Icelanders had parents of Icelandic origin, and 2% of Icelandic inhabitants were first-generation immigrants (born abroad with both parents foreign-born and all grandparents foreign-born).[9][10]
Immigration to Iceland rose rapidly in the late twentieth century, encouraged by Iceland's accession to the European Economic Area in 1994, its entry into the Schengen Agreement in 2001, and the country's early twenty-first century economic boom. Iceland's largest ethnic minority comprises Polish immigrants in Iceland. Immigration has also brought significant new ethno-religious groups such as Jewish people, and new minority religions, including Islam. In 2017, 10.6% of the population were first-generation immigrants.[10]
Research on the experience of immigrants to Iceland is in its early days.[11][12] There is some evidence that racism is not as acute in Iceland as in neighbouring countries.[13][14][15] But, while it is popularly believed in Iceland that racism does not exist there,[16] there is evidence that in some respects immigrant populations experience prejudice and inequalities.[17] For example, Iceland has a higher dropout rate from upper secondary school among young immigrants than the EEA average.[18]
| Country | 2010 | 2019 |
|---|---|---|
| 10,088 | 19,210 | |
| 3,236 | 3,891 | |
| 1,442 | 2,906 | |
| 1,849 | 2,386 | |
| 1,846 | 2,161 | |
| 1,407 | 2,094 | |
| 1,697 | 1,969 | |
| 641 | 1,762 | |
| 1,095 | 1,702 | |
| 205 | 1,536 | |
| 1,062 | 1,375 | |
| 987 | 1,275 | |
| 607 | 993 | |
| 288 | 909 | |
| 479 | 840 | |
| 444 | 835 | |
| 152 | 744 | |
| 481 | 686 | |
| 148 | 657 | |
| 217 | 482 | |
| 228 | 475 | |
| 135 | 473 | |
| 312 | 468 | |
| 153 | 464 | |
| 294 | 452 | |
| 206 | 402 | |
| 298 | 375 | |
| 274 | 357 | |
| 229 | 337 | |
| Other | 4,284 | 9,185 |
| Total immigrant population | 35,117 | 61,401 |
Due to a shortage of labor,[19] immigration to Iceland will most likely increase in the future.[20] Estimates show that the number of immigrants could be as high as 15% of the total population by 2030.[20]
Patronymy
Most Icelandic surnames are based on patronymy, or the adoption of the father's first given name, followed by "son" or "daughter". For example, Magnús and Anna, children of a man named Pétur Jónsson, would have the full name Magnús Pétursson and Anna Pétursdóttir, respectively. Magnús's daughter Sigríður Ásta would be Sigríður Ásta Magnúsdóttir, and would remain so for the rest of her life regardless of marriage. An Icelandic patronymic is essentially only a designation of fatherhood, and is therefore redundant in Icelandic social life except to differentiate people of the same first name – the phone directory, for example, lists people by their given name first, patronymic second. Thus it has little in common with traditional surnames except for its position after the given name. It is legally possible in Iceland to rework the patronymic into a matronymic, replacing the father's name with the mother's. Use of the patronymic system is required by law, except for the descendants of those who had acquired family names before 1913 (about 10% of the population). One notable Icelander who has an inherited family name is football star Eiður Smári Guðjohnsen.
Urbanisation
According to University of Iceland economists Davíd F. Björnsson and Gylfi Zoega, "The policies of the colonial masters in Copenhagen delayed urbanisation. The Danish king maintained a monopoly in trade with Iceland from 1602 until 1855, which made the price of fish artificially low – the price of fish was higher in Britain – and artificially raised the price of agricultural products. Instead, Denmark bought the fish caught from Iceland at below world market prices. Although the trade monopoly ended in 1787, Icelanders could not trade freely with other countries until 1855. Following trade liberalisation, there was a substantial increase in fish exports to Britain, which led to an increase in the number of sailing ships used in fishing, introduced for the first time in 1780. The growth of the fishing industry then created demand for capital, and in 1885 Parliament created the first state bank (Landsbanki). In 1905 came the first motorised fishing vessel, which marked an important step in the development of a specialised fishing industry in Iceland. Iceland exported fresh fish to Britain and salted cod to southern Europe, with Portugal an important export market. Fishing replaced agriculture as the country’s main industry. These developments set the stage for the urbanisation that was to follow in the twentieth century."[21]
A 2017 study looking at individuals going to the capital area for higher education found that "Only about one in three [University of Iceland] students from regions beyond commuting distance return after graduation, while about half remain in the capital area and others mostly emigrate."[22]
Religion
In 2016, 71.6% of the population belonged to the state church (the Evangelical Lutheran Church of Iceland), approximately 5% in free churches, 3.7% to the Roman Catholic Church, approximately 1% to the Ásatrúarfélagið (a legally recognized revival of the pre-Christian religion of Iceland), approximately 1% to Zuism, 8% in unrecognized or unspecified religious groups, and 19% do not belong to any religious group.[23]
Icelandic National Registry
All living Icelanders, as well as all foreign citizens with permanent residence in Iceland, have a personal identification number (kennitala) identifying them in the National Registry. This number is composed of 10 digits, whereof the first six are made up of the individual's birth date in the format DDMMYY. The next two digits are chosen at random when the kennitala is allocated, the 9th digit is a check digit, and the last digit indicates the period of one hundred years in which the individual was born (for instance, '9' for the period 1900–1999). An example would be 120192-3389. While similar, all-inclusive personal registries exist in other countries, the use of the national registry is unusually extensive in Iceland. It is worth noting that the completeness of the National Registry eliminates any need for census to be performed.
Summary of vital statistics since 1900
Data according to Statistics Iceland, which collects the official statistics for Iceland.[24]
| Year | Average population |
Live births |
Deaths | Natural change |
Crude birth rate (per 1000) |
Crude death rate (per 1000) |
Natural change (per 1000) |
Total fertility rate |
|---|---|---|---|---|---|---|---|---|
| 1900 | 78,000 | 2,237 | 1,545 | 692 | 28.6 | 19.8 | 8.9 | 3.93 |
| 1901 | 78,000 | 2,179 | 1,155 | 1,024 | 27.8 | 14.7 | 13.1 | 3.86 |
| 1902 | 79,000 | 2,220 | 1,262 | 958 | 28.1 | 16.0 | 12.1 | 3.95 |
| 1903 | 79,000 | 2,244 | 1,324 | 920 | 28.3 | 16.7 | 11.6 | 4.00 |
| 1904 | 80,000 | 2,293 | 1,242 | 1,051 | 28.7 | 15.5 | 13.1 | 4.09 |
| 1905 | 81,000 | 2,271 | 1,435 | 836 | 28.1 | 17.8 | 10.4 | 4.02 |
| 1906 | 82,000 | 2,346 | 1,193 | 1,153 | 28.8 | 14.6 | 14.1 | 4.14 |
| 1907 | 83,000 | 2,304 | 1,396 | 908 | 27.9 | 16.9 | 11.0 | 4.04 |
| 1908 | 83,000 | 2,270 | 1,594 | 676 | 27.3 | 19.1 | 8.1 | 4.01 |
| 1909 | 84,000 | 2,283 | 1,263 | 1,020 | 27.2 | 15.0 | 12.1 | 4.00 |
| 1910 | 85,000 | 2,171 | 1,304 | 867 | 25.6 | 15.4 | 10.2 | 3.79 |
| 1911 | 85,000 | 2,205 | 1,152 | 1,053 | 25.8 | 13.5 | 12.3 | 3.80 |
| 1912 | 86,000 | 2,234 | 1,171 | 1,063 | 26.0 | 13.6 | 12.4 | 3.82 |
| 1913 | 87,000 | 2,216 | 1,060 | 1,156 | 25.6 | 12.2 | 13.3 | 3.76 |
| 1914 | 88,000 | 2,338 | 1,428 | 910 | 26.7 | 16.3 | 10.4 | 3.90 |
| 1915 | 89,000 | 2,446 | 1,376 | 1,070 | 27.6 | 15.5 | 12.1 | 4.00 |
| 1916 | 89,000 | 2,377 | 1,322 | 1,055 | 26.6 | 14.8 | 11.8 | 3.81 |
| 1917 | 91,000 | 2,427 | 1,111 | 1,316 | 26.8 | 12.3 | 14.5 | 3.82 |
| 1918 | 92,000 | 2,441 | 1,518 | 923 | 26.6 | 16.6 | 10.1 | 3.78 |
| 1919 | 92,000 | 2,342 | 1,169 | 1,173 | 25.4 | 12.7 | 12.7 | 3.62 |
| 1920 | 94,000 | 2,627 | 1,360 | 1,267 | 28.1 | 14.5 | 13.5 | 3.96 |
| 1921 | 95,000 | 2,601 | 1,478 | 1,123 | 27.4 | 15.6 | 11.8 | 3.87 |
| 1922 | 96,000 | 2,546 | 1,280 | 1,266 | 26.6 | 13.4 | 13.2 | 3.72 |
| 1923 | 97,000 | 2,612 | 1,287 | 1,325 | 26.9 | 13.3 | 13.7 | 3.77 |
| 1924 | 98,000 | 2,525 | 1,462 | 1,063 | 25.7 | 14.9 | 10.8 | 3.62 |
| 1925 | 99,000 | 2,554 | 1,229 | 1,325 | 25.7 | 12.4 | 13.3 | 3.59 |
| 1926 | 101,000 | 2,676 | 1,121 | 1,555 | 26.5 | 11.1 | 15.4 | 3.71 |
| 1927 | 103,000 | 2,642 | 1,282 | 1,360 | 25.8 | 12.5 | 13.3 | 3.59 |
| 1928 | 104,000 | 2,542 | 1,124 | 1,418 | 24.4 | 10.8 | 13.6 | 3.40 |
| 1929 | 106,000 | 2,644 | 1,237 | 1,407 | 25.0 | 11.7 | 13.3 | 3.47 |
| 1930 | 107,000 | 2,808 | 1,248 | 1,560 | 26.1 | 11.6 | 14.5 | 3.59 |
| 1931 | 109,000 | 2,804 | 1,277 | 1,527 | 25.7 | 11.7 | 14.0 | 3.53 |
| 1932 | 111,000 | 2,696 | 1,191 | 1,505 | 24.4 | 10.8 | 13.6 | 3.31 |
| 1933 | 112,000 | 2,531 | 1,159 | 1,372 | 22.5 | 10.3 | 12.2 | 3.07 |
| 1934 | 114,000 | 2,597 | 1,181 | 1,416 | 22.8 | 10.4 | 12.4 | 3.10 |
| 1935 | 115,000 | 2,551 | 1,402 | 1,149 | 22.1 | 12.2 | 10.0 | 2.99 |
| 1936 | 116,000 | 2,557 | 1,253 | 1,304 | 22.0 | 10.8 | 11.2 | 2.98 |
| 1937 | 117,000 | 2,397 | 1,317 | 1,080 | 20.4 | 11.2 | 9.2 | 2.78 |
| 1938 | 118,000 | 2,374 | 1,207 | 1,167 | 20.1 | 10.2 | 9.9 | 2.71 |
| 1939 | 120,000 | 2,363 | 1,160 | 1,203 | 19.8 | 9.7 | 10.1 | 2.68 |
| 1940 | 121,000 | 2,480 | 1,200 | 1,280 | 20.5 | 9.9 | 10.6 | 2.75 |
| 1941 | 122,000 | 2,634 | 1,352 | 1,282 | 21.6 | 11.1 | 10.5 | 2.91 |
| 1942 | 123,000 | 3,005 | 1,293 | 1,712 | 24.4 | 10.5 | 13.9 | 3.26 |
| 1943 | 125,000 | 3,173 | 1,268 | 1,905 | 25.4 | 10.1 | 15.2 | 3.36 |
| 1944 | 127,000 | 3,213 | 1,218 | 1,995 | 25.3 | 9.6 | 15.7 | 3.34 |
| 1945 | 129,000 | 3,434 | 1,179 | 2,255 | 26.6 | 9.1 | 17.5 | 3.55 |
| 1946 | 132,000 | 3,434 | 1,121 | 2,313 | 26.1 | 8.5 | 17.6 | 3.47 |
| 1947 | 134,000 | 3,706 | 1,162 | 2,544 | 27.6 | 8.6 | 18.9 | 3.67 |
| 1948 | 137,000 | 3,821 | 1,114 | 2,707 | 27.8 | 8.1 | 19.7 | 3.72 |
| 1949 | 140,000 | 3,884 | 1,106 | 2,778 | 27.8 | 7.9 | 19.9 | 3.73 |
| 1950 | 143,000 | 4,093 | 1,122 | 2,971 | 28.7 | 7.9 | 20.8 | 3.86 |
| 1951 | 145,000 | 3,999 | 1,145 | 2,854 | 27.5 | 7.9 | 19.6 | 3.72 |
| 1952 | 148,000 | 4,075 | 1,082 | 2,993 | 27.5 | 7.3 | 20.2 | 3.79 |
| 1953 | 151,000 | 4,254 | 1,118 | 3,136 | 28.1 | 7.4 | 20.7 | 3.94 |
| 1954 | 154,000 | 4,281 | 1,064 | 3,217 | 27.7 | 6.9 | 20.8 | 3.91 |
| 1955 | 158,000 | 4,505 | 1,099 | 3,406 | 28.5 | 7.0 | 21.5 | 4.07 |
| 1956 | 161,000 | 4,603 | 1,153 | 3,450 | 28.5 | 7.1 | 21.4 | 4.14 |
| 1957 | 165,000 | 4,725 | 1,157 | 3,568 | 28.6 | 7.0 | 21.6 | 4.20 |
| 1958 | 168,000 | 4,641 | 1,165 | 3,476 | 27.5 | 6.9 | 20.6 | 4.09 |
| 1959 | 172,000 | 4,837 | 1,242 | 3,595 | 28.1 | 7.2 | 20.9 | 4.24 |
| 1960 | 176,000 | 4,916 | 1,167 | 3,749 | 28.0 | 6.6 | 21.4 | 4.27 |
| 1961 | 179,000 | 4,563 | 1,248 | 3,315 | 25.5 | 7.0 | 18.5 | 3.88 |
| 1962 | 182,000 | 4,711 | 1,237 | 3,474 | 25.9 | 6.8 | 19.1 | 3.98 |
| 1963 | 186,000 | 4,820 | 1,327 | 3,493 | 26.0 | 7.2 | 18.8 | 3.98 |
| 1964 | 189,000 | 4,787 | 1,315 | 3,472 | 25.3 | 7.0 | 18.3 | 3.86 |
| 1965 | 192,000 | 4,721 | 1,291 | 3,430 | 24.6 | 6.7 | 17.9 | 3.71 |
| 1966 | 196,000 | 4,692 | 1,391 | 3,301 | 24.0 | 7.1 | 16.9 | 3.58 |
| 1967 | 199,000 | 4,404 | 1,385 | 3,019 | 22.2 | 7.0 | 15.2 | 3.28 |
| 1968 | 201,000 | 4,227 | 1,390 | 2,837 | 21.0 | 6.9 | 14.1 | 3.07 |
| 1969 | 203,000 | 4,218 | 1,451 | 2,767 | 20.8 | 7.2 | 13.6 | 2.99 |
| 1970 | 204,000 | 4,023 | 1,457 | 2,566 | 19.7 | 7.1 | 12.6 | 2.81 |
| 1971 | 206,000 | 4,277 | 1,501 | 2,776 | 20.8 | 7.3 | 13.5 | 2.92 |
| 1972 | 209,000 | 4,676 | 1,447 | 3,229 | 22.3 | 6.9 | 15.4 | 3.09 |
| 1973 | 212,000 | 4,598 | 1,475 | 3,123 | 21.7 | 6.9 | 14.8 | 2.95 |
| 1974 | 215,000 | 4,276 | 1,495 | 2,781 | 19.9 | 6.9 | 13.0 | 2.66 |
| 1975 | 218,000 | 4,384 | 1,412 | 2,972 | 20.1 | 6.5 | 13.6 | 2.65 |
| 1976 | 220,000 | 4,291 | 1,343 | 2,948 | 19.5 | 6.1 | 13.4 | 2.52 |
| 1977 | 222,000 | 3,996 | 1,435 | 2,561 | 18.0 | 6.5 | 11.5 | 2.31 |
| 1978 | 224,000 | 4,162 | 1,421 | 2,741 | 18.6 | 6.4 | 12.2 | 2.35 |
| 1979 | 226,000 | 4,475 | 1,482 | 2,993 | 19.8 | 6.6 | 13.2 | 2.49 |
| 1980 | 228,000 | 4,528 | 1,538 | 2,990 | 19.8 | 6.7 | 13.1 | 2.48 |
| 1981 | 231,000 | 4,345 | 1,656 | 2,689 | 18.8 | 7.2 | 11.6 | 2.33 |
| 1982 | 234,000 | 4,337 | 1,583 | 2,754 | 18.5 | 6.8 | 11.7 | 2.26 |
| 1983 | 237,000 | 4,371 | 1,653 | 2,718 | 18.4 | 7.0 | 11.4 | 2.24 |
| 1984 | 240,000 | 4,113 | 1,584 | 2,529 | 17.2 | 6.6 | 10.6 | 2.08 |
| 1985 | 241,000 | 3,856 | 1,652 | 2,204 | 16.0 | 6.8 | 9.2 | 1.93 |
| 1986 | 243,000 | 3,881 | 1,598 | 2,283 | 16.0 | 6.6 | 9.4 | 1.93 |
| 1987 | 246,000 | 4,193 | 1,724 | 2,469 | 17.0 | 7.0 | 10.0 | 2.07 |
| 1988 | 250,000 | 4,673 | 1,818 | 2,855 | 18.7 | 7.3 | 11.4 | 2.27 |
| 1989 | 253,000 | 4,560 | 1,716 | 2,844 | 18.0 | 6.8 | 11.2 | 2.20 |
| 1990 | 255,000 | 4,768 | 1,704 | 3,064 | 18.7 | 6.7 | 12.0 | 2.31 |
| 1991 | 258,000 | 4,533 | 1,796 | 2,737 | 17.6 | 7.0 | 10.6 | 2.19 |
| 1992 | 261,000 | 4,609 | 1,719 | 2,890 | 17.7 | 6.6 | 11.1 | 2.21 |
| 1993 | 264,000 | 4,623 | 1,753 | 2,870 | 17.5 | 6.6 | 10.9 | 2.22 |
| 1994 | 266,000 | 4,442 | 1,717 | 2,725 | 16.7 | 6.4 | 10.3 | 2.14 |
| 1995 | 267,000 | 4,280 | 1,923 | 2,357 | 16.0 | 7.2 | 8.8 | 2.08 |
| 1996 | 269,000 | 4,329 | 1,879 | 2,450 | 16.1 | 7.0 | 9.1 | 2.12 |
| 1997 | 271,000 | 4,151 | 1,843 | 2,308 | 15.3 | 6.8 | 8.5 | 2.04 |
| 1998 | 274,000 | 4,178 | 1,821 | 2,357 | 15.2 | 6.7 | 8.5 | 2.05 |
| 1999 | 277,000 | 4,100 | 1,901 | 2,199 | 14.8 | 6.9 | 7.9 | 1.99 |
| 2000 | 281,000 | 4,315 | 1,828 | 2,492 | 15.3 | 6.5 | 8.8 | 2.08 |
| 2001 | 285,000 | 4,091 | 1,725 | 2,366 | 14.4 | 6.1 | 8.3 | 1.95 |
| 2002 | 288,000 | 4,049 | 1,822 | 2,227 | 14.1 | 6.3 | 7.8 | 1.93 |
| 2003 | 290,000 | 4,143 | 1,826 | 2,317 | 14.3 | 6.3 | 8.0 | 1.99 |
| 2004 | 292,000 | 4,234 | 1,824 | 2,410 | 14.5 | 6.2 | 8.3 | 2.03 |
| 2005 | 297,000 | 4,280 | 1,837 | 2,443 | 14.4 | 6.2 | 8.2 | 2.05 |
| 2006 | 304,000 | 4,415 | 1,903 | 2,512 | 14.5 | 6.3 | 8.2 | 2.07 |
| 2007 | 308,000 | 4,560 | 1,943 | 2,617 | 14.6 | 6.2 | 8.4 | 2.09 |
| 2008 | 315,000 | 4,835 | 1,987 | 2,244 | 14.2 | 6.2 | 8.0 | 2.14 |
| 2009 | 318,000 | 5,026 | 2,002 | 3,024 | 15.7 | 6.3 | 9.4 | 2.22 |
| 2010 | 318,000 | 4,907 | 2,020 | 2,887 | 15.5 | 6.4 | 9.1 | 2.20 |
| 2011 | 319,000 | 4,492 | 1,986 | 2,511 | 14.1 | 6.2 | 7.9 | 2.02 |
| 2012 | 320,000 | 4,533 | 1,955 | 2,573 | 14.2 | 6.1 | 8.1 | 2.04 |
| 2013 | 322,000 | 4,326 | 2,154 | 2,172 | 13.4 | 6.7 | 6.7 | 1.93 |
| 2014 | 326,000 | 4,375 | 2,049 | 2,326 | 13.5 | 6.3 | 7.2 | 1.93 |
| 2015 | 329,000 | 4,129 | 2,178 | 1,951 | 12.6 | 6.6 | 6.0 | 1.81 |
| 2016 | 333,000 | 4,034 | 2,309 | 1,676 | 12.1 | 6.9 | 5.2 | 1.75 |
| 2017 | 338,000 | 4,071 | 2,239 | 1,832 | 12.0 | 6.5 | 5.5 | 1.71 |
| 2018 | 348,000 | 4,228 | 2,254 | 1,990 | 12.1 | 6.4 | 5.7 | 1.707 |
| 2019 | 357,000 | 4,452 | 2,275 | 2,177 | 12.4 | 6.3 | 6.1 | 1.745 |
| 2020 | 364,000 | 4,530 | 2,320 | 2,210 | 12.5 | 6.4 | 6.1 | |
Current natural increase
- Births from January–September 2019 =
 3,310
3,310 - Births from January–September 2020 = 3,450
- Deaths from January–September 2019 =
 1,630
1,630 - Deaths from January–September 2020 =
 1,690
1,690
- Natural increase from January–September 2019 = 1,680
- Natural increase from January–September 2020 = 1,760
Population projection
| Year | Low | Medium | High |
|---|---|---|---|
| 2014 | 325,671 | ||
| 2015 | 332,529 | ||
| 2020 | 340,418 | 342,716 | 346,279 |
| 2025 | 352,280 | 357,894 | 365,893 |
| 2030 | 361,853 | 371,796 | 385,405 |
| 2035 | 369,888 | 384,397 | 404,053 |
| 2040 | 376,580 | 395,866 | 422,047 |
| 2045 | 381,846 | 406,271 | 439,756 |
| 2050 | 385,536 | 415,627 | 457,317 |
| 2055 | 387,489 | 423,790 | 474,561 |
| 2060 | 387,597 | 430,545 | 490,976 |
Life expectancy
| Period | Life expectancy in Years |
Period | Life expectancy in Years |
|---|---|---|---|
| 1950–1955 | 72.2 | 1985–1990 | 77.6 |
| 1955–1960 | 73.2 | 1990–1995 | 78.5 |
| 1960–1965 | 73.5 | 1995–2000 | 79.1 |
| 1965–1970 | 73.7 | 2000–2005 | 80.7 |
| 1970–1975 | 74.2 | 2005–2010 | 81.4 |
| 1975–1980 | 76.3 | 2010–2015 | 82.2 |
| 1980–1985 | 76.9 |
Source: UN World Population Prospects[27]
CIA World Factbook demographic statistics
The following demographic statistics are from the CIA World Factbook, unless otherwise indicated.
- Age structure
0–14 years:
20.4% (male 35,418/female 33,887)
15–24 years:
13.5% (male 23,190/female 22,659)
25–54 years:
39.88% (male 68,579/female 66,899)
55–64:
11.81% (male 20,119/female 20,007)
65 years and over:
14.42% (male 22,963/female 26,053) (2017 est.)
- Sex ratio
at birth:
1.05 males: 1 female
under 15 years:
1.05 males: 1 female
15–24 years: 1.03 males: 1 female
25–54 years:
1.02 males: 1 female
55–64 years:
1.01 males: 1 female
65 years and over:
0.88 males: 1 female
total population:
1.01 male: 1 female
(2016 est.)
- Maternal mortality rate
3 deaths/100,000 live births (2015 est.)
- Infant mortality rate
2.1 deaths/1,000 live births (2016 est.)
- Life expectancy at birth
total population:
83.0 years
male:
80.9 years
female:
85.3 years
(2016 est.)
- Health expenditures
8.9% of GDP (2014)
- Physicians density
3.79 physicians/1,000 population (2015)
- Obesity – adult prevalence rate
23.9% (2014)
- Education expenditures
7.8% of GDP (2013)
- Mother's mean age at first birth
27.4 (2015 est.)

- Nationality
noun:
Icelander(s)
adjective:
Icelandic
- Ethnic groups
94% Icelandic, 6% other
- Religions
Evangelical Lutheran Church of Iceland (official) 69.9%, Roman Catholic 3.8%, Reykjavik Free Church 2.9%, Hafnarfjörður Free Church 2%, Ásatrú Association 1.1%, The Independent Congregation 1%, other religions 4% (includes Zuist and Pentecostal), none 6.1%, other or unspecified 9.2% (2017 est.)
- Languages
Icelandic (English and a second Nordic language, Danish by default, are also a part of the Icelandic compulsory education)[28]
References
- "Statistics Iceland: Background". Statistics Iceland.
- https://px.hagstofa.is/pxen/pxweb/en/Ibuar/Ibuar__mannfjoldi__3_bakgrunnur__Faedingarland/MAN12103.px/?rxid=92af00af-93d6-4d06-9be0-3a88f29ad64f
- "Population – key figures 1703–2017". Px.hagstofa.is. Retrieved 8 November 2017.
- Agnar Helgason; Eileen Hickey; Sara Goodacre; Vidar Bosnes; Ka´ri Stefa´nsson; Ryk Ward; Bryan Sykes (2001). "mtDNA and the Islands of the North Atlantic: Estimating the Proportions of Norse and Gaelic Ancestry". Am. J. Hum. Genet. 68 (3): 723–737. doi:10.1086/318785. PMC 1274484. PMID 11179019.
- Agnar Helgason; Sigrún Sigurðardóttir; Jeffrey R. Gulcher; Ryk Ward; Kári Stefánsson (2000). "mtDNA and the Origin of the Icelanders: Deciphering Signals of Recent Population History". Am. J. Hum. Genet. 66 (3): 999–1016. doi:10.1086/302816. PMC 1288180. PMID 10712214.
- Karlsson, Gunnar (2000). History of Iceland. p. 236.
- Guðbjört Guðjónsdóttir. “ ‘We Blend in with the Crowd but They Don’t’: (In)visibility and Icelandic Migrants in Norway.” Nordic Journal of Migration Research 4 (2014): 176–183.
- Karlsson, Gunnar (2000). History of Iceland. p. 234.
- Kristín Loftsdóttir, “Being ‘the Damned Foreigner’: Affective National Sentiments and Racialization of Lithuanians in Iceland.” Nordic Journal of Migration Research 7.2 (2017): 70–77 (p. 72) doi:10.1515/njmr-2017-0012.
- 'Immigrants and persons with foreign background 2017' (16 June 2017).
- Hanna Ragnarsdóttir, Collisions and Continuities: Ten Immigrant Families and Their Children in Icelandic Society and Schools. Saarbrücken: VDM Verlag Dr. Müller, 2008.
- Skaptadóttir, UD 2004, ‘Mobilities and cultural difference: immigrant’s experiences in Iceland’ in Topographies of globalization: politics, culture, language, eds V Ingimundarson, K Loftsdóttir & I Erlingsdóttir, The University of Iceland Press, Reykjavík pp. 133-149.
- Rannveig Thorisdottir, “Armed with a Pen.” In Black Light, White Shadows: Young People in the Nordic Countries Write about Racism. Edited by Leena Suurpää, 85–97. Copenhagen: Nordic Council of Ministers, 1998.
- Kristín Loftsdóttir, “ ‘Still a Lot of Staring and Curiosity’: Racism and the Racialization of African Immigrants in Iceland.” In New Dimensions of Diversity in Nordic Culture and Society. Edited by Jenny Björklund, Ursula Lindqvist, 263–78. Newcastle upon Tyne: Cambridge Scholars Publishing, 2016.
- Gunnar J. Gunnarsson, Gunnar E. Finnbogason, Hanna Ragnarsdóttir and Halla Jónsdóttir. “Friendship, Diversity and Fear: Young People’s Life Views and Life Values in a Multicultural Society.” Nordidactica: Journal of Humanities and Social Science Education (2015 part 2): 94–113.
- Kristín Loftsdóttir, “The Country without Racism: Multiculturalism and Colonial Identity Formations in Iceland.” Social Identities 17 (2011): 11–25.
- Kristín Loftsdóttir, “Being ‘the Damned Foreigner’: Affective National Sentiments and Racialization of Lithuanians in Iceland.” Nordic Journal of Migration Research 7.2 (2017): 70–77 doi:10.1515/njmr-2017-0012.
- Hanna Ragnarsdóttir, “Competences for Active Communication and Participation in Diverse Societies: Views of Young People in Iceland.” In Intercultural Competence in Education: Alternative Approaches for Different Times. Edited by Fred Dervin and Zehavit Gross, 73–93. London: Palgrave Macmillan, 2016. p. 75.
- "Efnahagslegt sjónarhorn á móttöku flóttamanna" (PDF). Arion Banki.
- "Ísland að breytast í innflytjendaþjóð". RÚV. Retrieved 2016-01-10.
- Björnsson, Davíd F.; Zoega, Gylfi (2017-06-26). "Seasonality of birth rates in agricultural Iceland" (PDF). Scandinavian Economic History Review. 0 (3): 294–306. doi:10.1080/03585522.2017.1340333. ISSN 0358-5522. S2CID 157474068.
- Bjarnason, Thoroddur; Edvardsson, Ingi Runar (August 2017). "University pathways of urban and rural migration in Iceland" (PDF). Journal of Rural Studies. 54: 244–254. doi:10.1016/j.jrurstud.2017.07.001. hdl:20.500.11815/1073.
- "Aldrei lægra hlutfall Íslendinga í Þjóðkirkjunni – Zúistar nærri 1 prósent þjóðarinnar". Eyjan.pressan.is. Retrieved 2017-07-17.
- "Frontpage – Hagstofa". Hagstofa.
- "Inhabitants Overview – Quarterly Data". Statistics Iceland. Retrieved 1 November 2020.
- "Population projection by main indicators 2013–2061". Reykjavík, Iceland: Statistics Iceland.
- "World Population Prospects – Population Division – United Nations". Retrieved 2017-07-15.
- Bella.mrn.stjr.is (PDF). 27 September 2007 https://web.archive.org/web/20070927194106/http://bella.mrn.stjr.is/utgafur/skolenska.pdf. Archived from the original (PDF) on 27 September 2007. Retrieved 8 November 2017. Missing or empty
|title=(help)
External links
- "Hagstofa Íslands" [Statistics Iceland]. statice.is – the national statistical institute of Iceland
- "ICELAND". The World Factbook.
- A 2012 report by the Ministry of Welfare on migration to and from Iceland 1961–2011.