Demographics of Switzerland
This article about the demographics of Switzerland features the population of the Swiss Confederation, including population density, ethnicity, education level, health of the populace, economic status, religious affiliations and other aspects of the population.
| Demographics of Switzerland | |
|---|---|
 Population of Switzerland, 1970–2005 | |
| Population | 8,570,146 (30 June 2019 est.)[1] |
| Density | 208/km2 (48th) 539/sq mi |
| Growth rate | 0.75% (2019 est.) |
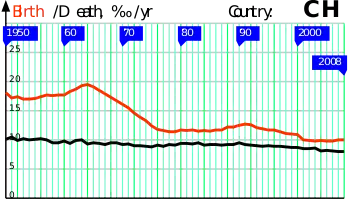
| Birth rate | 10.5 births/1,000 population (2015 est.) |
| Death rate | 8.13 deaths/1,000 population (2015 est.) |
| Life expectancy | 83.8 years |
| • male | 81.9 years |
| • female | 85.6 years [2] |
| Fertility rate | 1.53 children born/woman (2019 est.) |
| Infant mortality rate | 3.67 deaths/1,000 live births |
| Net migration rate | 4.74 migrant(s)/1,000 population (2015 est.)[3] |
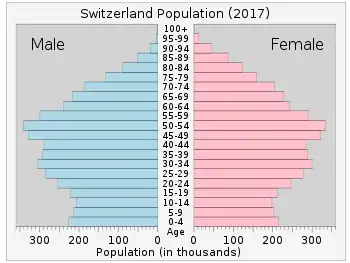
| Age structure | |
| 0–14 years | 15.23% (male 650,151 /female 612,479) |
| 15–64 years | 66.43% (male 2,769,885/ female 2,739,679) |
| 65 and over | 18.34% (male 672,024 /female 848,591) (2018 est.) |
| Sex ratio | |
| Total | 0.97 male(s)/female (2015 est.) |
| At birth | 1.06 male(s)/female |
| Under 15 | 1.05 male(s)/female |
| 15–64 years | 1.02 male(s)/female |
| 65 and over | 0.78 male(s)/female |
| Nationality | |
| Nationality | Swiss |
| Language | |
| Official | German, French, Italian, Romansh |
| Spoken | English, Portuguese, Albanian, Serbian Croatian, Spanish, other |

Switzerland had a population of 8.57 million as of mid-2019.[1] Its population quadrupled over the period 1800 to 1990 (average doubling time 95 years). Population growth was steepest in the period after World War II (1.4% per annum during 1950–1970, doubling time 50 years), it slowed during the 1970s to 1980s and has since again picked up to 1% during the 2000s (doubling time 70 years).
More than 75% of the population live in the central plain, which stretches between the Alps and the Jura Mountains and from Geneva in the southwest to the High Rhine and Lake Constance in the northeast.
As of 2019, foreign residents in the country make up 25.2% of the population.[1]
Census
| Year | Pop. | ±% |
|---|---|---|
| 1861 | 2,515,396 | — |
| 1871 | 2,673,468 | +6.3% |
| 1881 | 2,840,501 | +6.2% |
| 1891 | 2,972,041 | +4.6% |
| 1901 | 3,318,985 | +11.7% |
| 1911 | 3,756,842 | +13.2% |
| 1921 | 3,883,360 | +3.4% |
| 1931 | 4,070,042 | +4.8% |
| 1941 | 4,268,964 | +4.9% |
| 1951 | 4,717,200 | +10.5% |
| 1961 | 5,360,153 | +13.6% |
| 1971 | 6,193,064 | +15.5% |
| 1981 | 6,335,243 | +2.3% |
| 1991 | 6,757,188 | +6.7% |
| 2001 | 7,197,638 | +6.5% |
| 2011 | 7,870,134 | +9.3% |
| 2019 | 8,555,541 | +8.7% |
| Source: Federal Statistical Office, 2019:[4] | ||
The Federal Population Census (German: Eidgenössische Volkszählung, French: Recensement fédéral de la population, Italian: Censimento federale della popolazione, Romansh: Dumbraziun federala dal pievel) has been carried out every 10 years starting in 1850.[5] The census was initiated by Federal Councillor Stefano Franscini, who evaluated the data of the first census all by himself after Parliament failed to provide the necessary funds.[6] The census is now being conducted by the Swiss Federal Statistical Office, which makes most results available on its website.
Collected data includes population data (citizenship, place of residence, place of birth, position in household, number of children, religion, languages, education, profession, place of work, etc.), household data (number of individuals living in the household, etc.), accommodation data (surface area, amount of rent paid, etc.) and building data (geocoordinates, time of construction, number of floors, etc.). Participation is compulsory and reached 99.87% of the population in 2000.[7]
Since 2010, the population census has been carried out and analysed annually in a new format by the Federal Statistical Office (FSO). In order to ease the burden on the population, the information is primarily drawn from population registers and supplemented by sample surveys. Only a small proportion of the population (about 5%) are surveyed in writing or by telephone. The first reference day for the new census was 31 December 2010.
Population
Total of registered residents (numbers relate to 31 December):[8]
| year | total | male | female | Swiss | foreign |
|---|---|---|---|---|---|
| 2015 | 8,327,126 | 4,121,471 (49.5%) | 4,205,655 (50.5%) | 6,278,459 (75.4%) | 2,048,667 (24.6%) |
| 2014 | 8,236,666 | 4,073,880 (49.5%) | 4,163,786 (50.5%) | 6,239,207 (75.7%) | 1,998,459 (24.3%) |
| 2009 | 7,785,800 | 3,830,600 (49.2%) | 3,955,200 (50.8%) | 6,071,800 (78.0%) | 1,714,000 (22.0%) |
| 2008 | 7,701,900 | 3,786,700 (49.2%) | 3,915,200 (50.8%) | 6,032,100 (78.3%) | 1,669,700 (21.7%) |
| 2007 | 7,593,500 | 3,727,000 (49.1%) | 3,866,500 (50.9%) | 5,991,400 (78.9%) | 1,602,100 (21.1%) |
| 2006 | 7,508,700 | 3,679,400 (49.0%) | 3,829,400 (51.0%) | 5,954,200 (79.3% ) | 1,554,500 (20.7%) |
| 2005 | 7,459,100 | 3,652,500 (49.0%) | 3,806,600 (51.0%) | 5,917,200 (79.3%) | 1,541,900 (20.7%) |
| 2004 | 7,415,100 | 3,628,700 (48.9%) | 3,786,400 (51.1%) | 5,890,400 (79.4%) | 1,524,700 (20.6%) |
| 2003 | 7,364,100 | 3,601,500 (48.9%) | 3,762,600 (51.1%) | 5,863,200 (79.6%) | 1,500,900 (20.4%) |
| 2002 | 7,313,900 | 3,575,000 (48.9%) | 3,738,800 (51.1%) | 5,836,900 (79.8%) | 1,477,000 (20.2%) |
| 2001 | 7,255,700 | 3,544,300 (48.8%) | 3,711,300 (51.2%) | 5,808,100 (80.0%) | 1,447,600 (20.0%) |
| 2000 | 7,204,100 | 3,519,700 (48.9%) | 3,684,400 (51.1%) | 5,779,700 (80.2%) | 1,424,400 (19.8%) |
| 1990 | 6,750,700 | 3,298,300 (48.9%) | 3,452,400 (51.1%) | 5,623,600 (83.3%) | 1,127,100 (16.7%) |
| 1980 | 6,335,200 | 3,082,000 (48.6%) | 3,253,300 (51.4%) | 5,421,700 (85.6%) | 913,500 (14.4%) |
| 1970 | 6,193,100 | 3,025,300 (48.8%) | 3,167,700 (51.1%) | 5,191,200 (83.8%) | 1,001,900 (16.2%) |
| 1960–1970 | 5,429,061 | - | - | 4,500,692 (89.2%) | 586,338 (10.8%) |
| 1950–1960 | 4,714,992 | - | - | - (93.9%) | - (6.1%) |
| 1941–1950 | 4,265,703 | - | - | - (94.8%) | - (5.2%) |
| 1930–1941 | 4,066,400 | - | - | - (91.3%) | - (8.7%) |
| 1920–1930 | 3,880,320 | - | - | - (89.6%) | - (10.4%) |
| 1910–1920 | 3,753,293 | - | - | - (85.3%) | - (14.7%) |
| 1900–1910 | 3,315,443 | - | - | - (88.4%) | - (11.6%) |
| 1888–1900 | 2,917,754 | - | - | - (92.2%) | - (7.8%) |
| 1880–1888 | 2,831,787 | - | - | - (92.6%) | - (7.4%) |
| 1870–1880 | 2,655,001 | - | - | - (94.3%) | - (5.7%) |
| 1860–1870 | 2,510,494 | - | - | - (95.4%) | - (4.6%) |
| 1850–1860 | 2,392,740 | - | - | - (97.1%) | - (2.9%) |
| 1837–1850 | 2,190,258 | - | - | - | - |
| 1798–1837 | 1,664,832 | - | - | - | - |
Growth rate
During the 19th and 20th centuries, population growth rate has been at 0.7% to 0.8%, with a doubling time of ca. 90 years. In the later 20th century, the growth rate has fallen below 0.7% (1980s: 0.64%; 1990s: 0.65%), and in the 2000s it has risen again slightly (2000–2006: 0.69%), mostly due to immigration. In 2007 the population grew at a much higher 1.1% rate, again mostly due to immigration. For 2008, the population grew 1.6%, a level not seen since the early 1960s.[9]
Total fertility rate[10]
- 1.46 children born/woman (total)
- 1.33 children born/Swiss woman
- 1.86 children born/non-Swiss woman
Total Fertility Rate from 1850 to 1899
The total fertility rate is the number of children born per woman. It is based on fairly good data for the entire period. Sources: Our World In Data and Gapminder Foundation.[11]
| Years | 1850 | 1851 | 1852 | 1853 | 1854 | 1855 | 1856 | 1857 | 1858 | 1859 | 1860[11] |
|---|---|---|---|---|---|---|---|---|---|---|---|
| Total Fertility Rate in Switzerland | 4.14 | 4.02 | 3.89 | 3.74 | 3.65 | 3.44 | 3.82 | 3.85 | 4.05 | 4.27 | 4.19 |
| Years | 1861 | 1862 | 1863 | 1864 | 1865 | 1866 | 1867 | 1868 | 1869 | 1870[11] |
|---|---|---|---|---|---|---|---|---|---|---|
| Total Fertility Rate in Switzerland | 4.14 | 4.18 | 4.32 | 4.32 | 4.26 | 4.33 | 4.16 | 4.04 | 4.14 | 3.99 |
| Years | 1871 | 1872 | 1873 | 1874 | 1875 | 1876 | 1877 | 1878 | 1879 | 1880[11] |
|---|---|---|---|---|---|---|---|---|---|---|
| Total Fertility Rate in Switzerland | 3.99 | 3.99 | 3.98 | 4.07 | 4.26 | 4.4 | 4.29 | 4.19 | 4.09 | 3.97 |
| Years | 1881 | 1882 | 1883 | 1884 | 1885 | 1886 | 1887 | 1888 | 1889 | 1890[11] |
|---|---|---|---|---|---|---|---|---|---|---|
| Total Fertility Rate in Switzerland | 3.99 | 3.87 | 3.82 | 3.79 | 3.71 | 3.73 | 3.74 | 3.71 | 3.7 | 3.56 |
| Years | 1891 | 1892 | 1893 | 1894 | 1895 | 1896 | 1897 | 1898 | 1899[11] |
|---|---|---|---|---|---|---|---|---|---|
| Total Fertility Rate in Switzerland | 3.78 | 3.71 | 3.74 | 3.66 | 3.66 | 3.77 | 3.79 | 3.82 | 3.89 |
Vital statistics since 1900
Data according to Statistik Schweiz, United Nations, Our World In Data and Gapminder Foundation.[12][13][11]
| Average population | Live births | Deaths | Natural change | Crude birth rate (per 1000) | Crude death rate (per 1000) | Natural change (per 1000) | Total fertility rates | |
|---|---|---|---|---|---|---|---|---|
| 1900 | 3,300,000 | 94,316 | 63,606 | 30,710 | 28.6 | 19.3 | 9.3 | 3.83 |
| 1901 | 3,341,000 | 97,028 | 60,018 | 37,010 | 29.0 | 18.0 | 11.1 | 3.89 |
| 1902 | 3,384,000 | 96,480 | 57,702 | 38,778 | 28.5 | 17.1 | 11.5 | 3.82 |
| 1903 | 3,428,000 | 93,824 | 59,626 | 34,198 | 27.4 | 17.4 | 10.0 | 3.67 |
| 1904 | 3,472,000 | 94,867 | 60,857 | 34,010 | 27.3 | 17.5 | 9.8 | 3.66 |
| 1905 | 3,516,000 | 94,653 | 61,800 | 32,853 | 26.9 | 17.6 | 9.3 | 3.6 |
| 1906 | 3,560,000 | 95,595 | 59,204 | 36,391 | 26.9 | 16.6 | 10.2 | 3.6 |
| 1907 | 3,604,000 | 94,508 | 59,252 | 35,256 | 26.2 | 16.4 | 9.8 | 3.51 |
| 1908 | 3,647,000 | 96,245 | 57,697 | 38,548 | 26.4 | 15.8 | 10.6 | 3.54 |
| 1909 | 3,691,000 | 94,112 | 59,416 | 34,696 | 25.5 | 16.1 | 9.4 | 3.42 |
| 1910 | 3,735,000 | 93,514 | 56,498 | 37,016 | 25.0 | 15.1 | 9.9 | 3.1 |
| 1911 | 3,776,000 | 91,320 | 59,619 | 31,701 | 24.2 | 15.8 | 8.4 | 3.07 |
| 1912 | 3,819,000 | 92,196 | 54,102 | 38,094 | 24.1 | 14.2 | 10.0 | 3.04 |
| 1913 | 3,864,000 | 89,757 | 55,427 | 34,330 | 23.2 | 14.3 | 8.9 | 3.01 |
| 1914 | 3,897,000 | 87,330 | 53,629 | 33,701 | 22.4 | 13.8 | 8.6 | 3 |
| 1915 | 3,883,000 | 75,545 | 51,524 | 24,021 | 19.5 | 13.3 | 6.2 | 2.61 |
| 1916 | 3,883,000 | 73,660 | 50,623 | 23,037 | 19.0 | 13.0 | 5.9 | 2.53 |
| 1917 | 3,888,000 | 72,065 | 53,306 | 18,759 | 18.5 | 13.7 | 4.8 | 2.48 |
| 1918 | 3,880,000 | 72,658 | 75,034 | -2,376 | 18.7 | 19.3 | -0.6 | 2.47 |
| 1919 | 3,869,000 | 72,125 | 54,932 | 17,193 | 18.6 | 14.2 | 4.4 | 2.49 |
| 1920 | 3,877,000 | 81,190 | 55,992 | 25,198 | 20.9 | 14.4 | 6.5 | 2.34 |
| 1921 | 3,876,000 | 80,808 | 49,518 | 31,290 | 20.8 | 12.8 | 8.1 | 2.37 |
| 1922 | 3,874,000 | 76,290 | 50,292 | 25,998 | 19.7 | 13.0 | 6.7 | 2.4 |
| 1923 | 3,883,000 | 75,551 | 45,983 | 29,568 | 19.5 | 11.8 | 7.6 | 2.43 |
| 1924 | 3,896,000 | 73,508 | 48,988 | 24,520 | 18.9 | 12.6 | 6.3 | 2.36 |
| 1925 | 3,910,000 | 72,570 | 47,877 | 24,693 | 18.6 | 12.2 | 6.3 | 2.3 |
| 1926 | 3,932,000 | 72,118 | 46,452 | 25,666 | 18.3 | 11.8 | 6.5 | 2.23 |
| 1927 | 3,956,000 | 69,533 | 49,202 | 20,331 | 17.6 | 12.4 | 5.1 | 2.17 |
| 1928 | 3,988,000 | 69,594 | 48,063 | 21,531 | 17.4 | 12.1 | 5.4 | 2.1 |
| 1929 | 4,022,000 | 69,006 | 50,438 | 18,568 | 17.2 | 12.5 | 4.6 | 2.05 |
| 1930 | 4,051,000 | 69,855 | 46,939 | 22,916 | 17.2 | 11.6 | 5.7 | 1.99 |
| 1931 | 4,080,000 | 68,249 | 49,414 | 18,835 | 16.7 | 12.1 | 4.6 | 1.97 |
| 1932 | 4,102,000 | 68,650 | 49,911 | 18,739 | 16.7 | 12.2 | 4.6 | 1.96 |
| 1933 | 4,122,000 | 67,509 | 47,181 | 20,328 | 16.4 | 11.4 | 4.9 | 1.91 |
| 1934 | 4,140,000 | 67,277 | 46,806 | 20,471 | 16.3 | 11.3 | 4.9 | 1.89 |
| 1935 | 4,155,000 | 66,378 | 50,233 | 16,145 | 16.0 | 12.1 | 3.9 | 1.86 |
| 1936 | 4,168,000 | 64,966 | 47,650 | 17,316 | 15.6 | 11.4 | 4.2 | 1.82 |
| 1937 | 4,180,000 | 62,480 | 47,274 | 15,206 | 14.9 | 11.3 | 3.6 | 1.76 |
| 1938 | 4,192,000 | 63,790 | 48,576 | 15,214 | 15.2 | 11.6 | 3.6 | 1.80 |
| 1939 | 4,206,000 | 63,837 | 49,484 | 14,353 | 15.2 | 11.8 | 3.4 | 1.81 |
| 1940 | 4,226,000 | 64,115 | 50,759 | 13,356 | 15.2 | 12.0 | 3.2 | 1.83 |
| 1941 | 4,254,000 | 71,926 | 47,336 | 24,590 | 16.9 | 11.1 | 5.8 | 2.06 |
| 1942 | 4,286,000 | 78,875 | 46,928 | 31,947 | 18.4 | 10.9 | 7.5 | 2.28 |
| 1943 | 4,323,000 | 83,049 | 47,409 | 35,640 | 19.2 | 11.0 | 8.2 | 2.42 |
| 1944 | 4,364,000 | 85,627 | 52,336 | 33,291 | 19.6 | 12.0 | 7.6 | 2.51 |
| 1945 | 4,412,000 | 88,522 | 51,086 | 37,436 | 20.1 | 11.6 | 8.5 | 2.61 |
| 1946 | 4,467,000 | 89,126 | 50,276 | 38,850 | 20.0 | 11.3 | 8.7 | 2.62 |
| 1947 | 4,524,000 | 87,724 | 51,384 | 36,340 | 19.4 | 11.4 | 8.0 | 2.56 |
| 1948 | 4,582,000 | 87,763 | 49,679 | 38,084 | 19.2 | 10.8 | 8.3 | 2.54 |
| 1949 | 4,639,000 | 85,308 | 49,497 | 35,811 | 18.4 | 10.7 | 7.7 | 2.45 |
| 1950 | 4,694,000 | 84,776 | 47,372 | 37,404 | 18.1 | 10.1 | 8.0 | 2.40 |
| 1951 | 4,749,000 | 81,903 | 49,952 | 31,951 | 17.2 | 10.5 | 6.7 | 2.30 |
| 1952 | 4,815,000 | 83,549 | 47,624 | 35,925 | 17.4 | 9.9 | 7.5 | 2.32 |
| 1953 | 4,878,000 | 83,029 | 49,684 | 33,345 | 17.0 | 10.2 | 6.8 | 2.29 |
| 1954 | 4,929,000 | 83,741 | 49,113 | 34,628 | 17.0 | 10.0 | 7.0 | 2.28 |
| 1955 | 4,980,000 | 85,331 | 50,366 | 34,965 | 17.1 | 10.1 | 7.0 | 2.30 |
| 1956 | 5,045,000 | 87,912 | 51,573 | 36,339 | 17.4 | 10.2 | 7.2 | 2.35 |
| 1957 | 5,126,000 | 90,823 | 51,066 | 39,757 | 17.7 | 10.0 | 7.8 | 2.41 |
| 1958 | 5,199,000 | 91,421 | 49,281 | 42,140 | 17.6 | 9.5 | 8.1 | 2.40 |
| 1959 | 5,259,000 | 92,973 | 50,077 | 42,896 | 17.7 | 9.5 | 8.2 | 2.42 |
| 1960 | 5,362,000 | 94,372 | 52,094 | 42,278 | 17.6 | 9.7 | 7.9 | 2.34 |
| 1961 | 5,434,000 | 99,238 | 51,004 | 48,234 | 18.3 | 9.4 | 8.9 | 2.48 |
| 1962 | 5,574,000 | 104,322 | 55,125 | 49,197 | 18.7 | 9.9 | 8.8 | 2.46 |
| 1963 | 5,694,000 | 109,993 | 56,989 | 53,004 | 19.3 | 10.0 | 9.3 | 2.68 |
| 1964 | 5,789,000 | 112,890 | 53,609 | 59,281 | 19.5 | 9.3 | 10.2 | 2.85 |
| 1965 | 5,856,000 | 111,835 | 55,547 | 56,288 | 19.1 | 9.5 | 9.6 | 2.57 |
| 1966 | 5,918,000 | 109,738 | 55,804 | 53,934 | 18.5 | 9.4 | 9.1 | 2.47 |
| 1967 | 5,992,000 | 107,417 | 55,142 | 52,275 | 17.9 | 9.2 | 8.7 | 2.37 |
| 1968 | 6,068,000 | 105,130 | 57,342 | 47,788 | 17.3 | 9.4 | 7.9 | 2.28 |
| 1969 | 6,136,000 | 102,520 | 58,002 | 44,518 | 16.7 | 9.5 | 7.3 | 2.12 |
| 1970 | 6,181,000 | 99,216 | 57,091 | 42,125 | 16.1 | 9.2 | 6.8 | 2.11 |
| 1971 | 6,213,000 | 96,261 | 57,856 | 38,405 | 15.5 | 9.3 | 6.2 | 2.06 |
| 1972 | 6,261,000 | 91,342 | 56,489 | 34,853 | 14.6 | 9.0 | 5.6 | 1.95 |
| 1973 | 6,307,000 | 87,518 | 56,990 | 30,528 | 13.9 | 9.0 | 4.8 | 1.85 |
| 1974 | 6,341,000 | 84,507 | 56,403 | 28,104 | 13.3 | 8.9 | 4.4 | 1.73 |
| 1975 | 6,339,000 | 78,464 | 55,924 | 22,540 | 12.4 | 8.8 | 3.6 | 1.63 |
| 1976 | 6,303,000 | 74,199 | 57,095 | 17,104 | 11.8 | 9.1 | 2.7 | 1.55 |
| 1977 | 6,281,000 | 72,829 | 55,658 | 17,171 | 11.6 | 8.9 | 2.7 | 1.53 |
| 1978 | 6,281,000 | 71,375 | 57,718 | 13,657 | 11.4 | 9.2 | 2.2 | 1.53 |
| 1979 | 6,294,000 | 71,986 | 57,454 | 14,532 | 11.4 | 9.1 | 2.3 | 1.52 |
| 1980 | 6,319,000 | 73,661 | 59,097 | 14,564 | 11.7 | 9.4 | 2.3 | 1.57 |
| 1981 | 6,354,000 | 73,747 | 59,763 | 13,984 | 11.6 | 9.4 | 2.2 | 1.59 |
| 1982 | 6,391,000 | 74,916 | 59,204 | 15,712 | 11.7 | 9.3 | 2.5 | 1.60 |
| 1983 | 6,419,000 | 73,659 | 60,756 | 12,903 | 11.5 | 9.5 | 2.0 | 1.52 |
| 1984 | 6,442,000 | 74,710 | 58,602 | 16,108 | 11.6 | 9.1 | 2.5 | 1.52 |
| 1985 | 6,470,000 | 74,684 | 59,583 | 15,101 | 11.5 | 9.2 | 2.3 | 1.51 |
| 1986 | 6,504,000 | 76,320 | 60,105 | 16,215 | 11.7 | 9.2 | 2.5 | 1.52 |
| 1987 | 6,545,000 | 76,505 | 59,511 | 16,994 | 11.7 | 9.1 | 2.6 | 1.56 |
| 1988 | 6,593,000 | 80,345 | 60,648 | 19,697 | 12.2 | 9.2 | 3.0 | 1.59 |
| 1989 | 6,647,000 | 81,180 | 60,882 | 20,298 | 12.2 | 9.2 | 3.1 | 1.62 |
| 1990 | 6,712,000 | 83,939 | 63,739 | 20,200 | 12.5 | 9.5 | 3.0 | 1.63 |
| 1991 | 6,800,000 | 86,200 | 62,634 | 23,566 | 12.7 | 9.2 | 3.5 | 1.68 |
| 1992 | 6,875,000 | 86,910 | 62,302 | 24,608 | 12.6 | 9.1 | 3.6 | 1.62 |
| 1993 | 6,938,000 | 83,762 | 62,512 | 21,250 | 12.1 | 9.0 | 3.1 | 1.53 |
| 1994 | 6,994,000 | 82,980 | 61,987 | 20,993 | 11.9 | 8.9 | 3.0 | 1.49 |
| 1995 | 7,041,000 | 82,203 | 63,387 | 18,816 | 11.7 | 9.0 | 2.7 | 1.46 |
| 1996 | 7,072,000 | 83,007 | 62,637 | 20,370 | 11.7 | 8.9 | 2.9 | 1.53 |
| 1997 | 7,089,000 | 79,485 | 59,967 | 19,518 | 11.2 | 8.5 | 2.8 | 1.45 |
| 1998 | 7,110,000 | 78,949 | 62,569 | 16,380 | 11.1 | 8.8 | 2.3 | 1.48 |
| 1999 | 7,144,000 | 78,408 | 62,503 | 15,905 | 11.0 | 8.7 | 2.2 | 1.47 |
| 2000 | 7,184,000 | 78,458 | 62,528 | 15,930 | 10.9 | 8.7 | 2.2 | 1.50 |
| 2001 | 7,230,000 | 73,509 | 61,287 | 12,222 | 10.2 | 8.5 | 1.7 | 1.41 |
| 2002 | 7,285,000 | 72,372 | 61,768 | 10,604 | 9.9 | 8.5 | 1.5 | 1.39 |
| 2003 | 7,339,000 | 71,848 | 63,070 | 8,778 | 9.8 | 8.6 | 1.2 | 1.39 |
| 2004 | 7,390,000 | 73,082 | 60,180 | 12,902 | 9.9 | 8.1 | 1.7 | 1.42 |
| 2005 | 7,437,000 | 72,903 | 61,124 | 11,779 | 9.8 | 8.2 | 1.6 | 1.43 |
| 2006 | 7,484,000 | 73,371 | 60,283 | 13,088 | 9.8 | 8.1 | 1.7 | 1.44 |
| 2007 | 7,551,000 | 74,494 | 61,089 | 13,405 | 9.9 | 8.1 | 1.8 | 1.46 |
| 2008 | 7,648,000 | 76,691 | 61,233 | 15,458 | 10.0 | 8.0 | 2.0 | 1.48 |
| 2009 | 7,742,000 | 78,286 | 62,476 | 15,810 | 10.1 | 8.1 | 2.0 | 1.50 |
| 2010 | 7,858,000 | 80,290 | 62,553 | 17,737 | 10.3 | 8.0 | 2.3 | 1.54 |
| 2011 | 7,952,000 | 80,808 | 62,091 | 18,717 | 10.2 | 7.8 | 2.3 | 1.52 |
| 2012 | 8,003,000 | 82,164 | 64,173 | 17,991 | 10.3 | 8.0 | 2.2 | 1.53 |
| 2013 | 8,021,000 | 82,731 | 64,961 | 17,770 | 10.3 | 8.0 | 2.3 | 1.52 |
| 2014 | 8,220,000 | 85,287 | 63,938 | 21,349 | 10.4 | 7.8 | 2.6 | 1.54 |
| 2015 | 8,325,000 | 86,559 | 67,606 | 18,953 | 10.4 | 8.1 | 2.3 | 1.54 |
| 2016 | 8,417,000 | 87,883 | 64,964 | 22,919 | 10.4 | 7.7 | 2.7 | 1.55 |
| 2017 | 8,482,000 | 87,381 | 66,971 | 20,410 | 10.3 | 7.9 | 2.4 | 1.52 |
| 2018 | 8,542,300 | 87,851 | 67,088 | 20,763 | 10.3 | 7.9 | 2.4 | 1.52 |
| 2019 | 8,603,900 | 86,172 | 67,780 | 18,392 | 10.0 | 7.9 | 2.1 | 1.48 |
Current vital statistics
- Births for January–November 2019 =
 79,369
 - Births for January–November 2020 = 73,533
- Deaths for January–November 2019 =
 61,859
 - Deaths for January–November 2020 = 64,885
- Natural population growth for January–November 2019 = 17,510
- Natural population growth for January–November 2020 = 8,648
Age structure
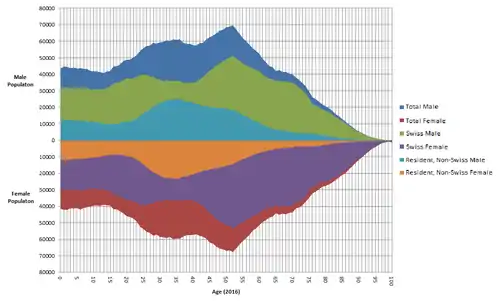
| Age | Total / 1000 (% of total) | Male / 1000 | Female / 1000 | Swiss / 1000 | Foreign / 1000 (% of total for age bracket) |
|---|---|---|---|---|---|
| 0-10 | 902.7 (11.0%) | 463.7 | 439.0 | 661.8 | 240.8 (26.7%) |
| 11-20 | 854.4 (10.4%) | 438.3 | 416.0 | 668.5 | 185.9 (21.8%) |
| 21-30 | 1,071.5 (13.0%) | 542.4 | 529.1 | 754.1 | 317.4 (29.6%) |
| 31-40 | 1,149.1 (13.9%) | 579.5 | 569.6 | 706.6 | 442.5 (38.5%) |
| 41-50 | 1,282.3 (15.6%) | 647.4 | 634.8 | 916.3 | 365.9 (28.5%) |
| 51-60 | 1,146.2 (13.9%) | 578.5 | 567.7 | 911.2 | 235.0 (20.5%) |
| 61-70 | 876.4 (10.6%) | 427.0 | 449.5 | 762.2 | 114.2 (13.0%) |
| 71-80 | 593.8 (7.2%) | 268.6 | 325.2 | 522.1 | 71.8 (12.1%) |
| 81-90 | 308.0 (3.7%) | 114.3 | 193.7 | 285.7 | 22.3 (7.2%) |
| 91+ | 53.3 (0.6%) | 14.1 | 39.2 | 50.7 | 2.6 (4.8%) |
As population growth curbs, the percentage of elderly people increases. In July 2015, the Swiss Federal Office of Statistics published a projection estimating that by 2045, the ratio of residents over the retirement age of 65 would climb to 48.1 per 100 residents between 20 and 64 years old, and possibly as high as 50.0 in the highest case. In 2015 that ratio was only 29.1 per 100 residents.[17]
| 0-20 (in millions) | Percent | 21-64 (in millions) | Percent | 65+ (in millions) | Percent | |
|---|---|---|---|---|---|---|
| 2015 | 1.67 | 20.0% | 5.17 | 61.9% | 1.5 | 18.0% |
| 2030 | 1.88 | 19.7% | 5.49 | 57.5% | 2.17 | 22.8% |
| 2045 (low) | 1.66 | 17.7% | 5.13 | 54.9% | 2.56 | 27.4% |
| 2045 (avg) | 1.90 | 18.6% | 5.59 | 54.9% | 2.69 | 26.4% |
| 2045 (high) | 2.16 | 19.6% | 6.06 | 55.0% | 2.81 | 25.5% |
Sex ratio
| age | males (in thousands) | females (in thousands) | ratio (male/female) |
|---|---|---|---|
| at birth | 38.1 | 36.2 | 1.05 |
| 0-15 | 651.8 | 615.6 | 1.06 |
| 16-64 | 2,551.0 | 2,530.0 | 1.01 |
| 65+ | 524.3 | 720.9 | 0.73 |
| total | 3,727.0 | 3,866.5 | 0.96 |
Life expectancy at birth
According to statistics released by the federal government in 2019, life expectancy stands at 81.9 years for men and 85.6 years for women, for an overall average of 83.8 years for the populace as a whole.[18]
Life expectancy from 1850 to 1950
Sources: Our World In Data
1850-1950
| Years | 1876 | 1877 | 1878 | 1879 | 1880 | 1881 | 1882 | 1883 | 1884 | 1885 | 1886 | 1887 | 1888 | 1889 | 1890[19] |
|---|---|---|---|---|---|---|---|---|---|---|---|---|---|---|---|
| Life expectancy in Switzerland | 40.1 | 40.0 | 40.5 | 41.8 | 42.8 | 41.9 | 43.0 | 45.0 | 45.0 | 43.9 | 44.7 | 45.4 | 46.0 | 45.1 | 45.0 |
| Years | 1891 | 1892 | 1893 | 1894 | 1895 | 1896 | 1897 | 1898 | 1899 | 1900[19] |
|---|---|---|---|---|---|---|---|---|---|---|
| Life expectancy in Switzerland | 44.7 | 47.2 | 46.1 | 45.8 | 46.9 | 48.9 | 49.1 | 48.2 | 49.3 | 47.5 |
| Years | 1901 | 1902 | 1903 | 1904 | 1905 | 1906 | 1907 | 1908 | 1909 | 1910[19] |
|---|---|---|---|---|---|---|---|---|---|---|
| Life expectancy in Switzerland | 48.9 | 50.4 | 50.1 | 49.2 | 49.7 | 50.7 | 51.2 | 52.3 | 51.6 | 52.9 |
| Years | 1911 | 1912 | 1913 | 1914 | 1915 | 1916 | 1917 | 1918 | 1919 | 1920[19] |
|---|---|---|---|---|---|---|---|---|---|---|
| Life expectancy in Switzerland | 51.7 | 54.4 | 54.2 | 55.1 | 55.9 | 56.5 | 55.8 | 46.3 | 54.9 | 54.3 |
| Years | 1921 | 1922 | 1923 | 1924 | 1925 | 1926 | 1927 | 1928 | 1929 | 1930[19] |
|---|---|---|---|---|---|---|---|---|---|---|
| Life expectancy in Switzerland | 57.8 | 58.5 | 60.0 | 59.5 | 59.9 | 60.6 | 60.1 | 60.4 | 60.2 | 61.4 |
| Years | 1931 | 1932 | 1933 | 1934 | 1935 | 1936 | 1937 | 1938 | 1939 | 1940[19] |
|---|---|---|---|---|---|---|---|---|---|---|
| Life expectancy in Switzerland | 61.2 | 61.2 | 62.4 | 62.9 | 62.1 | 63.2 | 63.5 | 63.8 | 64.0 | 63.5 |
| Years | 1941 | 1942 | 1943 | 1944 | 1945 | 1946 | 1947 | 1948 | 1949 | 1950[19] |
|---|---|---|---|---|---|---|---|---|---|---|
| Life expectancy in Switzerland | 65.0 | 65.6 | 65.8 | 64.8 | 65.4 | 66.0 | 66.2 | 67.3 | 67.9 | 68.9 |
1950 to 2015
| Period | Life expectancy in Years |
Period | Life expectancy in Years |
|---|---|---|---|
| 1950–1955 | 69.3 | 1985–1990 | 77.2 |
| 1955–1960 | 70.7 | 1990–1995 | 77.9 |
| 1960–1965 | 71.6 | 1995–2000 | 79.2 |
| 1965–1970 | 72.6 | 2000–2005 | 80.5 |
| 1970–1975 | 73.7 | 2005–2010 | 81.8 |
| 1975–1980 | 75.2 | 2010–2015 | 82.7 |
| 1980–1985 | 76.1 |
Source: UN World Population Prospects[20]
Nationality
Encompassing the Central Alps, Switzerland sits at the crossroads of several major European cultures. Its population includes a two-thirds majority of Alemannic German speakers and a one-quarter Latin minority (French, Italian and Romansh), see linguistic geography of Switzerland. 10% of the population natively speak an immigrant language.
Switzerland consistently ranks high on quality of life indices, including per capita income, concentration of computer and internet usage per capita, insurance coverage per individual, and health care rates. For these and many other reasons, such as the four languages, it serves as an excellent test market for businesses hoping to introduce new products into Europe.
Permanent residents by nationality
The number of registered resident foreigners was 1,001,887 (16.17%) in 1970. This amount decreased to 904,337 (14.34%) in 1979, and has increased steadily since that time, passing the 20% mark during 2001 and rising to 1,524,663 (20.56%) in 2004. The number of Swiss citizens thus numbered about 5.9 million in that year.
In 2013 there were a total of 1,937,447 permanent residents (23.8% of the total population of 8.14 million) in Switzerland. Of these, 1.65 million resident foreigners (85.0%, or 20.2% of the 8.14 Million total population[21][22]), had European citizenship (Italian: 298,875; German: 292,291; Portuguese: 253,227; French: 110,103; Serbian: 90,704; Kosovan: 86,976; Spanish: 75,333, Macedonian: 62,633; British: 40,898; Austrian: 39,494; Bosnian and Herzegovinian: 33,002; Croatian: 30,471). From other continents; 122,941 residents were from Asia; 83,873 from Africa; 78,433 from the Americas; and 4,145 from Oceania.[22]
The following chart shows permanent resident numbers from selected regions and countries every 5 years.
| Nation | 1980 | 1985 | 1990 | 1995 | 2000 | 2005 | 2010 | 2015 |
|---|---|---|---|---|---|---|---|---|
| Total | 913,497 | 960,674 | 1,127,109 | 1,363,590 | 1,424,370 | 1,541,912 | 1,766,277 | 2,048,667 |
| Europe | 859,054 | 892,748 | 1,036,760 | 1,238,937 | 1,261,975 | 1,334,590 | 1,504,943 | 1,733,255 |
| Africa | 10,539 | 13,130 | 20,291 | 28,800 | 37,618 | 48,081 | 71,527 | 93,814 |
| Americas | 20,838 | 23,438 | 29,149 | 38,585 | 49,687 | 61,732 | 74,511 | 78,773 |
| North America | 12,182 | 12,394 | 13,775 | 16,140 | 18,952 | 21,004 | 25,590 | 26,271 |
| Latin America and Caribbean | 8,656 | 11,044 | 15,374 | 22,445 | 30,735 | 40,728 | 48,921 | 52,502 |
| Asia | 21,569 | 29,772 | 38,921 | 54,914 | 72,002 | 94,009 | 110,549 | 136,789 |
| Oceania | 1,260 | 1,326 | 1,728 | 1,999 | 2,829 | 3,242 | 3,990 | 4,230 |
| Germany | 87,389 | 82,143 | 84,485 | 91,976 | 109,785 | 158,651 | 263,271 | 300,691 |
| Spain | 98,098 | 109,232 | 116,987 | 102,320 | 84,266 | 72,167 | 64,126 | 82,334 |
| France | 48,002 | 48,948 | 51,729 | 55,407 | 61,688 | 70,901 | 95,643 | 122,970 |
| Italy | 423,008 | 394,812 | 381,493 | 361,892 | 321,795 | 297,917 | 287,130 | 311,742 |
| Austria | 31,986 | 29,417 | 29,123 | 28,454 | 29,191 | 33,069 | 37,013 | 41,145 |
| Portugal | 10,863 | 31,029 | 86,035 | 135,646 | 135,449 | 167,857 | 212,586 | 267,474 |
| United Kingdom | 16,050 | 17,482 | 18,269 | 20,030 | 22,309 | 26,425 | 37,273 | 41,766 |
| Croatia | - | - | - | 42,582 | 43,876 | 40,709 | 33,507 | 29,355 |
| Serbia and Montenegro | - | - | - | - | 190,940 | 196,833 | - | - |
| Serbia | - | - | - | - | - | - | 121,908 | 71,260 |
| Montenegro | - | - | - | - | - | - | 2,022 | 2,536 |
| Kosovo | - | - | - | - | - | - | 58,755 | 106,879 |
| Bosnia and Herzegovina | - | - | - | 24,748 | 45,111 | 43,354 | 35,513 | 31,905 |
| North Macedonia | - | - | - | 39,540 | 56,092 | 60,898 | 60,116 | 64,448 |
| Albania | 15 | 17 | 29 | 576 | 1,093 | 1,218 | 1,308 | 1,590 |
| Sri Lanka | 373 | 808 | 2,840 | 9,841 | 20,215 | 31,865 | 28,963 | 27,667 |
| Iraq | 352 | 378 | 454 | 771 | 2,046 | 3,257 | 7,553 | 7,092 |
| Turkey | 38,353 | 51,206 | 64,899 | 79,372 | 80,165 | 75,903 | 71,835 | 69,215 |
Source:[22]
Tamil refugees fleeing from war in Sri Lanka are the largest number of Asians, while Albanians and former Yugoslavians continue to grow in number. Switzerland is also the second largest European country in number of acceptance of Iraqi refugees fleeing from the violence in Iraq since 2003, but behind Great Britain, Germany and Sweden in the number of Iraqis taken residence for a European country.
Naturalization
In 2004, 35,700 people acquired Swiss citizenship according to Swiss nationality law, a figure slightly larger than that of the previous year (35,424), and four times larger than the 1990 figure (8,658). About a third of those naturalized are from a successor state of Former Yugoslavia: 7,900 Serbia-Montenegro, 2,400 Bosnia-Herzegovina, 2,000 North Macedonia, 1,600 Croatia. 4,200 were from Italy, 3,600 from Turkey, 1,600 from Sri Lanka, 1,200 from Portugal, and 1,200 from France.[23]
The yearly rate of naturalization has quintupled over the 1990s and 2000s, from roughly 9,000 to 45,000. Relative to the population of resident foreigners, this amounts to an increase from 8% in 1990 to 27% in 2007, or relative to the number of Swiss citizens from 1.6% in 1990 to 7.3% in 2007.
The following table shows the historical development of naturalization from selected countries.[24]
| Origin | 1981 | 1985 | 1990 | 1995 | 2000 | 2001 | 2002 | 2003 | 2004 | 2005 | 2006 | 2007 | 2008 | 2009 | 2010 | 2011 | 2012 | 2013 |
|---|---|---|---|---|---|---|---|---|---|---|---|---|---|---|---|---|---|---|
| Total | 14,299 | 14,393 | 8,658 | 16,790 | 28,700 | 27,583 | 36,515 | 35,424 | 35,685 | 38,437 | 46,711 | 43,889 | 44,365 | 43,440 | 39,314 | 36,012 | 33,500 | 34,061 |
| Europe | 12,978 | 12,349 | 6,970 | 12,592 | 21,975 | 20,969 | 28,102 | 27,558 | 27,728 | 30,109 | 36,087 | 33,771 | 34,879 | 33,795 | 30,458 | 27,769 | 25,778 | 26,457 |
| Africa | 283 | 341 | 273 | 919 | 1,824 | 1,900 | 2,163 | 1,954 | 1,848 | 2,064 | 2,619 | 2,883 | 2,599 | 2,627 | 2,499 | 2,337 | 2,417 | 2,363 |
| North America | 171 | 277 | 139 | 230 | 321 | 316 | 376 | 367 | 333 | 336 | 407 | 451 | 371 | 427 | 428 | 410 | 443 | 499 |
| South America and Caribbean | 245 | 442 | 461 | 777 | 1,554 | 1,528 | 1,790 | 1,749 | 1,626 | 1,478 | 1,859 | 1,921 | 1,675 | 1,802 | 1,587 | 1,613 | 1,407 | 1,609 |
| Asia | 590 | 928 | 796 | 2,226 | 2,981 | 2,830 | 4,033 | 3,717 | 4,065 | 4,382 | 5,666 | 4,787 | 4,771 | 4,710 | 4,261 | 3,788 | 3,349 | 3,038 |
| Oceania | 30 | 52 | 12 | 24 | 29 | 27 | 35 | 67 | 73 | 59 | 62 | 61 | 56 | 55 | 58 | 62 | 64 | 66 |
| Italy | 4,665 | 3,259 | 1,995 | 4,376 | 6,652 | 5,386 | 6,633 | 5,085 | 4,196 | 4,032 | 4,502 | 4,629 | 4,921 | 4,804 | 4,111 | 4,033 | 3,998 | 4,379 |
| Germany | 2,650 | 2,839 | 1,144 | 703 | 646 | 585 | 817 | 670 | 639 | 773 | 1,144 | 1,361 | 3,022 | 4,035 | 3,617 | 3,516 | 3,357 | 3,804 |
| Kosovo | 1,611 | 2,518 | 2,556 | 2,640 | ||||||||||||||
| Serbia | 6,859 | 4,261 | 3,362 | 2,529 | ||||||||||||||
| Portugal | 86 | 127 | 170 | 175 | 765 | 779 | 920 | 1,165 | 1,199 | 1,505 | 2,383 | 2,201 | 1,761 | 2,336 | 2,217 | 2,211 | 2,071 | 2,184 |
| Turkey | 150 | 189 | 211 | 1,205 | 3,127 | 3,116 | 4,128 | 4,216 | 3,565 | 3,467 | 3,457 | 3,044 | 2,866 | 2,593 | 2,091 | 1,852 | 1,638 | 1,622 |
| France | 1,262 | 1,228 | 684 | 871 | 1,360 | 1,306 | 1,367 | 1,215 | 1,181 | 1,021 | 1,260 | 1,218 | 1,110 | 1,314 | 1,084 | 1,272 | 1,197 | 1,558 |
| North Macedonia | 76 | 857 | 1,022 | 1,639 | 1,802 | 1,981 | 2,171 | 2,596 | 2,210 | 2,287 | 1,831 | 1,586 | 1,322 | 1,212 | 1,270 | |||
| Bosnia and Herzegovina | 112 | 999 | 1,128 | 1,865 | 2,268 | 2,371 | 2,790 | 3,149 | 3,016 | 2,855 | 2,408 | 1,924 | 1,610 | 1,145 | 1,156 | |||
| Croatia | 577 | 970 | 1,045 | 1,638 | 1,565 | 1,616 | 1,681 | 1,837 | 1,660 | 2,046 | 1,599 | 1,483 | 1,268 | 1,195 | 1,118 | |||
| Spain | 567 | 643 | 401 | 431 | 851 | 699 | 691 | 800 | 823 | 975 | 1,283 | 1,246 | 1,096 | 1,245 | 1,120 | 1,044 | 1,033 | 1,047 |
| Sri Lanka | 7 | 104 | 30 | 42 | 375 | 446 | 1,124 | 1,139 | 1,565 | 1,996 | 2,941 | 2,206 | 2,348 | 2,158 | 1,783 | 1,467 | 1,170 | 890 |
| Iraq | 2 | 8 | 3 | 15 | 40 | 42 | 33 | 54 | 67 | 80 | 139 | 142 | 163 | 190 | 240 | 266 | 399 | 355 |
Immigration
Foreign population by country of citizenship as of 2019:[25]
| Rank | Nationality | Population |
|---|---|---|
| 1 | 321,309 | |
| 2 | 307,387 | |
| 3 | 260,100 | |
| 4 | 138,947 | |
| 5 | 112,780 | |
| 6 | 84,362 | |
| 7 | 67,711 | |
| 8 | 67,108 | |
| 9 | 63,238 | |
| 10 | 43,650 | |
| 11 | 41,734 | |
| 12 | 39,689 | |
| 13 | 33,957 | |
| 14 | 29,291 | |
| 15 | 28,838 | |
| 16 | 28,020 | |
| 17 | 23,921 | |
| 18 | 22,014 | |
| 19 | 21,789 | |
| 20 | 21,158 | |
| 21 | 20,114 | |
| 22 | 19,712 | |
| 23 | 19,310 | |
| 24 | 17,914 | |
| 25 | 17,712 | |
| 26 | 16,099 | |
| 27 | 15,520 | |
| 28 | 15,424 | |
| 29 | 13,699 | |
| 30 | 11,831 | |
Emigration
In 2004, 623,100 Swiss citizens (8.9%) lived abroad, the largest group in France (166,200), followed by the USA (71,400) and Germany (70,500). (see Swiss diaspora).
Demographic statistics
Demographic statistics according to the World Population Review in 2019.[26]
- One birth every 6 minutes
- One death every 8 minutes
- One net migrant every 11 minutes
- Net gain of one person every 8 minutes
Demographic statistics according to the CIA World Factbook, unless otherwise indicated.[27]
- Population
- 8,292,809 (July 2018 est.)
- Age structure
- 0-14 years: 15.23% (male 650,151 /female 612,479)
- 15-24 years: 10.69% (male 453,003 /female 433,101)
- 25-54 years: 42.88% (male 1,781,425 /female 1,774,124)
- 55-64 years: 12.88% (male 535,457 /female 532,454)
- 65 years and over: 18.34% (male 672,024 /female 848,591) (2018 est.)
- Median age
- total: 42.5 years Country comparison to the world: 30th
- male: 41.5 years
- female: 43.5 years (2018 est.)
- Birth rate
- 10.5 births/1,000 population (2018 est.) Country comparison to the world: 187th
- Death rate
- 8.4 deaths/1,000 population (2018 est.) Country comparison to the world: 81st
- Total fertility rate
- 1.56 children born/woman (2018 est.) Country comparison to the world: 189th
- Net migration rate
- 4.6 migrant(s)/1,000 population (2018 est.) Country comparison to the world: 28th
- 4.7 migrant(s)/1,000 population (2017 est.)
- Mother's mean age at first birth
- 30.7 years (2014 est.)
- Population growth rate
- 0.68% (2018 est.) Country comparison to the world: 144th
- Life expectancy at birth
- total population: 82.7 years (2018 est.) Country comparison to the world: 12th
- male: 80.4 years (2018 est.)
- female: 85.2 years (2018 est.)
- Ethnic groups
- Swiss 69.5%, German 4.2%, Italian 3.2%, Portuguese 2.6%, French 2%, Kosovar 1.1%, other 17.3%, unspecified .1% (2018 est.)
- note: data represent permanent resident population by country of birth
- Languages
- German (or Swiss German) (official) 62.8%, French (official) 22.9%, Italian (official) 8.2%, English 5.1%, Portuguese 3.7%, Albanian 3.1%, Serbo-Croatian 2.4%, Spanish 2.3%, Romansh (official) 0.5%, other 7.5% (2016 est.)
- note: German, French, Italian, and Romansh are all national and official languages; shares sum to more than 100% because some respondents gave more than one answer
- Urbanization
- urban population: 73.8% of total population (2018)
- rate of urbanization: 0.88% annual rate of change (2015-20 est.)
- Dependency ratios
- total dependency ratio: 48.8 (2015 est.)
- youth dependency ratio: 22 (2015 est.)
- elderly dependency ratio: 26.8 (2015 est.)
- potential support ratio: 3.7 (2015 est.)
- Sex ratio
- at birth: 1.06 male(s)/female (2017 est.)
- 0-14 years: 1.06 male(s)/female (2017 est.)
- 15-24 years: 1.04 male(s)/female (2017 est.)
- 25-54 years: 1.01 male(s)/female (2017 est.)
- 55-64 years: 1 male(s)/female (2017 est.)
- 65 years and over: 0.78 male(s)/female (2017 est.)
- total population: 0.97 male(s)/female (2017 est.)
- School life expectancy (primary to tertiary education)
- total: 16 years (2014)
- male: 16 years (2014)
- female: 16 years (2014)
- Unemployment, youth ages 15–24
- total: 8.1%. Country comparison to the world: 138th
- male: 8.1%
- female: 8% (2017 est.)
Religions
Religion in Switzerland (population age 15+, 2016)[28]
Switzerland as a federal state has no state religion, though most of the cantons (except for Geneva and Neuchâtel) recognize official churches (Landeskirchen), in all cases including the Roman Catholic Church and the Swiss Reformed Church. These churches, and in some cantons also the Old Catholic Church and Jewish congregations, are financed by official taxation of adherents.[29]
In 2000, 5.78 million residents (79.2%, compared to 93.8% in 1980) were Christian (Roman Catholic 41.8%, Protestant 35.3%, Orthodox 1.8%). 809,800 (11.1%, compared to 3.8% in 1980) were without any religious affiliation. 310,800 (4.3%) were Muslim (compared to 0.9% in 1980), 17,900 (0.2%) were Jewish. The 2005 Eurobarometer poll[30] found 48% of Swiss residents to be theist, 39% expressing belief in "some sort of spirit or life force", 9% atheist and 4% said that they "don't know".
Adherence to Christian churches has declined considerably since the late 20th century, from close to 94% in 1980 to about 67% as of 2016. Furthermore, notable is the significant difference in church adherence between Swiss citizens (72%) and foreign nationals (51%) in 2016.[28]
The Federal Statistical Office reported the religious demographics as of 2016 as follows (based on the resident population age 15 years and older): 66.9% Christian (including 36.5% Roman Catholic, 24.5% Reformed, 5.9% other), 24.9% unaffiliated, 5.2% Muslim, 0.3% Jewish, 1.4% other religions. (100%: 6,981,381, registered resident population age 15 years and older).[28] From the same 2016 survey, of 15 to 24 year olds 65.4% were Christian (36.3% Roman Catholic, 22.6% Reformed, 6.6% other), 23.0% unaffiliated, 0.3% Jewish, 8.3% Muslim, 1.7% other religions. Those aged 25 to 44 were 58.4% Christian (33.1% Roman Catholic, 18.7% Reformed, 6.7% other), 31.0% unaffiliated, 0.2% Jewish, 7.5% Muslim, 1.7% other religions. Older adults (45 to 64 years old) were 67.0% Christian (37.7% Roman Catholic, 23.9% Reformed, 5.5% other), 25.9% unaffiliated, 0.2% Jewish, 4.2% Muslim, 1.5% other religions. Senior citizens (over 65) were 81.3% Christian (40.3% Roman Catholic, 36.2% Reformed, 4.8% other), 14.9% unaffiliated, 0.3% Jewish, 1.1% Muslim, 0.5% other religions.[28]
Languages
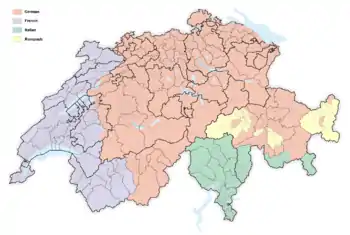
The four national languages of Switzerland are German, French, Italian and Romansh. In 2017, permanent residents who spoke German (mostly Swiss German dialects) as their main language or co-main language numbered about 63% (5.2 million), followed by 22.9% (1.9 million) for French (mostly Swiss French, but including some Franco-Provençal dialects), 8.2% (678,000, mostly Swiss Italian, but including Insubric dialects) for Italian and less than 0.5% (44,000) for Romansh.[32]
The non-official language with the largest group of main or co-main language speakers (in 2017) is English with 448,000 speakers, followed by Portuguese with 303,000, Albanian with 262,000, followed by Serbo-Croatian with 205,000 speakers and Spanish with 197,000. All other languages totaled 640,000.[32]
Education
Almost all Swiss are literate. Switzerland's 13 institutes of higher learning enrolled 99,600 students in the academic year of 2001–02. About 25% of the adult population hold a diploma of higher learning. According to the CIA World Factbook data for 2003, 99% of the Swiss population aged 15 and over could read and write, with the rate being identical for both sexes.[33]
During the 2008/09 school year there were 1,502,257 students in the entire Swiss educational system. In kindergarten or pre-school, there were 152,919 students (48.6% female). These students were taught by 13,592 teachers (96.0% female) in 4,949 schools, of which 301 were private schools. There were 777,394 students (48.6% female) in the obligatory schools, which include primary and lower secondary schools. These students were taught by 74,501 teachers (66.3% female) in 6,083 schools, of which 614 were private. The upper secondary school system had 337,145 students (46.9% female). They were taught by 13,900 teachers (42.3% female) in 730 schools, of which 240 were private. The tertiary education system had 234,799 students (49.7% female). They were taught by 37,546 teachers (32.8% female) in 367 schools.[34]
Regional disparities
| Cantons | Tax index for all Federal, Cantonal and Church Taxes (Switzerland = 100.0) 2006 | Tax rate (% of total income) for a married couple with two children and 50,000CHF in income 2006 | Tax rate (% of total income) for a married couple with two children and 150,000CHF in income 2006 | Population under 20 as a percentage of total population aged 20–64 2007 | National Income per person in CHF 2005 | Change in National Income per person 2003-2005 |
|---|---|---|---|---|---|---|
| 100 | 2.36 | 11.56 | 34.59 | 54,031 | 5.3 | |
| 82.9 | 2.16 | 8.65 | 31.12 | 68,803 | 4.6 | |
| 123.1 | 2.14 | 13.91 | 33.05 | 45,643 | 5 | |
| 119 | 3.47 | 12.56 | 37.19 | 43,910 | 5.3 | |
| 144.2 | 4.54 | 12.42 | 37.06 | 45,711 | 5.3 | |
| 66.5 | 2.26 | 6.98 | 36.95 | 50,170 | 6.3 | |
| 146.5 | 4.14 | 11.53 | 40.88 | 39,645 | 4.7 | |
| 79.1 | 2.31 | 9.41 | 34.55 | 73,285 | 15.6 | |
| 134.8 | 4.62 | 12.56 | 36.85 | 73,236 | 10.9 | |
| 50.3 | 0.47 | 5.5 | 35.45 | 93,752 | 5.4 | |
| 126.4 | 2.33 | 12.74 | 40.2 | 39,559 | 2.6 | |
| 116.9 | 2.36 | 12.95 | 34.34 | 46,844 | 4.9 | |
| 113.1 | 1.01 | 14.3 | 26.6 | 115,178 | 15.9 | |
| 92.5 | 2.12 | 12.4 | 33 | 53,501 | 3.9 | |
| 114.6 | 2.94 | 11.62 | 32.92 | 55,125 | 5.4 | |
| 121.7 | 3.8 | 12.06 | 37.6 | 44,215 | 4.7 | |
| 105.6 | 3.18 | 9.88 | 44.46 | 45,936 | 7.4 | |
| 115.5 | 2.53 | 12.68 | 37.66 | 44,866 | 4 | |
| 112.2 | 2.99 | 11.51 | 33.97 | 49,355 | 11.7 | |
| 87.4 | 1.52 | 10.4 | 34.9 | 49,209 | 2.5 | |
| 86.6 | 0.34 | 11.48 | 37.52 | 44,918 | 3.2 | |
| 64.6 | 0.24 | 9.04 | 31.14 | 41,335 | 3.4 | |
| 106.2 | 0.42 | 12.2 | 37.87 | 52,901 | 3.4 | |
| 121.3 | 2.72 | 10.68 | 35.18 | 38,385 | 6 | |
| 137.1 | 3.8 | 15.96 | 38.06 | 49,775 | 6.6 | |
| 89.8 | 0.05 | 11.81 | 35.4 | 62,839 | 5.1 | |
| 126.6 | 2.87 | 15.26 | 40.09 | 38,069 | 6.4 |
- Source:[35]
Crime
The police registered a total of 553,421 criminal offences in 2009, including 51 killings and 185 attempted murders. There were 616 cases of rape. In the same year, 94,574 adults (85% of them male, 47.4% of them Swiss citizens) were convicted under criminal law. 57.3% of convictions were for traffic offences.[36]
In the same year, 15,064 minors (78.3% of them male, 68.2% of them of Swiss nationality, 76.3% aged between 15 and 18) were convicted.[37]
The number of convicted persons is given in the following tables.[38] Each class of crime references the relevant section of the Strafgesetzbuch (Criminal Code, abbreviated as StGB in German), or Betäubungsmittelgesetz (abbr. BetmG, Narcotics Act), or the Strassenverkehrsgesetz (abbr. SVG, Swiss Traffic Regulations).
| Year | Total Convicted Adults | Homicide (Art. 111,112,113,116 StGB) | Serious Bodily Injury (Art. 122 StGB) | Minor Bodily Injury (Art. 123 StGB) | Sexual Contact with Children (Art. 187 StGB) | Rape (Art. 190 StGB) | Theft (Art. 139 StGB) | Robbery (Art. 140 StGB) | Receiving Stolen Goods (Art. 160 StGB) | Embezzlement (Art. 138 StGB) | Fraud (Art. 146 StGB) | Narcotics Possession | Major Violation of Traffic Laws (Art. 90 Abs. 1&2 SVG) | Impaired Driving (Art. 91 SVG) |
|---|---|---|---|---|---|---|---|---|---|---|---|---|---|---|
| 2005 | 26,199 | 105 | 95 | 2,439 | 416 | 110 | 5,967 | 497 | 1,249 | 906 | 1,469 | 5,510 | 22,015 | 16,466 |
| 2006 | 26,583 | 116 | 105 | 2,537 | 388 | 135 | 5,933 | 565 | 1,186 | 876 | 1,516 | 5,403 | 21,535 | 21,058 |
| 2007 | 24,265 | 105 | 94 | 2,262 | 386 | 139 | 5,502 | 524 | 930 | 805 | 1,597 | 5,090 | 21,294 | 20,108 |
| 2008 | 26,327 | 107 | 134 | 2,632 | 412 | 135 | 5,756 | 525 | 909 | 854 | 1,660 | 5,387 | 25,265 | 20,600 |
| 2009 | 27,727 | 103 | 129 | 2,655 | 388 | 129 | 6,449 | 533 | 941 | 859 | 1,566 | 5,533 | 25,557 | 19,711 |
| 2010 | 28,691 | 94 | 149 | 2,677 | 334 | 128 | 6,659 | 593 | 905 | 784 | 1,750 | 6,125 | 25,983 | 20,591 |
| 2011 | 29,128 | 82 | 127 | 2,721 | 274 | 86 | 6,950 | 442 | 1,007 | 716 | 1,767 | 4,710 | 23,590 | 18,882 |
| 2012 | 33,925 | 116 | 179 | 2,845 | 293 | 108 | 8,936 | 511 | 1,332 | 745 | 1,971 | 5,734 | 22,906 | 18,396 |
| 2013 | 35,325 | 114 | 178 | 2,843 | 317 | 98 | 9,491 | 654 | 1,433 | 670 | 2,307 | 6,070 | 22,277 | 17,465 |
| 2014a | 32,911 | 99 | 197 | 2,617 | 288 | 77 | 8,335 | 520 | 1,112 | 646 | 2,153 | 6,164 | 24,263 | 17,041 |
- ^a 2014 conviction numbers may not include convictions overturned on appeal.
- ^ Due to privacy protection laws some convictions are not included.
| Year | Total Convicted Minors | Homicide (Art. 111,112,113,116 StGB) | Serious Bodily Injury (Art. 122 StGB) | Minor Bodily Injury (Art. 123 StGB) | Sexual Contact with Children (Art. 187 StGB) | Rape (Art. 190 StGB) | Theft (Art. 139 StGB) | Robbery (Art. 140 StGB) | Receiving Stolen Goods (Art. 160 StGB) | Embezzlement (Art. 138 StGB) | Fraud (Art. 146 StGB) | Narcotics Possession | Major Violation of Traffic Laws (Art. 90 Abs. 1&2 SVG) | Impaired Driving (Art. 91 SVG) |
|---|---|---|---|---|---|---|---|---|---|---|---|---|---|---|
| 2005 | 7,580 | 7 | 10 | 634 | 73 | 14 | 3,528 | 375 | 400 | 34 | 65 | 918 | 124 | 180 |
| 2006 | 7,769 | 7 | 22 | 644 | 118 | 19 | 3,418 | 330 | 390 | 35 | 51 | 1,019 | 126 | 189 |
| 2007 | 6,910 | 6 | 21 | 699 | 101 | 19 | 2,189 | 285 | 285 | 21 | 47 | 680 | 116 | 141 |
| 2008 | 6,975 | 4 | 24 | 688 | 80 | 17 | 1,998 | 334 | 272 | 17 | 57 | 560 | 101 | 125 |
| 2009 | 6,931 | 6 | 24 | 665 | 73 | 5 | 2,033 | 365 | 311 | 19 | 57 | 600 | 142 | 105 |
| 2010 | 7,613 | 13 | 36 | 770 | 71 | 17 | 2,410 | 413 | 242 | 19 | 51 | 565 | 119 | 141 |
| 2011 | 5,427 | 2 | 31 | 553 | 65 | 5 | 1,585 | 256 | 153 | 10 | 49 | 507 | 138 | 152 |
| 2012 | 5,070 | 2 | 34 | 476 | 71 | 8 | 1,620 | 303 | 164 | 25 | 56 | 554 | 74 | 124 |
| 2013 | 5,199 | 3 | 32 | 407 | 75 | 21 | 1,666 | 325 | 166 | 27 | 90 | 690 | 72 | 95 |
| 2014 | 4,849a | 1 | 33 | 380 | 63 | 8 | 1,375 | 231 | 159 | 24 | 70 | 817 | 86 | 124 |
Major cities
See also
- List of Swiss people
- Switzerland
- Immigration to Europe
- List of countries by immigrant population
- Politics of Switzerland
- Poverty in Switzerland
- Metropolitan areas in Switzerland
- Albanians in Switzerland
- Italian immigration to Switzerland
Notes and references
- "Bevölkerungsbestand am Ende des 2. Quartal 2019" [Recent monthly and quarterly figures: provisional data] (XLS) (official statistics) (in German, French, and Italian). Neuchâtel, Switzerland: Swiss Federal Statistical Office (FSO), Swiss Confederation. 19 September 2019. 1155-1500. Retrieved 20 September 2019.
- "Life expectancy - Federal Statistical Office". Retrieved 9 September 2020.
- "Switzerland". cia.gov. Retrieved 3 January 2017.
- "Bevölkerungsbestand am Ende des 1. Quartal 2019" [Recent monthly and quarterly figures: provisional data] (XLS) (official statistics) (in German, French, and Italian). Neuchâtel, Switzerland: Swiss Federal Statistical Office (FSO), Swiss Confederation. 27 June 2019. 1155-1500. Retrieved 15 August 2019.
- with the exceptions of the censuses of 1888 and 1941.
- History of the Federal Population Census, Swiss Federal Statistical Office, accessed October 2007
- Overview of the Federal Population Census Archived 15 November 2012 at the Wayback Machine, Swiss Federal Statistical Office, accessed October 2007
- Die Bevölkerung der Schweiz 2015 BFS 348-1500, 22 November 2016. Swiss Federal Statistics Office (2009). "Struktur der ständigen Wohnbevölkerung". Archived from the original (Microsoft Excel) on 15 November 2010. Retrieved 25 August 2010. Head-König, Anne-Lise in Population in German, French and Italian in the online Historical Dictionary of Switzerland.
- "Resident Population in Switzerland 2008" (PDF) (Press release). Swiss Federal Statistical Office. 27 August 2009. Retrieved 28 January 2009. (in English)
- Swiss Federal Statistics Office
- Max Roser (2014), "Total Fertility Rate around the world over the last centuries", Our World In Data, Gapminder Foundation
- United Nations Demographic Yearbooks
- "Statistik Schweiz". Archived from the original on 7 February 2011. Retrieved 19 February 2011.
- "Population". Federal Statistical Office of Switzerland. Retrieved 21 January 2021.
- "Ufficio federala di statistica". STAT-TAB. Statistica Svizzera. Retrieved 21 January 2021.
- Swiss Federal Statistics Office (2014). "Ständige Wohnbevölkerung nach Alter und Geschlecht". Archived from the original (Microsoft Excel) on 15 November 2010. Retrieved 14 July 2016.
- Kohli, Raymond (June 2015). Szenarien zur Bevölkerungsentwicklung der Schweiz 2015–2045 (Report). Swiss Federal Statistical Office. Retrieved 14 July 2016.
- "Life expectancy - Federal Statistical Office". Retrieved 9 September 2020.
- "Life expectancy". Our World in Data. Retrieved 28 August 2018.
- "World Population Prospects – Population Division – United Nations". Retrieved 15 July 2017.
- Bevölkerung - Die wichtigsten Zahlen Archived 27 September 2014 at the Wayback Machine Swiss Federal Statistical Office, accessed 6 October 2014
- Ständige ausländische Wohnbevölkerung nach Staatsangehörigkeit, 1980-2017 Swiss Federal Statistical Office, accessed 6 November 2018
- Swiss Federal Statistics Office
- Federal Office of Statistics - Erwerb des Schweizer Bürgerrechts nach früherer Staatsangehörigkeit accessed 17 October 2014
- https://www.bfs.admin.ch/bfs/de/home/statistiken/bevoelkerung/migration-integration/auslaendische-bevoelkerung.assetdetail.5866926.html
- "Switzerland Population 2018", World Population Review
- "World Factbook EUROPE : SWITZERLAND", The World Factbook, 12 July 2018
 This article incorporates text from this source, which is in the public domain.
 - "Population résidante permanente âgée de 15 ans ou plus selon l'appartenance religieuse" (XLS) (in French). Swiss Central Statistical Office. 2 March 2018.
- "Die Kirchensteuern August 2013" (in German, French, and Italian). Berne: Schweizerische Steuerkonferenz SSK, Swiss Federal Tax Administration FTA, Federal Department of Finance FDF. 2013. Archived from the original (PDF) on 25 January 2012. Retrieved 5 April 2014., Swiss Federal Tax Administration
- available at EU Public Opinion Survey Archived 24 May 2006 at the Wayback Machine
- Swiss Federal Statistical Office FSO. 31 January 2017
- "Die zehn häufigsten Hauptsprachen der ständigen Wohnbevölkerung (The ten most common main languages of the population)". bfs.admin.ch. Swiss Federal Statistical Office. 2017. Retrieved 8 October 2019.
These statistics allow a respondent to list multiple main languages. Swiss population in 2017 was 8.3 million, but the totals of main languages was 9.9 million.
- CIA - The World Factbook -- Switzerland
- Swiss Federal Statistical Office Ueberblick - Schulstufen (in German) accessed 15 November 2010
- Regionale Disparitäten in der Schweiz - Schlüsselindikatoren Archived 14 June 2013 at the Wayback Machine (in German and French) accessed 20 December 2011
- Swiss Federal Statistical Office Verurteilungen (Erwachsene) - Daten, Indikatoren - Demographische Merkmale der Verurteilten Archived 4 December 2007 at the Wayback Machine (in German) accessed 14 November 2010
- Swiss Federal Statistical Office Jugendstrafurteile - Daten, Indikatoren (in German) accessed 15 November 2010
- Kriminalität, Strafvollzug – Daten, Indikatoren: Verurteile Personen: Jugendliche und Erwachsene (in German) accessed 5 April 2016
- "Ständige und nichtständige Wohnbevölkerung nach institutionellen Gliederungen, Geburtsort und Staatsangehörigkeit". bfs.admin.ch (in German). Swiss Federal Statistical Office - STAT-TAB. 31 December 2019. Retrieved 6 October 2020.
External links
| Wikimedia Commons has media related to Demographics of Switzerland. |
.svg.png.webp)