Demographics of Spain
As of 1 January 2020, Spain had a total population of 47,431,256, which represents a 0.9% increase since 2019.[1] The modern Kingdom of Spain results from the accretion of several independent Iberian realms, like León, Castile, Navarre, the Crown of Aragon, and Granada, among others.
.svg.png.webp)
| Year | Pop. | ±% |
|---|---|---|
| 1833 | 12,286,941 | — |
| 1846 | 12,162,872 | −1.0% |
| 1857 | 15,464,340 | +27.1% |
| 1877 | 16,622,175 | +7.5% |
| 1887 | 17,549,608 | +5.6% |
| 1900 | 18,616,630 | +6.1% |
| 1910 | 19,990,669 | +7.4% |
| 1920 | 21,388,551 | +7.0% |
| 1930 | 23,677,095 | +10.7% |
| 1940 | 26,014,278 | +9.9% |
| 1950 | 28,117,873 | +8.1% |
| 1960 | 30,582,936 | +8.8% |
| 1970 | 33,956,047 | +11.0% |
| 1981 | 37,683,363 | +11.0% |
| 1991 | 38,872,268 | +3.2% |
| 2001 | 40,847,371 | +5.1% |
| 2011 | 46,815,916 | +14.6% |
| 2020 | 47,431,256 | +1.3% |
| Source: INE | ||
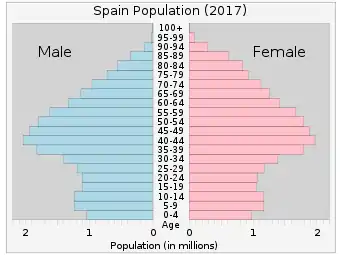
Spain's population peaked in 2019, surpassing for the first time in history 47 million inhabitants. As of January 2020, there were already 47,431,256 people living in Spain.[2] Its population density, at 91.4 inhabitants per square kilometre (237/sq mi), is lower than other Western European countries yet, with the exception of microstates, it has the highest real density population in Europe, based on density of inhabited areas.[3] With the exception of the capital Madrid, the most densely populated areas lie around the coast.
The population of Spain doubled during the twentieth century, but the pattern of growth was extremely uneven due to large-scale internal migration from the rural interior to the industrial cities. Eleven of Spain's fifty provinces saw an absolute decline in population over the century.
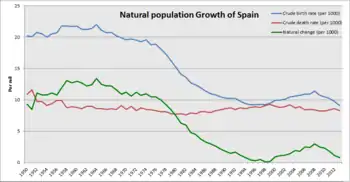
The last quarter of the century saw a dramatic fall in birth rates. Spain's fertility rate of 1.47 (the number of children the average woman will have during her lifetime) has climbed every year since the late 1990s. The birth rate has climbed in 10 years from 9.10 births per 1000 people per year in 1996 to 10.9 in 2006.
Immigration and Demographic Issues
The population of Spain doubled during the twentieth century as a result of the demographic boom in the 1960s and early 1970s. After that time, the birth rate fell during the 1980s and Spain's population became stalled.
Many demographers have linked Spain's very low fertility rate to the country's lack of a family support policy. Spain spends the least on family support out of all western European countries—0.5% of GDP. A graphic illustration of the enormous social gulf in this field is the fact that a Spanish family would need to have 57 children to enjoy the same financial support as a family with 3 children in Luxembourg.
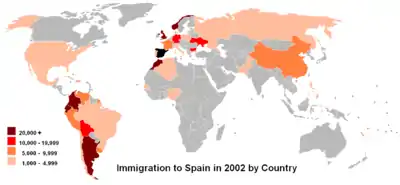
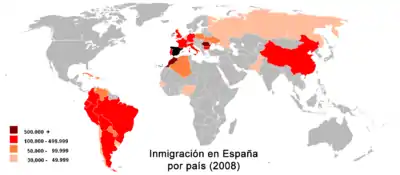
In terms of emigration vs. immigration, after centuries of net emigration, Spain has experienced large-scale immigration for the first time in modern history. According to the Spanish government there were 5,730,667 foreign residents in Spain as of January 2011. Of these, more than 860,000 were Romanian, and half 760,000 were Moroccan while the number of Ecuadorians was around 390,000. Colombian population amounted to around 300,000. There are also a significant number of British (359,076 as of 2011, but more than one million are estimated to live permanently in Spain) and German (195,842) citizens, mainly in Alicante, Málaga provinces, Balearic Islands and Canary Islands. Chinese number over 166,000. Immigrants from several sub-Saharan African countries have also settled in Spain as contract workers, although they represent only 4.08% of all the foreign residents in the country.
During the early 2000s, the mean year-on-year demographic growth set a new record with its 2003 peak variation of 2.1%, doubling the previous record reached back in the 1960s when a mean year-on-year growth of 1% was experienced.[4] In 2005 alone, the immigrant population of Spain increased by 700,000 people.[5]
The arrival of migrating young adults was the main reason for the slight increase in Spain's fertility rate.[6] From 2002 through 2008 the Spanish population grew by 8%, of which 7% were foreign.[7]
Immigrants by country of birth as of 2019:[8]
| Country | Population |
|---|---|
| 874,902 | |
| 585,493 | |
| 323,827 | |
| 440,540 | |
| 408,241 | |
| 218,245 | |
| 167,771 | |
| 206,989 | |
| 256,386 | |
| 202,093 | |
| 268,292 | |
| 179,625 | |
| 106,113 | |
| 174,801 | |
| 151,423 | |
| 113,668 | |
| 135,020 | |
| 94,319 | |
| 91,864 | |
| 111,469 | |
| 73,333 | |
| 143,416 | |
| 97,695 | |
| 91,762 | |
| 78,195 | |
Vital statistics
Notable events in modern Spanish demography:
- Late 19th century and early 20th century: Relative economic stagnation and mass emigration to American countries.
- 1918. Flu pandemic, over 200,000 dead in Spain.
- 1936. Start of the Spanish Civil War.
- 1939. End of the Civil War. Establishment of a Fascist dictatorship, Start of rationing policies. Deepening of economic depression, mass emigration to European and American countries due to economic and political motives (Republican exile).
- 1941. Approval of benefits for large families, with at least four children.[9]
- 1945. Establishment of tax deductions for parents.[10]
- 1952. End of rationing policies.
- 1975. End of the dictatorship, mass return of emigrated people.
- 1977. Legalization of contraception. Decline of birth rates.
- 1985. Legalization of abortion.
- 1988. After centuries of outwards emigration, the first events of illegal immigration from Africa occur.[11]
- 1991. Spain becomes a net receiver of immigrants, after decades of mass emigration.[12]
- 1994. Lowering of threshold of requirements to become a large family, only three children needed.[9]
- 2007. Approval of €2,500 benefit for births.
- 2010. Legalization of abortion on demand.
- 2011. Withdrawal of the €2,500 benefit for births.
- 2015. First negative natural change since the Civil War due to the aging of Spanish population.
Life expectancy from 1882 to 2015
Sources: Our World In Data and the United Nations.
1882-1950
| Years | 1882 | 1892 | 1900 | 1908 | 1909 | 1910 | 1911 | 1912 | 1913 | 1914 | 1915 | 1916 | 1917 | 1918 | 1919 | 1920[13] |
|---|---|---|---|---|---|---|---|---|---|---|---|---|---|---|---|---|
| Life expectancy in Spain | 29.5 | 32.1 | 34.8 | 41.3 | 41.0 | 40.8 | 39.7 | 43.4 | 42.5 | 42.8 | 43.0 | 42.9 | 42.5 | 30.3 | 41.1 | 39.2 |
| Years | 1921 | 1922 | 1923 | 1924 | 1925 | 1926 | 1927 | 1928 | 1929 | 1930[13] |
|---|---|---|---|---|---|---|---|---|---|---|
| Life expectancy in Spain | 42.0 | 44.1 | 44.7 | 46.2 | 46.9 | 47.7 | 48.4 | 48.6 | 49.3 | 49.3 |
| Years | 1931 | 1932 | 1933 | 1934 | 1935 | 1936 | 1937 | 1938 | 1939 | 1940[13] |
|---|---|---|---|---|---|---|---|---|---|---|
| Life expectancy in Spain | 49.2 | 51.1 | 51.5 | 52.3 | 52.6 | 51.0 | 47.3 | 47.6 | 47.2 | 48.4 |
| Years | 1941 | 1942 | 1943 | 1944 | 1945 | 1946 | 1947 | 1948 | 1949 | 1950[13] |
|---|---|---|---|---|---|---|---|---|---|---|
| Life expectancy in Spain | 47.2 | 52.5 | 54.8 | 56.2 | 57.8 | 57.5 | 59.3 | 61.2 | 61.0 | 61.8 |
1950-2015
| Period | Life expectancy in Years |
Period | Life expectancy in Years |
|---|---|---|---|
| 1950–1955 | 64.6 | 1985–1990 | 76.9 |
| 1955–1960 | 67.8 | 1990–1995 | 77.6 |
| 1960–1965 | 69.9 | 1995–2000 | 78.8 |
| 1965–1970 | 71.4 | 2000–2005 | 79.9 |
| 1970–1975 | 72.7 | 2005–2010 | 81.2 |
| 1975–1980 | 74.4 | 2010–2015 | 82.5 |
| 1980–1985 | 76.1 |
Source: UN World Population Prospects[14]
Total Fertility Rate from 1850 to 1899
The total fertility rate is the number of children born per woman. It is based on fairly good data for the entire period. Sources: Our World In Data and Gapminder Foundation.[15]
| Years | 1850 | 1851 | 1852 | 1853 | 1854 | 1855 | 1856 | 1857 | 1858 | 1859 | 1860[15] |
|---|---|---|---|---|---|---|---|---|---|---|---|
| Total Fertility Rate in Spain | 5.13 | 5.07 | 5.01 | 4.95 | 4.89 | 4.83 | 4.78 | 4.72 | 4.66 | 4.75 | 4.86 |
| Years | 1861 | 1862 | 1863 | 1864 | 1865 | 1866 | 1867 | 1868 | 1869 | 1870[15] |
|---|---|---|---|---|---|---|---|---|---|---|
| Total Fertility Rate in Spain | 5.16 | 5.09 | 5 | 5.19 | 5.11 | 5.07 | 5.09 | 4.72 | 4.9 | 4.84 |
| Years | 1871 | 1872 | 1873 | 1874 | 1875 | 1876 | 1877 | 1878 | 1879 | 1880[15] |
|---|---|---|---|---|---|---|---|---|---|---|
| Total Fertility Rate in Spain | 4.83 | 4.83 | 4.82 | 4.81 | 4.8 | 4.79 | 4.78 | 4.78 | 4.74 | 4.7 |
| Years | 1881 | 1882 | 1883 | 1884 | 1885 | 1886 | 1887 | 1888 | 1889 | 1890[15] |
|---|---|---|---|---|---|---|---|---|---|---|
| Total Fertility Rate in Spain | 4.91 | 4.79 | 4.71 | 4.86 | 4.8 | 4.86 | 4.78 | 4.82 | 4.82 | 4.55 |
| Years | 1891 | 1892 | 1893 | 1894 | 1895 | 1896 | 1897 | 1898 | 1899[15] |
|---|---|---|---|---|---|---|---|---|---|
| Total Fertility Rate in Spain | 4.67 | 4.71 | 4.71 | 4.6 | 4.63 | 4.75 | 4.51 | 4.41 | 4.53 |
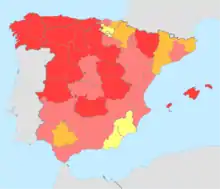
Statistics since 1900
|
1.5 - 1.7
1.4 - 1.5
1.3 - 1.4
< 1.3 |
| [16][17][15] | Average population | Live births | Deaths | Natural change | Crude birth rate (per 1000) | Crude death rate (per 1000) | Natural change (per 1000) | Total fertility rates[fn 1][15] |
|---|---|---|---|---|---|---|---|---|
| 1900 | 18,520,000 | 627,848 | 536,716 | 91,132 | 33.9 | 29.0 | 4.9 | 4.49 |
| 1901 | 18,610,000 | 650,649 | 517,575 | 133,074 | 35.0 | 27.8 | 7.1 | 4.71 |
| 1902 | 18,720,000 | 666,687 | 488,289 | 178,398 | 35.6 | 26.1 | 9.6 | 4.70 |
| 1903 | 18,810,000 | 685,265 | 470,387 | 214,878 | 36.4 | 25.0 | 11.4 | 4.68 |
| 1904 | 18,980,000 | 649,878 | 486,889 | 162,989 | 34.2 | 25.7 | 8.6 | 4.67 |
| 1905 | 19,110,000 | 670,651 | 491,369 | 179,282 | 35.1 | 25.7 | 9.4 | 4.66 |
| 1906 | 19,250,000 | 650,385 | 499,018 | 151,367 | 33.8 | 25.9 | 7.8 | 4.61 |
| 1907 | 19,380,000 | 646,371 | 472,007 | 174,364 | 33.3 | 24.4 | 9.0 | 4.57 |
| 1908 | 19,530,000 | 658,008 | 460,946 | 197,062 | 33.7 | 23.6 | 10.1 | 4.52 |
| 1909 | 19,670,000 | 650,498 | 466,648 | 183,850 | 33.1 | 23.7 | 9.3 | 4.48 |
| 1910 | 19,770,000 | 646,975 | 456,158 | 190,817 | 32.7 | 23.1 | 9.7 | 4.43 |
| 1911 | 19,950,000 | 628,443 | 466,525 | 161,918 | 31.5 | 23.4 | 8.1 | 4.39 |
| 1912 | 20,040,000 | 637,860 | 426,297 | 211,563 | 31.8 | 21.3 | 10.6 | 4.35 |
| 1913 | 20,170,000 | 617,850 | 449,349 | 168,501 | 30.6 | 22.3 | 8.4 | 4.30 |
| 1914 | 20,310,000 | 608,207 | 450,340 | 157,867 | 29.9 | 22.2 | 7.8 | 4.26 |
| 1915 | 20,430,000 | 631,462 | 452,479 | 178,983 | 30.9 | 22.1 | 8.8 | 4.22 |
| 1916 | 20,610,000 | 599,011 | 441,673 | 157,338 | 29.1 | 21.4 | 7.6 | 4.20 |
| 1917 | 20,740,000 | 602,139 | 465,722 | 136,417 | 29.0 | 22.5 | 6.6 | 4.19 |
| 1918 | 20,910,000 | 612,637 | 695,758 | -83,121 | 29.3 | 33.3 | -4.0 | 4.17 |
| 1919 | 21,000,000 | 585,963 | 482,752 | 103,211 | 27.9 | 23.0 | 4.9 | 4.16 |
| 1920 | 21,130,000 | 623,339 | 494,540 | 128,799 | 29.5 | 23.4 | 6.1 | 4.14 |
| 1921 | 21,270,000 | 648,892 | 455,469 | 193,423 | 30.5 | 21.4 | 9.1 | 4.08 |
| 1922 | 21,510,000 | 656,093 | 441,330 | 214,763 | 30.5 | 20.5 | 10.0 | 4.02 |
| 1923 | 21,740,000 | 662,576 | 449,683 | 212,893 | 30.5 | 20.7 | 9.8 | 4.02 |
| 1924 | 21,990,000 | 653,085 | 430,590 | 222,495 | 29.7 | 19.6 | 10.1 | 3.92 |
| 1925 | 22,160,000 | 644,741 | 432,400 | 212,341 | 29.1 | 19.5 | 9.6 | 3.82 |
| 1926 | 22,400,000 | 663,401 | 420,838 | 242,563 | 29.6 | 18.8 | 10.8 | 3.87 |
| 1927 | 22,610,000 | 636,028 | 419,816 | 216,212 | 28.1 | 18.6 | 9.6 | 3.70 |
| 1928 | 22,860,000 | 666,240 | 413,002 | 253,238 | 29.1 | 18.1 | 11.1 | 3.80 |
| 1929 | 23,120,000 | 653,668 | 407,486 | 246,182 | 28.3 | 17.6 | 10.7 | 3.69 |
| 1930 | 23,340,000 | 660,860 | 394,488 | 266,372 | 28.3 | 16.9 | 11.4 | 3.68 |
| 1931 | 23,510,000 | 649,276 | 408,977 | 240,299 | 27.6 | 17.4 | 10.2 | 3.58 |
| 1932 | 23,897,000 | 670,670 | 388,900 | 281,770 | 28.3 | 16.5 | 11.8 | 3.64 |
| 1933 | 24,122,000 | 667,866 | 394,750 | 273,116 | 27.9 | 16.5 | 11.4 | 3.59 |
| 1934 | 24,349,000 | 641,889 | 392,793 | 249,096 | 26.4 | 16.1 | 10.2 | 3.38 |
| 1935 | 24,578,000 | 636,725 | 388,757 | 247,968 | 25.9 | 15.8 | 10.1 | 3.31 |
| 1936 | 24,810,000 | 617,220 | 417,108 | 200,112 | 24.9 | 16.8 | 8.1 | 3.18 |
| 1937 | 25,043,000 | 568,977 | 475,310 | 93,667 | 22.7 | 19.0 | 3.7 | 2.89 |
| 1938 | 25,279,000 | 508,726 | 487,546 | 21,180 | 20.1 | 19.3 | 0.8 | 2.56 |
| 1939 | 25,517,000 | 422,345 | 472,611 | -50,266 | 16.6 | 18.5 | -2.0 | 2.12 |
| 1940 | 25,757,000 | 631,285 | 428,416 | 202,869 | 24.5 | 16.6 | 7.9 | 3.09 |
| 1941 | 25,999,000 | 511,157 | 487,748 | 23,409 | 19.7 | 18.8 | 0.9 | 2.47 |
| 1942 | 26,244,000 | 530,845 | 387,844 | 143,001 | 20.2 | 14.8 | 5.4 | 2.53 |
| 1943 | 26,491,000 | 606,971 | 352,587 | 254,384 | 22.9 | 13.3 | 9.6 | 2.88 |
| 1944 | 26,620,000 | 602,091 | 349,114 | 253,796 | 22.6 | 13.1 | 9.5 | 2.84 |
| 1945 | 26,770,000 | 621,558 | 330,581 | 290,977 | 23.2 | 12.3 | 10.9 | 2.91 |
| 1946 | 27,030,000 | 585,381 | 353,371 | 232,010 | 21.7 | 13.1 | 8.6 | 2.70 |
| 1947 | 27,150,000 | 588,732 | 330,341 | 258,391 | 21.7 | 12.2 | 9.5 | 2.67 |
| 1948 | 27,593,000 | 642,041 | 305,310 | 336,731 | 23.3 | 11.1 | 12.2 | 2.88 |
| 1949 | 27,811,000 | 601,759 | 321,541 | 280,218 | 21.6 | 11.6 | 10.1 | 2.68 |
| 1950 | 28,009,000 | 565,378 | 305,934 | 259,444 | 20.2 | 10.9 | 9.3 | 2.45 |
| 1951 | 28,236,000 | 567,474 | 327,236 | 240,238 | 20.1 | 11.6 | 8.5 | 2.47 |
| 1952 | 28,474,000 | 593,019 | 276,735 | 316,284 | 20.8 | 9.7 | 11.1 | 2.51 |
| 1953 | 28,713,000 | 589,188 | 278,522 | 310,666 | 20.5 | 9.7 | 10.8 | 2.55 |
| 1954 | 28,955,000 | 577,886 | 264,668 | 313,218 | 20.0 | 9.1 | 10.8 | 2.59 |
| 1955 | 29,199,000 | 598,970 | 274,188 | 324,782 | 20.5 | 9.4 | 11.1 | 2.62 |
| 1956 | 29,445,000 | 608,121 | 290,410 | 317,711 | 20.7 | 9.9 | 10.8 | 2.66 |
| 1957 | 29,693,000 | 646,784 | 293,502 | 353,282 | 21.8 | 9.9 | 11.9 | 2.69 |
| 1958 | 29,943,000 | 653,216 | 260,683 | 392,533 | 21.8 | 8.7 | 13.1 | 2.72 |
| 1959 | 30,195,000 | 654,474 | 269,591 | 384,883 | 21.7 | 8.9 | 12.7 | 2.74 |
| 1960 | 30,455,000 | 663,375 | 268,941 | 394,434 | 21.8 | 8.8 | 13.0 | 2.77 |
| 1961 | 30,744,000 | 654,616 | 263,441 | 391,175 | 21.3 | 8.6 | 12.7 | 2.79 |
| 1962 | 31,067,000 | 658,816 | 278,575 | 380,241 | 21.2 | 9.0 | 12.2 | 2.8 |
| 1963 | 31,393,000 | 671,520 | 282,460 | 389,060 | 21.4 | 9.0 | 12.4 | 2.88 |
| 1964 | 31,723,000 | 697,697 | 273,955 | 423,742 | 22.0 | 8.6 | 13.4 | 3.01 |
| 1965 | 32,056,000 | 676,361 | 274,271 | 402,090 | 21.1 | 8.6 | 12.5 | 2.94 |
| 1966 | 32,394,000 | 669,919 | 276,173 | 393,746 | 20.7 | 8.5 | 12.2 | 2.91 |
| 1967 | 32,734,000 | 680,125 | 280,494 | 399,631 | 20.8 | 8.6 | 12.2 | 2.85 |
| 1968 | 33,079,000 | 667,311 | 282,628 | 384,683 | 20.2 | 8.5 | 11.6 | 2.86 |
| 1969 | 33,427,000 | 666,568 | 303,402 | 363,166 | 19.9 | 9.1 | 10.9 | 2.87 |
| 1970 | 33,779,000 | 663,667 | 286,067 | 377,600 | 19.6 | 8.5 | 11.2 | 2.88 |
| 1971 | 34,216,000 | 672,092 | 308,516 | 363,576 | 19.7 | 9.0 | 10.6 | 2.88 |
| 1972 | 34,572,000 | 672,405 | 285,508 | 386,897 | 19.5 | 8.3 | 11.2 | 2.86 |
| 1973 | 34,921,000 | 672,963 | 301,803 | 371,160 | 19.3 | 8.7 | 10.7 | 2.84 |
| 1974 | 35,288,000 | 688,711 | 300,403 | 388,308 | 19.6 | 8.5 | 11.0 | 2.89 |
| 1975 | 35,688,000 | 669,378 | 298,192 | 371,186 | 18.8 | 8.4 | 10.5 | 2.75 |
| 1976 | 36,118,000 | 677,456 | 299,007 | 378,449 | 18.9 | 8.3 | 10.5 | 2.68 |
| 1977 | 36,564,000 | 656,357 | 294,324 | 362,033 | 18.1 | 8.1 | 10.0 | 2.59 |
| 1978 | 36,741,000 | 636,892 | 296,781 | 340,111 | 17.3 | 8.1 | 9.2 | 2.48 |
| 1979 | 37,289,000 | 601,992 | 291,213 | 310,779 | 16.2 | 7.8 | 8.4 | 2.36 |
| 1980 | 37,527,000 | 571,018 | 289,344 | 281,674 | 15.2 | 7.7 | 7.5 | 2.22 |
| 1981 | 37,741,000 | 533,008 | 293,386 | 239,622 | 14.1 | 7.8 | 6.3 | 2.09 |
| 1982 | 37,942,000 | 515,706 | 286,655 | 229,051 | 13.6 | 7.6 | 6.0 | 1.96 |
| 1983 | 38,122,000 | 485,352 | 302,569 | 182,783 | 12.7 | 7.9 | 4.8 | 1.84 |
| 1984 | 38,279,000 | 473,281 | 299,409 | 173,872 | 12.4 | 7.8 | 4.5 | 1.73 |
| 1985 | 38,419,000 | 456,298 | 312,532 | 143,766 | 11.9 | 8.1 | 3.7 | 1.64 |
| 1986 | 38,536,000 | 438,750 | 310,413 | 128,337 | 11.4 | 8.1 | 3.3 | 1.56 |
| 1987 | 38,631,000 | 426,782 | 310,073 | 116,709 | 11.0 | 8.0 | 3.0 | 1.50 |
| 1988 | 38,716,000 | 418,919 | 319,437 | 99,482 | 10.8 | 8.3 | 2.6 | 1.45 |
| 1989 | 38,792,000 | 408,434 | 324,796 | 83,638 | 10.5 | 8.4 | 2.2 | 1.40 |
| 1990 | 38,851,000 | 401,425 | 333,142 | 68,283 | 10.3 | 8.6 | 1.8 | 1.36 |
| 1991 | 38,940,000 | 395,989 | 337,691 | 58,298 | 10.2 | 8.7 | 1.5 | 1.33 |
| 1992 | 39,068,000 | 396,747 | 331,515 | 65,232 | 10.2 | 8.5 | 1.7 | 1.32 |
| 1993 | 39,190,000 | 385,786 | 339,661 | 46,125 | 9.8 | 8.7 | 1.2 | 1.26 |
| 1994 | 39,295,000 | 370,148 | 338,242 | 31,906 | 9.4 | 8.6 | 0.8 | 1.21 |
| 1995 | 39,387,000 | 363,469 | 346,227 | 17,242 | 9.2 | 8.8 | 0.4 | 1.18 |
| 1996 | 39,478,000 | 362,626 | 351,449 | 11,177 | 9.2 | 8.9 | 0.3 | 1.17 |
| 1997 | 39,582,000 | 369,035 | 349,521 | 19,514 | 9.3 | 8.8 | 0.5 | 1.19 |
| 1998 | 39,721,000 | 365,193 | 360,511 | 4,682 | 9.2 | 9.1 | 0.1 | 1.15 |
| 1999 | 39,927,000 | 380,130 | 371,102 | 9,028 | 9.5 | 9.3 | 0.2 | 1.20 |
| 2000 | 40,264,000 | 397,632 | 360,391 | 37,241 | 9.9 | 9.0 | 0.9 | 1.23 |
| 2001 | 40,476,000 | 406,380 | 360,131 | 46,249 | 10.0 | 8.8 | 1.1 | 1.24 |
| 2002 | 41,035,000 | 418,846 | 368,618 | 50,228 | 10.1 | 8.9 | 1.2 | 1.26 |
| 2003 | 41,827,000 | 441,881 | 384,828 | 57,053 | 10.5 | 9.2 | 1.4 | 1.31 |
| 2004 | 42,547,000 | 454,591 | 371,934 | 82,657 | 10.6 | 8.7 | 1.9 | 1.33 |
| 2005 | 43,296,000 | 466,371 | 387,355 | 79,016 | 10.7 | 8.9 | 1.8 | 1.35 |
| 2006 | 44,009,000 | 482,957 | 371,478 | 111,479 | 10.9 | 8.4 | 2.5 | 1.36 |
| 2007 | 44,784,000 | 492,527 | 385,361 | 107,166 | 10.9 | 8.5 | 2.4 | 1.40 |
| 2008 | 45,668,000 | 519,779 | 386,324 | 133,455 | 11.4 | 8.4 | 3.0 | 1.46 |
| 2009 | 46,239,000 | 494,997 | 384,933 | 110,064 | 10.7 | 8.3 | 2.4 | 1.39 |
| 2010 | 46,486,000 | 486,575 | 382,047 | 104,528 | 10.5 | 8.2 | 2.3 | 1.38 |
| 2011 | 46,667,000 | 471,999 | 387,911 | 84,088 | 10.2 | 8.3 | 1.9 | 1.34 |
| 2012 | 46,818,216 | 454,648 | 402,950 | 51,698 | 9.7 | 8.6 | 1.1 | 1.32 |
| 2013 | 46,727,890 | 425,715 | 390,419 | 35,296 | 9.1 | 8.3 | 0.8 | 1.27 |
| 2014 | 46,512,199 | 427,595 | 395,830 | 31,765 | 9.1 | 8.5 | 0.6 | 1.32 |
| 2015 | 46,449,565 | 420,290 | 422,568 | -2,278 | 9.0 | 9.1 | -0.1 | 1.33 |
| 2016 | 46,440,099 | 410,583 | 410,611 | -28 | 8.8 | 8.8 | 0.0 | 1.34 |
| 2017 | 46,527,039 | 393,181 | 424,523 | -31,342 | 8.4 | 9.1 | -0.7 | 1.31 |
| 2018 | 46,658,447 | 372,777 | 427,721 | -54,944 | 7.9 | 9.1 | -1.2 | 1.26 |
| 2019†[18] | 46,937,060 | 360,617 | 418,703 | -58,086 | 7.6 | 8.8 | -1.2 | 1.24 |
| 2020†[19] | 47,329,981 | |||||||
† = as of 1 January 2019 and 2020.
Current vital statistics
- Births January–June 2019 =
 175,429
 - Births January–June 2020 = 168,047
- Deaths January–June 2019 =
 219,350
 - Deaths January–June 2020 =
 262,373
 - Natural increase January–June 2019 = -43,921
- Natural increase January–June 2020 =
 -94,326
The sharp increase in the number on deaths during the first semester of 2020 was due to the ongoing COVID-19 pandemic. In 2019 279,639 (77.7%) babies were born to mothers with Spanish nationality, 28,467 (7.9%) to mothers with an African nationality (including North Africa), 22,257 (6.2%) to mothers with an American nationality (both North and South America), 22,101 (6.1%) to mothers with a European nationality (both EU and non-EU countries of Europe), and 7,171 (2%) to mothers with an Asian nationality.
Other demographic statistics
.png.webp)
The following demographic statistics are from the World Population Review in 2019.[21]
- One birth every minute
- One death every minute
- Net gain of one person every 131 minutes
- One net migrant every 13 minutes
The following demographic statistics are from the CIA World Factbook, unless otherwise indicated.[22]
- Population
- 46.723 million (Jan 2018 est.)[23]

- Age structure
0-14 years:
15.02% (male 3,861,522/female 3,650,085)
15-24 years:
9.9% (male 2,557,504/female 2,392,498)
25-54 years:
43.61% (male 11,134,006/female 10,675,873)
55-64 years:
12.99% (male 3,177,080/female 3,319,823)
65 years and over:
18.49% (male 3,970,417/female 5,276,984) (2020 est.)
0-14 years:
15.3% (male 3,872,763/female 3,656,549)
15-24 years:
9.5% (male 2,424,352/female 2,267,429)
25-54 years:
44.9% (male 11,214,102/female 10,775,039)
54-64 years:
12.1% (male 2,899,088/female 3,044,111)
65 years and over:
17.9% (male 3,763,989/female 5,040,737) (2017 est.)
0-14 years:
14.4% (male 3,423,861/female 3,232,028)
15-64 years:
69.1% (male 16,185,575/female 15,683,433)
65 years and over:
16.5% (male 3,238,301/female 4,394,624) (2008 est.)
- Median age
- total: 43.9 years. Country comparison to the world: 21st
- male: 42.7 years
- female: 45.1 years (2020 est.)
- total: 42.7 years
- male: 41.5 years
- female: 43.9 years (2017 est.)
- Birth rate
- 8.05 births/1,000 population (2021 est.) Country comparison to the world: 212th
- 9.2 births/1,000 population (2017 est.)
- Death rate
- 9.78 deaths/1,000 population (2021 est.) Country comparison to the world: 55th
- Total fertility rate
- 1.51 children born/woman (2021 est.) Country comparison to the world: 207th
- Net migration rate
- 1.39 migrant(s)/1,000 population (2021 est.) Country comparison to the world: 11th
- 7.8 current migrant(s)/1,000 population (2017 est.)
- Population growth rate
- -0.03% (2021 est.) Country comparison to the world: 143th
- 0.78% (2017 est.)
- Mother's mean age at first birth
- 30.9 years (2017 est.)
- Life expectancy at birth
- total population: 82.21 years. Country comparison to the world: 29nd
- male: 79.22 years
- female: 85.39 years (2021 est.)
- Infant mortality rate
- 3.14 deaths/1,000 live births (2021 est.). Country comparison to the world: 216th
- Sex ratio
at birth:
1.07 male(s)/female
under 15 years:
1.06 male(s)/female
15-64 years:
1.02 male(s)/female
65 years and over:
0.75 male(s)/female
total population:
0.98 male(s)/female (2020 est.)
- Literacy
definition: age 15 and over can read and write (2018 est.)
- total population: 98.4%
- male: 98.9%
- female: 98.0%
- School life expectancy (primary to tertiary education)
- total: 18 years
- male: 17 years
- female: 18 years (2018)
- Unemployment, youth ages 15–24
- total: 34.3%. Country comparison to the world: 24th
- male: 35.2%
- female: 33.3% (2018 est.)
- Nationality
- See also : Nationalities and regions of Spain
noun:
Spaniard(s)
adjective:
Spanish
Metropolitan areas
The largest metropolitan areas in 2007 were:[24]
.png.webp)
- Madrid 6,489,162
- Barcelona 5,375,774
- Valencia 1,705,742
- Seville 1,519,639
- Bilbao 950,155
- Málaga 897,563
- Asturias (Gijón–Oviedo–Avilés) 857,079
- Alicante–Elche 748,565
- Zaragoza 731,803
- Vigo - Pontevedra 662,412
- Las Palmas de Gran Canaria 616,903
- Bahía de Cádiz (Cádiz–Jerez de la Frontera) 615,494
- Santa Cruz de Tenerife 573,825
- Murcia 563,272
- Palma de Mallorca 474,035
- Granada 472,638
- San Sebastián 402,168
- Tarragona 406,042
- A Coruña 403,007
- Valladolid 400,400
- Santander–Torrelavega 391,480
- Córdoba 323,600
- Pamplona 309,631
Islands
Islander population:[25]
- Tenerife 886,033
- Majorca 846,210
- Gran Canaria 829,597
- Lanzarote 132,366
- Ibiza 113,908
- Fuerteventura 94,386
- Menorca 86,697
- La Palma 85,933
- La Gomera 22,259
- El Hierro 10,558
- Formentera 7,957
- Arousa 4,889
- La Graciosa 658
- Tabarca 105
- Ons 61
Ethnic groups
Definition of ethnicity or nationality in Spain is fraught politically. The term "Spanish people" (pueblo español) is defined in the 1978 constitution as the political sovereign, i.e. the citizens of the Kingdom of Spain. The same constitution in its preamble speaks of "peoples and nationalities of Spain" (pueblos y nacionalidades de España) and their respective cultures, traditions, languages and institutions. The formerly nomadic Gitanos and Mercheros are distinctly marked by endogamy and discrimination but they are dispersed through the country.
The native Canarians are partly the descendants of the North African population of the Canary Islands prior to Spanish colonization in the 15th century although many Spaniards have varying levels of North African admixture as a result of the Islamic period. Also included are many Spaniard citizens who are descendants of people from Spain's former colonies, mostly from Equatorial Guinea, Argentina, Dominican Republic, Ecuador, Peru, Colombia, Morocco and the Philippines. There is also a sizable number of Spaniards of Eastern European, Maghrebian, Sub Saharan-African, South Asian and Middle Eastern descent.[26]
As of 2019, native-born Spanish citizens of all ethnic groups make up 84.6% of the total population, and 15.4% are immigrants, both naturalized and foreign. Among the immigrants, around 45% of them come from Spain's former territories in America (primarily Ecuador, Peru, Venezuela and Colombia). The rest are predominantly North African, Eastern European and Western European.
Foreign population
As of 2018, the region had a foreign population of 4,734,691.[27] The largest groups of foreigners were those of Moroccan, Romanian, British, Chinese and Italian citizenship.[27] Meanwhile, Spain had a foreign-born population of 6,742,948, being those born in the Americas the largest group, and Europe being the second most common continent of origin after South America.[28]
Religions
Religion in Spain (CIS poll, December 2020) [29]
The Reconquista was the long process by which the Catholics reconquered Spain from Islamic rule by 1492. The Spanish Inquisition was established in 1478 to complete the religious orthodoxy of the Iberian Peninsula. In the centuries that followed, Spain saw itself as the bulwark of Catholicism and doctrinal purity, since them Catholicism has been the main religion in Spain.[30][31]
Spanish missionaries carried Catholicism to the Americas and the Philippines, establishing various missions in the newly colonized lands. The missions served as a base for both administering colonies as well as spreading Christianity.[32][33][34]
The Spanish Constitution of 1978 abolished Catholicism as the official state religion, but recognizing the role it plays in Spanish society.[35] From the end of the Francoist dictatorship to the present day, a secularization process has taken place that has meant a progressive decrease in religious practice, in the attendance at the different religious rites (baptisms, communions and Catholic marriages) and in the percentage of Spaniards who identify as Catholic,[36] Consequently, a majority of Spaniards today ignore Catholic doctrines on matters such as pre-marital sex, homosexuality and contraception.[37][38] Despite the drop, Catholic identity nevertheless remains an important part of Spain's culture.[36]
As of 2018, 68.5% of the population define themselves as Catholic, 26.4% as non-believers or atheists, and 2.6% other religions according to the official Spanish Center for Sociological Research.[39] Among believers, 59% assert they almost never go to any religious service, by contrast, 16.3% attend one or more religious service almost every week.[39][40]
A study made by the Union of Islamic Communities of Spain demonstrated that there were about 1,700,000 inhabitants of Muslim background living in Spain as of 2012, accounting for 3–4% of the total population of Spain. The vast majority was composed of immigrants and descendants originating from Morocco and other African countries. More than 514,000 (30%) of them had Spanish nationality.[41]
Languages
- Spanish 99% (88% mother tongue[42]) (official nationwide)
- Catalan 16%[43] (9% mother tongue[42]) (co-official in Catalonia, Balearic Islands, and Valencia — see Valencian)
- Galician 7% (5% mother tongue[42]) (co-official in Galicia)
- Basque 1.6% (1% mother tongue[42]) (co-official in Basque Country and designated areas in Navarre).
- Aranese (a variant of Gascon Occitan) is co-official in Val d'Aran, a small valley in the Pyrenees.
Others with no official status:
- Asturian-Leonese (in the former Kingdom of León and Asturias)
- Aragonese (in the province of Huesca, Aragon)
- Arabic (in the autonomous city of Ceuta)
- Berber (in the autonomous city of Melilla)
Literacy
Definition: people of age 15 and over can read and write. Amount of population ≥ 15 that can read and write: 97.7%.
Educational system
About 70% of Spain's student population attends public schools or universities. The remainder attend private schools or universities, many of which are operated by the Catholic Church.
Compulsory education begins with primary school or general basic education for ages 6–16. It is free in public schools and in many private schools, most of which receive government subsidies. Following graduation, students attend either a secondary school offering a general high school diploma or a school of professional study in all fields – law, sciences, humanities, and medicine – and the technical schools offer programs in engineering and architecture.
Notes
- In fertility rates, 2.1 and above is a stable population and has been marked blue, 2 and below leads to an aging population and the result is that the population decreases.
See also
| Wikimedia Commons has media related to Demographics of Spain. |
References
- https://www.ine.es/dyngs/INEbase/es/operacion.htm?c=Estadistica_C&cid=1254736177012&menu=ultiDatos&idp=1254734710990d%5B%5D
- Instituto Nacional de Estadística (29 June 2020). "Estadística del Padrón Continuo". Spain.
- https://citymonitor.ai/fabric/these-maps-reveal-truth-about-population-density-across-europe-3625
- Official report on Spanish recent Macroeconomics, including data and comments on immigration Archived 26 July 2008 at the Wayback Machine
- Source: Instituto Nacional de Estadística. Evolution of the foreign population in Spain since 1998 "Archived copy". Archived from the original on 29 September 2007. Retrieved 29 September 2007.CS1 maint: archived copy as title (link)
- Source: Instituto Nacional de Estadística, Evolution of the global fertility rate between 1975 and 2005
- ABC. "El 75% de los nuevos habitantes de España es extranjero, según un estudio - Nacional_Sociedad - Nacional - ABC.es". ABC.
- https://www.ine.es/jaxi/Datos.htm?path=/t20/e245/p08/l0/&file=01006.px#!tabs-tabla
- La evolución de las familias numerosas (Spanish)
- Fernández, Celia Valiente. "Forgetting the past: The familiar policy of Spain (1975-1996)" (PDF). Charles III University of Madrid.
- The first 'patera' arrived to Canary Islands 20 years ago - Público newspaper (Spanish)
- "Saldo migratorio en España desde 1940 / Net migration in Spain since 1940". 7 July 2014.
- "Life expectancy". Our World in Data. Retrieved 28 August 2018.
- "World Population Prospects – Population Division – United Nations". Archived from the original on 19 September 2016. Retrieved 15 July 2017.
- Max Roser (2014), "Total Fertility Rate around the world over the last centuries", Our World In Data, Gapminder Foundation, archived from the original on 7 August 2018, retrieved 7 August 2018
- "Fondo documental. Historia". www.ine.es.
- "Instituto Nacional de Estadística Vital Statistics". Archived from the original on 12 March 2012. Retrieved 8 March 2012.
- "Basic Demographic Indicators Year 2019. Provisional data" (PDF).
- "Population Figures at 1 January 2020" (PDF).
- "Estadísticas del Movimiento Natural de la Población (MNP) – Nacimientos, Defunciones y Matrimonios – Primer semestre de 2020. Datos provisionales" (PDF). Instituto Nacional de Estadística - INE. Retrieved 26 January 2021.
- World Population Review: Spain Population 2018, 14 June 2018
- "World Factbook EUROPE : SPAIN", The World Factbook, 3 February 2021
- http://www.ine.es/dyngs/INEbase/en/operacion.htm?c=Estadistica_C&cid=1254736177012&menu=ultiDatos&idp=1254734710990
- "AUDES project". Grupo Alarcos. Archived from the original on 22 August 2011. Retrieved 14 August 2008.
- La superficie de las islas vendrá dada en hectáreas salvo la de las mayores islas de los archipiélagos canario y balear, así como las Plazas de Soberanía.
- "Ethnic Groups in Spain | Study.com". Study.com. Retrieved 9 May 2018.
- "Población extranjera por Nacionalidad, comunidades, Sexo y Año". Instituto Nacional de Estadística. Retrieved 5 April 2019.
- "Población (españoles/extranjeros) por país de nacimiento y sexo". Instituto Nacional de Estadística. Retrieved 5 April 2019.
- Centro de Investigaciones Sociológicas: Barómetro de Diciembre 2020, página 30.¿Cómo se define Ud. en materia religiosa: católico/a practicante, católico/a no practicante, creyente de otra religión, agnóstico/a, indiferente o no creyente, o ateo/a?
- Juergensmeyer, Mark; Roof, Wade Clark (2011). Encyclopedia of Global Religion. SAGE Publications. p. 1214. ISBN 9781452266565.
-
- Payne, Stanley G. Spanish Catholicism: An Historical Overview (1984)
- Laicidad and Religious Diversity in Latin America. Springer. 2016. p. 10. ISBN 9783319447452.
- Cornelio, Jayeel Serrano (2016). Being Catholic in the Contemporary Philippines: Young People Reinterpreting Religion. Routledge. ISBN 9781317621966.
- Tarver Ph.D., H. Micheal; Slape, Emily (2016). The Spanish Empire: A Historical Encyclopedia [2 volumes]: A Historical Encyclopedia. ABC-CLIO. p. 198. ISBN 9781610694223.
- "Spanish Constitution". Sections 14, 16 & 27.3, Constitution of 29 December 1978 (PDF). Retrieved 5 March 2018.
No religion shall have a state character. The public authorities shall take into account the religious beliefs of Spanish society and shall consequently maintain appropriate cooperation relations with the Catholic Church and other confessions.
- A. Santos (2012). Social Movements and Sexual Citizenship in Southern Europe. Springer. ISBN 9781137296405.
- Tarvainen, Sinikka (26 September 2004). "Reforms anger Spanish church". Dawn International. Retrieved 21 March 2008.
- "Zapatero accused of rejecting religion". Worldwide Religious News. 15 October 2004. Archived from the original on 23 October 2008. Retrieved 21 March 2008.
- Centro de Investigaciones Sociológicas (Centre for Sociological Research) (January 2018). "Barómetro de enero de 2018" (in Spanish). p. 19. Archived from os.cis.es/pdf/Es3187sd_A.pdf the original Check
|url=value (help) (PDF) on 12 July 2013. Retrieved 3 March 2018. - "Eurobarometer 69 - Values of Europeans. p.16" (PDF). Retrieved 24 March 2009.
- "Explotación estadística del censo de ciudadanos musulmanes en España referido a fecha 31/12/2012" (PDF). Unión de Comunidades Islámicas de España: 6–9. 2012. Archived (PDF) from the original on 28 March 2013.
- "Europeans and their languages" (PDF). ec.europa.eu. European Commission. February 2006.
- "Spain".
External links
- Spanish Instituto Nacional de Estadística Statistical data about demography and population
- Build Spanish population graph 1960 - 2013 (World Bank data)
- Build Spanish population projection graph till 2100 (United Nation data)
- Build Spanish life expectancy at birth graph 1950 - 2013 (United Nation data)