Demographics of Germany
The demography of Germany is monitored by the Statistisches Bundesamt (Federal Statistical Office of Germany). According to the first census since reunification, Germany's population was 80,219,695 (9 May 2011),[5] making it the sixteenth-most populous country in the world and the most populous in the European Union. The total fertility rate was rated at 1.57 in 2018.[4] In 2008, fertility was related to educational achievement (women with lower levels of education were having more children than women who had completed higher education).[6] In 2011, this was no longer true for Eastern Germany, where more highly educated women now had a somewhat higher fertility rate than the rest of the population.[7] Persons who said they had no religion tend to have fewer children than those who identify as Christians, and studies also found that conservative-leaning Christians had more children compared to liberal-leaning Christians.[8][9]
| Demographics of Germany | |
|---|---|
 | |
| Population | |
| Growth rate | |
| Birth rate | 9.5 births/1,000 population (2018)[3] |
| Death rate | 11.5 deaths/1,000 population (2018)[3] |
| Life expectancy | 81 years (2015) |
| • male | 79 years |
| • female | 83 years |
| Fertility rate | 1.57 children born/woman (2018)[4] |
| Infant mortality rate | 3.46 deaths/1,000 live births (2014) |
| Net migration rate | 1.06 migrant(s)/1,000 population (2014) |
| Sex ratio | |
| Total | 0.97 male(s)/female (2015) |
| At birth | 1.06 male(s)/female |
| Under 15 | 1.05 male(s)/female |
| 15–64 years | 1.02 male(s)/female |
| 65 and over | 0.76 male(s)/female |
| Nationality | |
| Nationality | noun: German(s) adjective: German |
| Major ethnic | Germans |
| Language | |
| Spoken | German, others |
| Year | Pop. | ±% |
|---|---|---|
| 1950 | 69,346,000 | — |
| 1960 | 73,147,000 | +5.5% |
| 1970 | 78,069,000 | +6.7% |
| 1980 | 78,397,000 | +0.4% |
| 1990 | 79,753,227 | +1.7% |
| 2000 | 82,259,540 | +3.1% |
| 2010 | 81,751,602 | −0.6% |
| 2020 | 83,122,889 | +1.7% |
| Source: DESTATIS | ||
The United Nations Population Fund lists Germany as host to the third-highest number of international migrants worldwide, behind the United States and Saudi Arabia.[10] More than 16 million people are descended from immigrants (first and second generation, including mixed heritage and ethnic German repatriates and their descendants). 96.1% of those reside in western Germany and Berlin.[11] About 7,000,000 of these 16,000,000 are foreign residents, defined as those without German citizenship. The largest ethnic group of non-German origin are the Turkish. Since the 1960s, West and later reunified Germany has attracted immigrants primarily from Southern and Eastern Europe as well as Turkey, many of whom (or their children) have acquired German citizenship over time. While most of these immigrants initially arrived as guest workers, Germany has also been a prime destination for refugees who have applied for asylum in Germany, in part because the German constitution has long had a clause guaranteeing political asylum as a human right; but restrictions over the years have since limited the scope of this guarantee.
Germany has one of the world's highest levels of education, technological development, and economic productivity. Since the end of World War II, the number of students entering university has more than tripled, and the trade and technical schools are among the world's best. With a per capita income of about €40,883 in 2018,[12] Germany is a broadly middle-class society. However, there has been a strong increase in the number of children living in poverty. In 1965, one in 75 children was on the welfare rolls; but by 2007 this had increased to one child in six. These children live in relative poverty, but not necessarily in absolute poverty.[13] Germans are typically well-travelled, with millions travelling overseas each year. The social welfare system provides for universal health care, unemployment compensation, child benefits and other social programmes. Germany's ageing population and struggling economy strained the welfare system in the 1990s, so the government adopted a wide-ranging programme of belt-tightening reforms, Agenda 2010, including the labour-market reforms known as Hartz concept.
History
The contemporary demographics of Germany are also measured by a series of full censuses, with the most recent held in 1987. Since reunification, German authorities rely on a micro census.
Total Fertility Rate from 1800 to 1899
The total fertility rate is the number of children born per woman. It is based on fairly good data for the entire period. Sources: Our World In Data and Gapminder Foundation.[14]
| Years | 1800 | 1801 | 1802 | 1803 | 1804 | 1805 | 1806 | 1807 | 1808 | 1809 | 1810 |
|---|---|---|---|---|---|---|---|---|---|---|---|
| 5.4 | 5.40 | 5.39 | 5.39 | 5.38 | 5.38 | 5.37 | 5.37 | 5.36 | 5.36 | 5.35 | |
| Years | 1811 | 1812 | 1813 | 1814 | 1815 | 1816 | 1817 | 1818 | 1819 | 1820 | |
| 5.35 | 5.34 | 5.34 | 5.33 | 5.33 | 5.32 | 5.32 | 5.33 | 5.35 | 5.37 | ||
| Years | 1821 | 1822 | 1823 | 1824 | 1825 | 1826 | 1827 | 1828 | 1829 | 1830 | |
| 5.35 | 5.33 | 5.31 | 5.28 | 5.26 | 5.17 | 5.07 | 4.97 | 4.88 | 4.78 | ||
| Years | 1831 | 1832 | 1833 | 1834 | 1835 | 1836 | 1837 | 1838 | 1839 | 1840 | |
| 4.80 | 4.83 | 4.85 | 4.88 | 4.9 | 4.9 | 4.9 | 4.9 | 4.9 | 4.9 | ||
| Years | 1841 | 1842 | 1843 | 1844 | 1845 | 1846 | 1847 | 1848 | 1849 | 1850 | |
| 4.9 | 4.95 | 4.97 | 5.00 | 5.02 | 5.02 | 5.02 | 5.01 | 5.01 | 5.01 | ||
| Years | 1851 | 1852 | 1853 | 1854 | 1855 | 1856 | 1857 | 1858 | 1859 | 1860 | |
| 4.87 | 4.74 | 4.60 | 4.47 | 4.33 | 4.45 | 4.56 | 4.67 | 4.79 | 4.90 | ||
| Years | 1861 | 1862 | 1863 | 1864 | 1865 | 1866 | 1867 | 1868 | 1869 | 1870 | |
| 4.93 | 4.96 | 5.00 | 5.03 | 5.06 | 5.09 | 5.11 | 5.13 | 5.16 | 5.18 | ||
| Years | 1871 | 1872 | 1873 | 1874 | 1875 | 1876 | 1877 | 1878 | 1879 | 1880 | |
| 5.24 | 5.30 | 5.35 | 5.41 | 5.46 | 5.38 | 5.30 | 5.22 | 5.14 | 5.06 | ||
| Years | 1881 | 1882 | 1883 | 1884 | 1885 | 1886 | 1887 | 1888 | 1889 | 1890 | |
| 5.14 | 5.21 | 5.29 | 5.28 | 5.26 | 5.25 | 5.23 | 5.22 | 5.21 | 5.20 | ||
| Years | 1891 | 1892 | 1893 | 1894 | 1895 | 1896 | 1897 | 1898 | 1899 | ||
| 5.18 | 5.17 | 5.16 | 5.14 | 5.11 | 5.09 | 5.06 | 5.04 | 4.99 |
Life expectancy from 1875 to 2015
Sources: Our World In Data and the United Nations.
1875-1950
| Years | 1875 | 1885 | 1895 | 1905 | 1911 | 1915 | 1925 | 1935 | 1946[15] |
|---|---|---|---|---|---|---|---|---|---|
| Life expectancy in Germany | 38.5 | 39.5 | 42.8 | 45.5 | 49.0 | 40.5 | 57.4 | 61.5 | 60.5 |
1950-2015
| Period | Life expectancy in Years |
Period | Life expectancy in Years |
|---|---|---|---|
| 1950–1955 | 67.5 | 1985–1990 | 75.0 |
| 1955–1960 | 68.9 | 1990–1995 | 76.0 |
| 1960–1965 | 70.0 | 1995–2000 | 77.3 |
| 1965–1970 | 70.7 | 2000–2005 | 78.6 |
| 1970–1975 | 71.2 | 2005–2010 | 79.7 |
| 1975–1980 | 72.3 | 2010–2015 | 80.4 |
| 1980–1985 | 73.7 | 2015-2020 | 81.1 |
Source: UN World Population Prospects[16]
Statistics since 1900
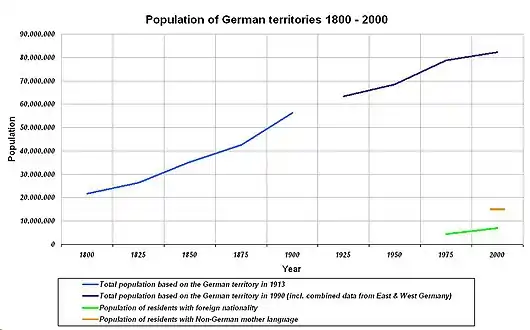
Population statistics since 1900.[17] Territorial changes of Germany occurred in 1918/1919, 1921/1922, 1945/1946 and in 1990.
| Average population | Live births | Deaths | Natural change | Crude birth rate (per 1000) | Crude death rate (per 1000) | Natural change (per 1000) | Total Fertility Rates[fn 1][14][18][19][20] | |||
|---|---|---|---|---|---|---|---|---|---|---|
| All of Germany |
FRG | (Former) GDR | ||||||||
| 1900 | 54,326,000 | 1,944,139 | 1,199,382 | 744,757 | 35.8 | 22.1 | 13.7 | 4.93 | ||
| 1901 | 55,144,000 | 1,980,313 | 1,140,489 | 839,824 | 35.9 | 20.7 | 15.2 | 4.88 | ||
| 1902 | 56,017,000 | 1,971,735 | 1,088,492 | 883,243 | 35.2 | 19.4 | 15.8 | 4.82 | ||
| 1903 | 56,869,000 | 1,931,078 | 1,135,905 | 795,173 | 34.0 | 20.0 | 14.0 | 4.77 | ||
| 1904 | 57,695,000 | 1,972,847 | 1,128,183 | 844,664 | 34.2 | 19.6 | 14.6 | 4.68 | ||
| 1905 | 58,514,000 | 1,935,153 | 1,158,314 | 776,839 | 33.1 | 19.8 | 13.3 | 4.60 | ||
| 1906 | 59,343,000 | 1,970,477 | 1,078,202 | 892,275 | 33.2 | 18.2 | 15.0 | 4.51 | ||
| 1907 | 60,183,000 | 1,948,933 | 1,084,309 | 864,624 | 32.4 | 18.0 | 14.4 | 4.43 | ||
| 1908 | 61,023,000 | 1,964,052 | 1,100,490 | 863,562 | 32.2 | 18.0 | 14.2 | 4.34 | ||
| 1909 | 61,857,000 | 1,929,278 | 1,062,217 | 867,061 | 31.2 | 17.2 | 14.9 | 4.18 | ||
| 1910 | 62,698,000 | 1,876,778 | 1,016,665 | 860,113 | 29.9 | 16.2 | 13.7 | 4.01 | ||
| 1911 | 63,469,000 | 1,824,729 | 1,097,784 | 726,945 | 28.7 | 17.3 | 11.5 | 3.85 | ||
| 1912 | 64,236,000 | 1,823,636 | 1,000,749 | 822,887 | 28.4 | 15.6 | 12.8 | 3.68 | ||
| 1913 | 65,058,000 | 1,794,750 | 975,950 | 818,800 | 27.6 | 15.0 | 12.6 | 3.52 | ||
| 1914 | 65,860,000 | 1,775,596 | 1,246,310 | 529,286 | 27.0 | 18.9 | 8.0 | 3.27 | ||
| 1915 | 65,953,000 | 1,353,546 | 1,410,420 | -56,874 | 20.5 | 21.4 | -0.9 | 3.02 | ||
| 1916 | 65,795,000 | 1,005,484 | 1,258,054 | -252,570 | 15.3 | 19.1 | -3.8 | 2.76 | ||
| 1917 | 65,450,000 | 912,109 | 1,345,424 | -433,315 | 13.9 | 20.6 | -6.6 | 2.51 | ||
| 1918 | 64,800,000 | 926,813 | 1,606,475 | -679,662 | 14.3 | 24.8 | -10.5 | 2.26 | ||
| 1919 | 62,897,000 | 1,260,500 | 978,380 | 282,120 | 20.0 | 15.6 | 4.5 | 2.33 | ||
| 1920 | 61,794,000 | 1,599,287 | 932,929 | 666,358 | 25.9 | 15.1 | 10.8 | 2.40 | ||
| 1921 | 62,473,000 | 1,581,130 | 869,555 | 711,575 | 25.3 | 13.9 | 11.4 | 2.48 | ||
| 1922 | 61,890,000 | 1,424,804 | 890,181 | 534,623 | 23.0 | 14.4 | 8.6 | 2.55 | ||
| 1923 | 62,250,000 | 1,318,489 | 866,754 | 451,735 | 21.2 | 13.9 | 7.2 | 2.62 | ||
| 1924 | 62,740,000 | 1,290,763 | 766,957 | 523,806 | 20.6 | 12.2 | 8.4 | 2.42 | ||
| 1925 | 63,110,000 | 1,311,259 | 753,017 | 558,242 | 20.8 | 11.9 | 8.8 | 2.21 | ||
| 1926 | 63,510,000 | 1,245,471 | 742,955 | 502,516 | 19.6 | 11.7 | 7.9 | 2.10 | ||
| 1927 | 63,940,000 | 1,178,892 | 765,331 | 413,561 | 18.4 | 12.0 | 6.5 | 1.98 | ||
| 1928 | 64,470,000 | 1,199,998 | 747,444 | 452,554 | 18.6 | 11.6 | 7.0 | 1.99 | ||
| 1929 | 64,670,000 | 1,164,062 | 814,545 | 349,517 | 18.0 | 12.6 | 5.4 | 1.93 | ||
| 1930 | 65,130,000 | 1,144,151 | 718,807 | 425,344 | 17.6 | 11.0 | 6.5 | 1.88 | ||
| 1931 | 65,510,000 | 1,047,775 | 734,165 | 313,610 | 16.0 | 11.2 | 4.8 | 1.71 | ||
| 1932 | 65,716,000 | 993,126 | 707,642 | 285,484 | 15.1 | 10.8 | 4.3 | 1.62 | ||
| 1933 | 66,027,000 | 971,174 | 737,877 | 233,297 | 14.7 | 11.2 | 3.5 | 1.58 | ||
| 1934 | 66,409,000 | 1,198,350 | 725,000 | 473,000 | 18.0 | 10.9 | 7.1 | 1.93 | ||
| 1935 | 66,871,000 | 1,263,976 | 792,018 | 471,958 | 18.9 | 11.8 | 7.1 | 2.03 | ||
| 1936 | 67,349,000 | 1,278,583 | 795,793 | 482,790 | 19.0 | 11.8 | 7.2 | 2.07 | ||
| 1937 | 67,831,000 | 1,277,046 | 794,367 | 482,679 | 18.8 | 11.7 | 7.1 | 2.09 | ||
| 1938 | 68,424,000 | 1,348,534 | 799,220 | 549,314 | 19.7 | 11.7 | 8.0 | 2.25 | ||
| 1939 | 69,314,000 | 1,413,230 | 854,348 | 558,882 | 20.4 | 12.3 | 8.1 | 2.39 | ||
| 1940 | 69,838,000 | 1,402,258 | 885,591 | 516,667 | 20.1 | 12.7 | 7.4 | 2.40 | ||
| 1941 | 70,244,000 | 1,308,232 | 844,435 | 463,797 | 18.6 | 12.0 | 6.6 | 2.25 | ||
| 1942 | 70,834,000 | 1,055,915 | 847,861 | 208,054 | 14.9 | 12.0 | 2.9 | 1.83 | ||
| 1943 | 70,411,000 | 1,124,718 | 853,246 | 271,472 | 16.0 | 12.1 | 3.9 | 2.00 | ||
| 1944 | 69,000,000 | 1,215,000 | 915,000 | 300,000 | 17.6 | 13.3 | 4.3 | 1.89 | ||
| 1945 | 66,000,000 | 1,060,000 | 1,210,000 | -150,000 | 16.1 | 18.3 | -2.3 | 1.53 | ||
| 1946 | 64,260,000 | 921,998 | 1,001,331 | -79,333 | 14.3 | 15.6 | -1.2 | 1.65 | ||
| 1947 | 65,842,000 | 1,028,421 | 932,628 | 95,793 | 15.6 | 14.2 | 1.5 | 1.92 | 2.01 | 1.75 |
| 1948 | 67,365,000 | 1,049,074 | 804,839 | 244,235 | 15.6 | 11.9 | 3.6 | 1.96 | 2.07 | 1.76 |
| 1949 | 68,080,000 | 1,106,803 | 770,852 | 335,951 | 16.3 | 11.3 | 4.9 | 2.11 | 2.14 | 2.03 |
| 1950 | 68,374,000 | 1,116,835 | 748,329 | 368,506 | 16.3 | 10.9 | 5.4 | 2.14 | 2.10 | 2.35 |
| 1951 | 68,882,000 | 1,106,608 | 752,697 | 353,911 | 16.1 | 10.9 | 5.1 | 2.16 | 2.06 | 2.46 |
| 1952 | 69,171,000 | 1,105,080 | 767,637 | 337,443 | 16.0 | 11.1 | 4.9 | 2.16 | 2.08 | 2.42 |
| 1953 | 69,564,000 | 1,095,096 | 790,654 | 304,442 | 15.7 | 11.4 | 4.4 | 2.15 | 2.07 | 2.40 |
| 1954 | 69,934,000 | 1,110,028 | 775,291 | 334,737 | 15.9 | 11.1 | 4.8 | 2.18 | 2.12 | 2.38 |
| 1955 | 70,307,000 | 1,113,128 | 795,938 | 317,190 | 15.8 | 11.3 | 4.5 | 2.18 | 2.11 | 2.38 |
| 1956 | 70,711,000 | 1,137,169 | 812,111 | 325,058 | 16.1 | 11.5 | 4.6 | 2.22 | 2.19 | 2.30 |
| 1957 | 71,166,000 | 1,165,555 | 840,195 | 325,360 | 16.4 | 11.8 | 4.6 | 2.28 | 2.28 | 2.24 |
| 1958 | 71,637,000 | 1,175,870 | 818,418 | 357,452 | 16.4 | 11.4 | 5.0 | 2.29 | 2.29 | 2.22 |
| 1959 | 72,180,000 | 1,243,922 | 835,402 | 408,520 | 17.2 | 11.6 | 5.7 | 2.36 | 2.34 | 2.37 |
| 1960 | 72,664,000 | 1,261,614 | 876,721 | 384,893 | 17.4 | 12.1 | 5.3 | 2.37 | 2.37 | 2.35 |
| 1961 | 73,352,000 | 1,313,505 | 850,300 | 463,205 | 17.9 | 11.6 | 6.3 | 2.45 | 2.47 | 2.42 |
| 1962 | 74,049,000 | 1,316,534 | 878,814 | 437,720 | 17.8 | 11.9 | 5.9 | 2.44 | 2.45 | 2.42 |
| 1963 | 75,019,000 | 1,355,595 | 895,070 | 460,525 | 18.1 | 11.9 | 6.1 | 2.51 | 2.52 | 2.47 |
| 1964 | 75,273,000 | 1,357,304 | 870,319 | 486,985 | 18.0 | 11.6 | 6.5 | 2.54 | 2.55 | 2.48 |
| 1965 | 76,061,000 | 1,325,386 | 907,882 | 417,504 | 17.4 | 11.9 | 5.5 | 2.50 | 2.51 | 2.48 |
| 1966 | 76,734,000 | 1,318,303 | 911,984 | 406,319 | 17.2 | 11.9 | 5.3 | 2.51 | 2.54 | 2.43 |
| 1967 | 76,954,000 | 1,272,276 | 914,417 | 357,859 | 16.5 | 11.9 | 4.7 | 2.48 | 2.54 | 2.34 |
| 1968 | 77,249,000 | 1,214,968 | 976,521 | 238,447 | 15.7 | 12.6 | 3.1 | 2.38 | 2.39 | 2.30 |
| 1969 | 77,918,000 | 1,142,368 | 988,092 | 154,276 | 14.7 | 12.7 | 2.0 | 2.21 | 2.20 | 2.24 |
| 1970 | 77,772,000 | 1,047,737 | 975,664 | 72,073 | 13.5 | 12.5 | 0.9 | 2.03 | 1.99 | 2.19 |
| 1971 | 78,355,000 | 1,013,396 | 965,623 | 47,773 | 12.9 | 12.3 | 0.6 | 1.96 | 1.92 | 2.13 |
| 1972 | 78,717,000 | 901,657 | 965,689 | -64,032 | 11.5 | 12.3 | -0.8 | 1.73 | 1.72 | 1.79 |
| 1973 | 78,951,000 | 815,969 | 963,034 | -147,065 | 10.3 | 12.2 | -1.9 | 1.56 | 1.54 | 1.58 |
| 1974 | 78,966,000 | 805,500 | 956,573 | -151,073 | 10.2 | 12.1 | -1.9 | 1.53 | 1.51 | 1.54 |
| 1975 | 78,862,000 | 782,310 | 989,649 | -207,339 | 9.9 | 12.5 | -2.6 | 1.48 | 1.45 | 1.54 |
| 1976 | 78,299,000 | 798,334 | 966,873 | -168,539 | 10.2 | 12.3 | -2.2 | 1.51 | 1.46 | 1.64 |
| 1977 | 78,161,000 | 805,496 | 931,155 | -125,659 | 10.3 | 11.9 | -1.6 | 1.51 | 1.40 | 1.85 |
| 1978 | 78,066,000 | 808,619 | 955,550 | -146,931 | 10.4 | 12.2 | -1.9 | 1.50 | 1.38 | 1.90 |
| 1979 | 78,082,000 | 817,217 | 944,474 | -127,257 | 10.5 | 12.1 | -1.6 | 1.50 | 1.39 | 1.90 |
| 1980 | 78,295,000 | 865,789 | 952,371 | -86,582 | 11.1 | 12.2 | -1.1 | 1.56 | 1.44 | 1.94 |
| 1981 | 78,399,000 | 862,100 | 954,436 | -92,336 | 11.0 | 12.2 | -1.2 | 1.53 | 1.43 | 1.85 |
| 1982 | 78,293,000 | 861,275 | 943,832 | -82,557 | 11.0 | 12.1 | -1.1 | 1.51 | 1.41 | 1.86 |
| 1983 | 78,082,000 | 827,933 | 941,032 | -113,099 | 10.6 | 12.1 | -1.4 | 1.43 | 1.33 | 1.79 |
| 1984 | 77,797,000 | 812,292 | 917,299 | -105,007 | 10.4 | 11.8 | -1.3 | 1.39 | 1.29 | 1.74 |
| 1985 | 77,619,000 | 813,803 | 929,649 | -115,846 | 10.5 | 12.0 | -1.5 | 1.37 | 1.28 | 1.73 |
| 1986 | 77,635,000 | 848,231 | 925,411 | -77,180 | 10.9 | 11.9 | -1.0 | 1.41 | 1.34 | 1.70 |
| 1987 | 77,718,000 | 867,969 | 901,291 | -33,322 | 11.2 | 11.6 | -0.4 | 1.43 | 1.37 | 1.74 |
| 1988 | 78,116,000 | 892,993 | 900,627 | -7,634 | 11.4 | 11.5 | -0.1 | 1.46 | 1.41 | 1.67 |
| 1989 | 78,677,000 | 880,459 | 903,441 | -22,982 | 11.2 | 11.5 | -0.3 | 1.42 | 1.39 | 1.56 |
| 1990 | 79,365,000 | 905,675 | 914,361 | -8,686 | 11.4 | 11.5 | -0.1 | 1.45 | 1.45 | 1.52 |
| 1991 | 79,984,000 | 830,019 | 911,245 | -81,226 | 10.4 | 11.4 | -1.0 | 1.33 | 1.42 | 0.98 |
| 1992 | 80,570,000 | 809,114 | 885,443 | -76,329 | 10.0 | 11.0 | -0.9 | 1.29 | 1.40 | 0.83 |
| 1993 | 81,187,000 | 798,447 | 897,270 | -98,823 | 9.8 | 11.1 | -1.2 | 1.28 | 1.39 | 0.78 |
| 1994 | 81,422,000 | 769,603 | 884,659 | -115,056 | 9.5 | 10.9 | -1.4 | 1.24 | 1.35 | 0.77 |
| 1995 | 81,661,000 | 765,221 | 884,588 | -119,367 | 9.4 | 10.8 | -1.5 | 1.25 | 1.34 | 0.84 |
| 1996 | 81,896,000 | 796,013 | 882,843 | -86,830 | 9.7 | 10.8 | -1.1 | 1.32 | 1.40 | 0.95 |
| 1997 | 82,061,000 | 812,173 | 860,389 | -48,216 | 9.9 | 10.5 | -0.6 | 1.37 | 1.44 | 1.04 |
| 1998 | 82,024,000 | 785,034 | 852,382 | -67,348 | 9.6 | 10.4 | -0.8 | 1.36 | 1.41 | 1.09 |
| 1999 | 82,101,000 | 770,744 | 846,330 | -75,586 | 9.4 | 10.3 | -0.9 | 1.36 | 1.41 | 1.15 |
| 2000 | 82,213,000 | 766,999 | 838,797 | -71,798 | 9.3 | 10.2 | -0.9 | 1.38 | 1.41 | 1.21 |
| 2001 | 82,350,000 | 734,475 | 828,541 | -94,066 | 8.9 | 10.1 | -1.1 | 1.35 | 1.38 | 1.23 |
| 2002 | 82,489,000 | 719,250 | 841,673 | -122,423 | 8.7 | 10.2 | -1.5 | 1.34 | 1.37 | 1.24 |
| 2003 | 82,541,000 | 706,721 | 853,946 | -147,225 | 8.6 | 10.3 | -1.8 | 1.34 | 1.36 | 1.26 |
| 2004 | 82,517,000 | 705,622 | 818,271 | -112,649 | 8.6 | 9.9 | -1.4 | 1.36 | 1.37 | 1.31 |
| 2005 | 82,470,000 | 685,795 | 830,227 | -144,432 | 8.3 | 10.1 | -1.8 | 1.34 | 1.36 | 1.30 |
| 2006 | 82,377,000 | 672,724 | 821,627 | -148,903 | 8.2 | 10.0 | -1.8 | 1.33 | 1.34 | 1.30 |
| 2007 | 82,267,000 | 684,862 | 827,155 | -142,293 | 8.3 | 10.1 | -1.7 | 1.37 | 1.38 | 1.37 |
| 2008 | 82,110,000 | 682,514 | 844,439 | -161,925 | 8.3 | 10.3 | -2.0 | 1.38 | 1.37 | 1.40 |
| 2009 | 81,901,000 | 665,126 | 854,544 | -189,418 | 8.1 | 10.4 | -2.3 | 1.36 | 1.35 | 1.40 |
| 2010 | 81,751,000 | 677,947 | 858,768 | -180,821 | 8.3 | 10.5 | -2.2 | 1.39 | 1.39 | 1.46 |
| 2011 | 80,233,100 | 662,685 | 852,328 | -189,643 | 8.3 | 10.6 | -2.4 | 1.39 | 1.38 | 1.46 |
| 2012 | 80,399,000 | 673,544 | 869,582 | -196,038 | 8.4 | 10.8 | -2.4 | 1.41 | 1.40 | 1.48 |
| 2013 | 80,767,000 | 682,069 | 893,825 | -211,756 | 8.4 | 11.1 | -2.6 | 1.42 | 1.41 | 1.49 |
| 2014 | 81,198,000 | 714,927 | 868,356 | -153,429 | 8.8 | 10.7 | -1.9 | 1.47 | 1.47 | 1.54 |
| 2015 | 82,175,700 | 737,575 | 925,200 | -187,625 | 9.0 | 11.3 | -2.3 | 1.50 | 1.50 | 1.56 |
| 2016 | 82,521,700 | 792,141 | 910,902 | -118,761 | 9.6 | 11.0 | -1.4 | 1.59 | 1.60 | 1.64 |
| 2017 | 82,792,400 | 784,901 | 932,272 | -147,371 | 9.5 | 11.3 | -1.8 | 1.57 | 1.58 | 1.61 |
| 2018 | 83,019,200 | 787,523 | 954,874 | -167,351 | 9.5 | 11.5 | -2.0 | 1.57 | 1.58 | 1.60 |
| 2019 | 83,073,100 | 778,090 | 939,520 | -161,430 | 9.4 | 11.3 | -1.9 | 1.54 | 1.56 | 1.56 |
| 2020 | 83,200,000[21] | 765,000 | 982,489 | -215,000 | 9.2 | 11.8 | -2.6 | |||
In 2019, 588,401 (75.6%) children were born to mothers with German citizenship, while 189,689 (24.4%) children were born to mothers with foreign citizenship.
Current vital statistics
- Births for January–October 2019 =
 657,539
 - Births for January–October 2020 = 647,270
- Deaths for January–October 2019 =
 777,813
 - Deaths for January–October 2020 =
 789,332
- Population growth for January–October 2019 = -120,274
- Population growth for January–October 2020 = -142,062
As of November 2020, 874,340 people died in Germany, this is 3% or 22,520 deaths above the 2015-2019 average for the same months.[23]
1945–1990

After the World War II border shifts and expulsions, the Germans from Central and Eastern Europe and the former eastern territories moved westward to post-war Germany. During the partition of Germany, many Germans from East Germany fled to West Germany for political and economic reasons. Since Germany's reunification, there are ongoing migrations from the eastern New Länder to the western Old Länder for economic reasons.
The Federal Republic of Germany and the German Democratic Republic followed different paths when it came to demographics. The politics of the German Democratic Republic was pronatalistic[24] while that of the Federal Republic was compensatory.
Fertility in the GDR was higher than that in the FRG. Demographic politics was only one of the reasons. Women in the GDR had fewer "biographic options", young motherhood was expected of them. State funded costfree childcare was available to all mothers.[25]
- Mother's mean age at first birth in East and West Germany
Note: Berlin is included into East Germany for the year 2002 and 2008. Source: Kreyenfeld (2002); Kreyenfeld et al. (2010); HFD Germany (2010)[26]
| Year | 1960 | 1970 | 1980 | 1985 | 2002 | 2008 |
|---|---|---|---|---|---|---|
| West Germany | 24.9 | 23.8 | 25.0 | 26.2 | 27.6 | 28.7 |
| East Germany | 23.0 | 22.5 | 22.3 | 22.3 | 26.4 | 27.5 |
1990–today
About 1.7 million people have left the new federal states (the East) since the fall of the Berlin Wall, or 12% of the population;[27] a disproportionately high number of them were women under 35.[28]
After 1990, the total fertility rate (TFR) in the East dropped to 0.772 in 1994. This has been attributed to a "demographic shock": people not only had fewer children, they were also less likely to marry or divorce after the end of the GDR; the biographic options of the citizens of the former GDR had increased. Young motherhood seemed to be less attractive and the age of the first birth rose sharply.[25]
In the following years, the TFR in the East started to rise again, surpassing 1.0 in 1997 and 1.3 in 2004, and reaching the West's TFR (1.37) in 2007. In 2010, the East's fertility rate (1.459) clearly exceeded that of the West (1.385), while Germany's overall TFR had risen to 1.393, the highest value since 1990,[29][30] which was still far below the natural replacement rate of 2.1 and the birth rates seen under communism. In 2016, the TFR was 1.64 in the East and 1.60 in the West.[31]
Between 1989 and 2009, about 2,000 schools closed because there were fewer children.[27]
In some regions the number of women between the ages of 20 and 30 has dropped by more than 30%.[27] In 2004, in the age group 18-29 (statistically important for starting families) there were only 90 women for every 100 men in the new federal states (the East, including Berlin).
Until 2007 family politics in the federal republic was compensatory, which means that poor families received more family benefits (such as the Erziehungsgeld) than rich ones. In 2007 the so-called Elterngeld was introduced. According to Christoph Butterwegge the Elterngeld was meant to "motivate highly educated women to have more children"; the poor on the other hand were disadvantaged by the Elterngeld, and now received lower child benefits than the middle classes.[32] The very well-off (who earn more than 250.000 Euro per annum) and those on welfare receive no Elterngeld payments.[33]
In 2013 the following most recent developments were noticed:[34]
- The income of families with young children has risen. Persons holding a college degree, persons older than 30 years and parents with only one child benefited the most. Single parents and young parents did not benefit.
- Fathers are becoming more involved in parenting, and 28% of them now take some time off work (3.3 months on average) when their children are born.
- Mothers are more likely to work and as a result less likely to be economically deprived than they used to be.
- The birth rate of college-educated women has risen.
In the new federal states the fertility rate of college-educated women is now higher than that of those without college degrees. Differences in value priorities and the better availability of childcare in the eastern states are discussed as possible reasons.[35]
Muslims are younger and have more children than non-Muslims in Germany, although their fertility rate is still below replacement level.[36]
In 2019, the non-profit Austrian Institute of Economic Research and the Bertelsmann Stiftung published a study about the economic impact of demographics. The researchers assume a reduction in the per capita income of €3,700 until 2040.[37]
Demographic statistics
Demographic statistics according to the World Population Review.[38]
- One birth every 43 seconds
- One death every 34 seconds
- Net gain of one person every 4 minutes
- One net migrant every 2 minutes
Demographic statistics according to the CIA World Factbook, unless otherwise indicated.[20]
- Population
- 80,457,737 (July 2018 est.)
- 80,594,017 (July 2017 est.)
- 82,175,700 (2015 estimate)
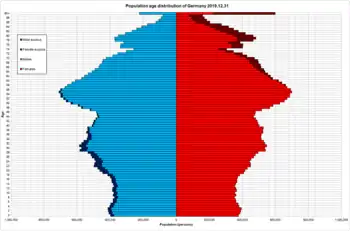
- Age structure
- 0-14 years: 12.83% (male 5,299,798 /female 5,024,184)
- 15-24 years: 9.98% (male 4,092,901 /female 3,933,997)
- 25-54 years: 39.87% (male 16,181,931 /female 15,896,528)
- 55-64 years: 14.96% (male 5,989,111 /female 6,047,449)
- 65 years and over: 22.36% (male 7,930,590 /female 10,061,248) (2018 est.)
- 0–14 years: 12.8% (male 5,304,341/female 5,028,776)
- 15–24 years: 10.1% (male 4,145,486/female 3,986,302)
- 25-54 years: 40.5% (male 16,467,975/female 16,133,964)
- 55-64 years: 14.6% (male 5,834,179/female 5,913,322)
- 65 years and over: 22.06% (male 7,822,221/female 9,957,451) (2017 est.)
- 0–14 years: 13.9% (male 5,894,724; female 5,590,373)
- 15–64 years: 66.1% (male 27,811,357/female 26,790,222)
- 65 years and over: 19.6% (male 6,771,972/female 9,542,348) (2015 est.)
- 0–14 years: 13.7% (male 5,768,366/female 5,470,516)
- 15–64 years: 66.1% (male 27,707,761/female 26,676,759)
- 65 years and over: 20.3% (male 7,004,805/female 9,701,551) (2010 est.)
- Median age
- total: 47.4 years. Country comparison to the world: 3rd
- male: 46.2 years
- female: 48.5 years (2018 est.)
- Birth rate
- 8.6 births/1,000 population (2018 est.) Country comparison to the world: 213rd
- Death rate
- 11.8 deaths/1,000 population (2018 est.) Country comparison to the world: 19th
- 11.7 deaths/1,000 population (2017 est.)
- Total fertility rate
- 1.46 children born/woman (2018 est.) Country comparison to the world: 204th
- 1.43 children born/woman (2014)
- 1.42 children born/woman (2013)
- 1.38 children born/woman (2008)
- Net migration rate
- 1.5 migrant(s)/1,000 population (2018 est.) Country comparison to the world: 56th
- 1.5 migrant(s)/1,000 population (2017 est.)
- Population growth rate
- -0.17% (2018 est.) Country comparison to the world: 208th
- -0.16% (2017 est.)
- Mother's mean age at first birth
- 29.4 years (2015 est.)
- Life expectancy at birth
- total population: 80.8 years. Country comparison to the world: 34th
- male: 78.5 years
- female: 83.3 years (2017 est.)
- Urbanization
- urban population: 77.3% of total population (2018)
- rate of urbanization: 0.27% annual rate of change (2015-20 est.)
- Infant mortality rate
- total: 3.4 deaths/1,000 live births. Country comparison to the world: 205th
- male: 3.7 deaths/1,000 live births
- female: 3.1 deaths/1,000 live births (2017 est.)
- 4.09 deaths per 1,000 live births (2007)
- total: 3.99 deaths/1,000 live births (2010)
- total population: 81 years (2015)
- 80 years (2013)
- Sex ratio
- at birth: 1.06 male(s)/female
- under 15 years: 1.05 male(s)/female
- 15–64 years: 1.04 male(s)/female
- 65 years and over: 0.72 male(s)/female
- total population: 0.97 male(s)/female (2010 est.)
- Dependency ratios
- total dependency ratio: 52.1
- youth dependency ratio: 19.9
- elderly dependency ratio: 32.1
- potential support ratio: 3.1 (2015 est.)
- School life expectancy (primary to tertiary education)
- total: 17 years
- male: 17 years
- female: 17 years (2015)
- Unemployment, youth ages 15–24
- total: 7.2%
- male: 7.9%
- female: 6.5% (2015 est.) Country comparison to the world: 139th
While most childbirths in Germany happen within marriage, a growing number of children are born out-of-wedlock. In 2010 the out-of-wedlock-rate was 33%, more than twice of what it was in 1990.[39]
The Mikrozensus done in 2008 revealed that the number of children a German woman aged 40 to 75 had, was closely linked to her educational achievement.[6] In Western Germany the most educated women were the most likely to be childless. 26% of those groups stated they were childless, while 16% of those having an intermediate education, and 11% of those having compulsory education, stated the same. In Eastern Germany however, 9% of the most educated women of that age group and 7% of those who had an intermediary education were childless, while 12% of those having only compulsory education were childless.
The reason for that east-western difference is that the GDR had an "educated mother scheme" and actively tried to encourage first births among the more educated. It did so by propagandizing the opinion that every educated woman should "present at least one child to socialism" and also by financially rewarding its more educated citizen to become parents. The government especially tried to persuade students to become parents while still in college and it was quite successful in doing so. In 1986 38% of all women, who were about to graduate from college, were mothers of at least one child and additional 14% were pregnant and 43% of all men, who were about to graduate from college, were fathers of at least one child. There was a sharp decline in the birth rate and especially in the birth rate of the educated after the fall of the Berlin wall. Nowadays, 5% of those about to graduate from college are parents.
The more educated a Western German mother aged 40 to 75 was in 2008, the less likely she was to have a big family.
| Percent of Western German mothers having 1, 2 and 3 or more children by educational attainment | ||||
|---|---|---|---|---|
| number of children | compulsory education | intermediary education | highest education | |
| one child | 22 | 30 | 31 | |
| two children | 39 | 48 | 48 | |
| three or more children | 39 | 22 | 21 | |
| [40] | ||||
The same was true for a mother living in Eastern Germany in 2008.
| Percent of Eastern German mothers having 1, 2 and 3 and more children by educational attainment | ||||
|---|---|---|---|---|
| number of children | compulsory education | intermediary education | highest education | |
| one child | 23 | 33 | 33 | |
| two children | 37 | 46 | 51 | |
| three or more children | 40 | 21 | 16 | |
| [40] | ||||
A study done in 2005 in the western German state of Nordrhein-Westfalen by the HDZ revealed that childlessness was especially widespread among scientists. It showed that 78% of the women scientists and 71% of the male scientists working in that state were childless.[41]
Ethnic minorities and migrant background (Migrationshintergrund)
The Federal Statistical Office defines persons with a migrant background as all persons who migrated to the present area of the Federal Republic of Germany after 1949, plus all foreign nationals born in Germany and all persons born in Germany as German nationals with at least one parent who migrated to Germany or was born in Germany as a foreign national. The figures presented here are based on this definition only.
In 2010, 2.3 million families with children under 18 years were living in Germany, in which at least one parent had foreign roots. They represented 29% of the total of 8.1 million families with minor children. Compared with 2005 – the year when the microcensus started to collect detailed information on the population with a migrant background – the proportion of migrant families has risen by 2 percentage points.[42] In 2015, 36% children under 5 years old had migrant background.[43](number includes ethnic German repatriates)
Most of the families with a migrant background live in the western part of Germany. In 2010, the proportion of migrant families in all families was 32% in the former territory of the Federal Republic. This figure was more than double that in the new Länder (incl. Berlin) where it stood at 15%.[42]
Families with a migrant background more often have three or more minor children in the household than families without a migrant background. In 2010, about 15% of the families with a migrant background contained three or more minor children, as compared with just 9% of the families without a migrant background.[42]
In 2009, 3.0 million of the persons of immigrant background had Turkish roots, 2.9 million had their roots in the successor states of the Soviet Union (including a large number of Russian-speaking ethnic Germans), 1.5 million had their roots in the successor states of Yugoslavia including 200.000 Albanians and 1.5 million had Polish roots.[44]
In 2008, 18.4% of Germans of any age group and 30% of German children had at least one parent born abroad. Median age for Germans with at least one parent born abroad was 33.8 years, while that for Germans, who had two parents born in Germany was 44.6 years.[45]
Germany is home to the third-highest number of international migrants worldwide after the United States and Saudi Arabia.[46]
As of 2017, the population by background was as follows:[48]
| Population composition | % | Population[48] |
|---|---|---|
| European (excluding people with European background from Africa, America and Oceania) | 89.7 | 73,357,000 |
| European Union | 87.3 | 71,396,000 |
| German (excluding ethnic German repatriates)[47] | 75.4 | 62,482,000 |
| German repatriates | 3.3 | 2,840,000 |
| Polish (excluding ethnic German repatriates) | 2.5 | 2,100,000 |
| Italian | 1.0 | 861,000 |
| Romanian (excluding ethnic German repatriates) | 0.8 | 859,000 |
| Greek | 0.5 | 438,000 |
| Other EU member states (primarily Spanish, Croatian, Dutch, Portuguese and Austrians) | 3.2 | 2,679,000 |
| European Other | 2.3 | 1,961,000 |
| Russian (excluding ethnic German repatriates) | 1.0 | 1,381,000 |
| Others (primarily former Yugoslavian, excluding Croatia and Slovenia) | 1.3 | 1,180,000 |
| Middle Eastern/Northern African/Central Asian | 5 | 4,552,600 |
| Turkish | 3.2 | 2,774,000 |
| Syrians | 0.8 | 706,000 |
| Others (primarily Iranian, Afghans and Arabs from other countries) | 1.3 | 1,072,000 |
| Sub-Saharan African | 0.5 | 463,000 |
| East Asian and South/Southeast Asian | 2.7 | 2,020,000 |
| Peoples from Kazakhstan (excluding ethnic German repatriates. Probably Russians and other Europeans) | 0.8 | 657,000 |
| Chinese | 0.2 | 180,000 |
| Vietnamese | 0.2 | 168,000 |
| Others | 1.2 | 1,015,000 |
| Americas | 0.5 | 501,000 |
| Americans | 0.2 | 163,000 |
| Australia/Oceania | <0.1 | 40,000 |
| Other/unspecified/mixed | 0.2 | 605,000 |
| Total population | 100 | 81,740,000 |
 Simone Hauswald has Migrationshintergrund due to one side of her parents being foreign-born
_Cropped.jpg.webp) Mesut Özil is classified as having a migrant background because both of his parents were born in Turkey
Mesut Özil is classified as having a migrant background because both of his parents were born in Turkey Helene Fischer has a migrant background despite being ethnically German because she was born in the Soviet Union to parents of the German minority in Russia.
Four other sizable groups of people are referred to as "national minorities" (nationale Minderheiten) because they have lived in their respective regions for centuries: Danes, Frisians, Roma and Sinti, and Sorbs. There is a Danish minority (about 50,000, according to government sources) in the northernmost state of Schleswig-Holstein. Eastern and Northern Frisians live at Schleswig-Holstein's western coast, and in the north-western part of Lower Saxony. They are part of a wider community (Frisia) stretching from Germany to the northern Netherlands. The Sorbs, a Slavic people with about 60,000 members (according to government sources), are in the Lusatia region of Saxony and Brandenburg. They are the last remnants of the Slavs that lived in central and eastern Germany since the 7th century to have kept their traditions and not been completely integrated into the wider German nation.
Until World War II the Poles were recognized as one of the national minorities. In 1924 the Union of Poles in Germany had initiated cooperation between all national minorities in Germany under the umbrella organization Association of National Minorities in Germany. Some of the union members wanted the Polish communities in easternmost Germany (now Poland) to join the newly established Polish nation after World War I. Even before the German invasion of Poland, leading anti-Nazi members of the Polish minority were deported to concentration camps; some were executed at the Piaśnica murder site. Minority rights for Poles in Germany were revoked by Hermann Göring's World War II decree of 27 February 1940, and their property was confiscated.
After the war ended, the German government did not re-implement national minority rights for ethnic Poles. The reason for this is that the areas of Germany which formerly had a native Polish minority were annexed to Poland and the Soviet Union, while almost all of the native German populations (formerly the ethnic majority) in these areas subsequently fled or were expelled by force. With the mixed German-Polish territories now lost, the German government subsequently regarded ethnic Poles residing in what remained of Germany as immigrants, just like any other ethnic population with a recent history of arrival. In contrast, Germans living in Poland are recognized as national minority and have granted seats in Polish Parliament. It must be said, however, that an overwhelming number of Germans in Poland have centuries-old historical ties to the lands they now inhabit, whether from living in territory that once belonged to the German state, or from centuries-old communities. In contrast, most Poles in present-day Germany are recent immigrants, though there are some communities which have been present since the 19th and perhaps even the 18th centuries. Despite protests by some in the older Polish-German communities, and despite Germany being now a signatory to the Framework Convention for the Protection of National Minorities, Germany has so far refused to re-implement minority rights for ethnic Poles, based on the fact that almost all areas of historically mixed German-Polish heritage (where the minority rights formerly existed) are no longer part of Germany and because the vast majority of ethnic Poles now residing in Germany are recent immigrants.
Roma people have been in Germany since the Middle Ages. They were persecuted by the Nazis, and thousands of Roma living in Germany were killed by the Nazi regime. Nowadays, they are spread all over Germany, mostly living in major cities. It is difficult to estimate their exact number, as the German government counts them as "persons without migrant background" in their statistics. There are also many assimilated Sinti and Roma. A vague figure given by the German Department of the Interior is about 70,000. In contrast to the old-established Roma population, the majority of them do not have German citizenship, they are classified as immigrants or refugees.

After World War II, 14 million ethnic Germans were expelled from the eastern territories of Germany and homelands outside the former German Empire. The accommodation and integration of these Heimatvertriebene in the remaining part of Germany, in which many cities and millions of apartments had been destroyed, was a major effort in the post-war occupation zones and later states of Germany.
Since the 1960s, ethnic Germans from the People's Republic of Poland and Soviet Union (especially from Kazakhstan, Russia, and Ukraine), have come to Germany. During the time of Perestroika, and after the dissolution of the Soviet Union, the number of immigrants increased heavily. Some of these immigrants are of mixed ancestry. During the 10-year period between 1987 and 2001, a total of 1,981,732 ethnic Germans from the FSU immigrated to Germany, along with more than a million of their non-German relatives. After 1997, however ethnic Slavs or those belonging to Slavic-Germanic mixed origins outnumbered these with only Germanic descent amongst the immigrants. The total number of people currently living in Germany having FSU connection is around 4 to 4.5 million (Including Germans, Slavs, Jews and those of mixed origins), out of that more than 50% is of German descent.[49][50]
Germany now has Europe's third-largest Jewish population. In 2004, twice as many Jews from former Soviet republics settled in Germany as in Israel, bringing the total inflow to more than 100,000 since 1991.[51] Jews have a voice in German public life through the Central Council of Jews in Germany (Zentralrat der Juden in Deutschland). Some Jews from the former Soviet Union are of mixed heritage.

In 2000 there were also around 300,000–500,000 Afro-Germans (those who have German citizenship)[52] and 150,000+ African nationals. Most of them live in Berlin and Hamburg. Numerous persons from Tunisia and Morocco live in Germany. While they are considered members of a minority group, for the most part, they do not considers themselves "Afro-Germans," nor are most of them perceived as such by the German people. However, Germany does not keep any statistics regarding ethnicity or race. Hence, the exact number of Germans of African descent is unknown.
Germany's biggest East Asian minority are the Vietnamese people in Germany. About 40,000 Vietnamese live in Berlin and surroundings. Also there are about 20,000 to 25,000 Japanese people residing in Germany. Some South Asian and Southeast Asian immigration has taken place. Nearly 50,000 Indians live in Germany. As of 2008, there were 68,000 Filipino residents and an unknown number of Indonesians residing in Germany.[53]
Numerous descendants of the so-called Gastarbeiter live in Germany. The Gastarbeiter mostly came from Chile, Greece, Italy, Morocco, Portugal, Spain, Tunisia, Turkey and the former Yugoslavia. Also included were Vietnam, Mongolia, North Korea, Angola, Mozambique and Cuba when the former East Germany existed until reunification in 1990.[54] The (socialist) German Democratic Republic (East Germany) however had their guest-workers stay in single-sex dormitories.[55] Female guest workers had to sign contracts saying that they were not allowed to fall pregnant during their stay. If they fell pregnant nevertheless they faced forced abortion or deportation.[56] This is one of the reasons why the vast majority of ethnic minorities today lives in western Germany and also one of the reasons why minorities such as the Vietnamese have the most unusual population pyramid, with nearly all second-generation Vietnamese Germans born after 1989.
.svg.png.webp)
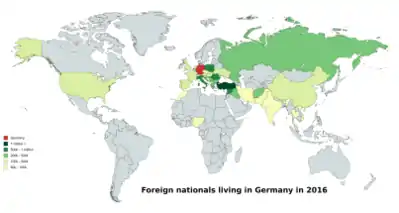
Foreign nationals in Germany
As of 2019, the numbers of selected groups of resident foreign nationals (non-naturalized residents) in Germany were as follows:[58]
This list does not include foreigners with German nationality and foreign nationals without resident status.
| Rank | Nationality | Population | % of foreign nationals |
|---|---|---|---|
| Total | 11,228,300 | 100 | |
| 1 | 1,472,390 | 13.1 | |
| 2 | 862,535 | 7.7 | |
| 3 | 789,465 | 7.0 | |
| 4 | 748,225 | 6.7 | |
| 5 | 646,460 | 5.8 | |
| 6 | 414,890 | 3.7 | |
| 7 | 363,650 | 3.2 | |
| 8 | 360,170 | 3.2 | |
| 9 | 263,420 | 2.3 | |
| 10 | 260,395 | 2.3 | |
| 11 | 255,050 | 2.3 | |
| 12 | 237,755 | 2.1 | |
| 13 | 232,075 | 2.1 | |
| 14 | 211,740 | 1.9 | |
| 15 | 203,265 | 1.8 | |
| 16 | 186,725 | 1.7 | |
| 17 | 177,755 | 1.6 | |
| 18 | 151,145 | 1.3 | |
| 19 | 149,195 | 1.3 | |
| 20 | 143,725 | 1.3 | |
| 21 | 143,545 | 1.3 | |
| 22 | 140,290 | 1.2 | |
| 23 | 138,410 | 1.2 | |
| 24 | 121,835 | 1.1 | |
| 25 | 121,645 | 1.1 | |
| 26 | 115,210 | 1.0 | |
| 27 | 99,725 | 0.9 | |
| 28 | 93,365 | 0.8 | |
| 29 | 78,250 | 0.7 | |
| 30 | 75,495 | 0.7 | |
Genetics of the German native people
The most common Y chromosome haplogroups among German males are Haplogroup R1b, followed by Haplogroup I1, and Haplogroup R1a.[59]
Geography
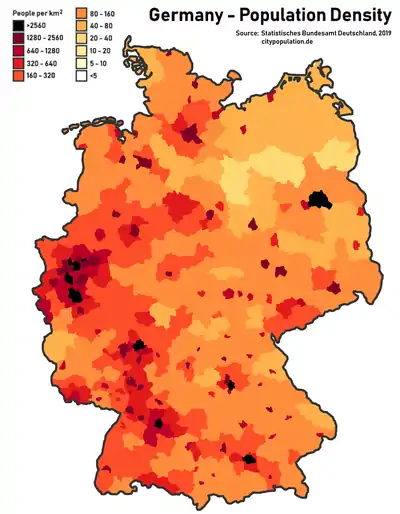
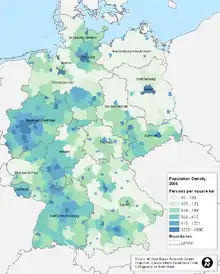
With an estimated more than 81.8 million inhabitants in late 2011,[60] Germany is the most populous country in the European Union and ranks as the 16th largest country in the world in terms of population. Its population density stands at 229.4 inhabitants per square kilometer.
States
Germany comprises sixteen states that are collectively referred to as Länder.[61] Due to differences in size and population the subdivision of these states varies, especially between city-states (Stadtstaaten) and states with larger territories (Flächenländer). For regional administrative purposes five states, namely Baden-Württemberg, Bavaria, Hesse, North Rhine-Westphalia and Saxony, consist of a total of 22 Government Districts (Regierungsbezirke). As of 2009 Germany is divided into 403 districts (Kreise) on municipal level, these consist of 301 rural districts and 102 urban districts.[62]
.svg.png.webp)
|
Cities
Metropolitan regions
Germany officially has eleven metropolitan regions. In 2005, Germany had 82 cities with more than 100,000 inhabitants.
| Metropolitan region | Location | Description | Population | Notes |
|---|---|---|---|---|
| Rhine-Ruhr | 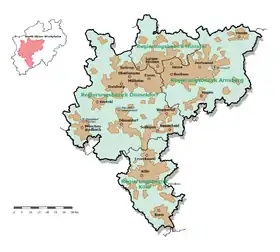 |
The metropolitan area is part of the pan-European Blue Banana mega region and is a significant industrial and commercial hub, home to many of Germany's biggest corporations and contributing as much as 15% to the German GDP. Included in the rather polycentric conurbation are the cities of Cologne, Düsseldorf, Bonn, Dortmund and Essen served by two of the country's largest airports Düsseldorf Airport and the Cologne Bonn Airport. Particularly among young Germans, Cologne and Düsseldorf are known for their nightlife and open-minded atmosphere. | approx. 10 million | Turks, Poles, Italians, Romanians, Africans, Arabs, Greeks, Dutch, Russians, Serbs, Bulgarians and Spaniards |
| Berlin/Brandenburg | 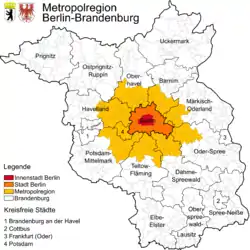 |
Berlin is the capital and largest city. It lies in the eastern part of the country, completely surrounded by the rather sparsely populated state of Brandenburg. Berlin is regarded as one of Europe's most open, vibrant and ever changing capitals. The city is arguably the most diverse city in Germany regarding culture and ethnicity. Regarded as an economically weak region of Germany for a long time, it is now transforming itself into the entrepreneurial center of Europe. Dubbed the "Silicon Allee" by insiders of the tech industry, Berlin is home to countless startup companies and one of Germany's densest knowledge hubs with 4 public universities and countless research centers. | approx. 6 million | Turks, Russians, Poles, Africans, Italians, Americans, Vietnamese, Serbs, Arabs, Bulgarians, Romanians, French and Spaniards |
| Munich | 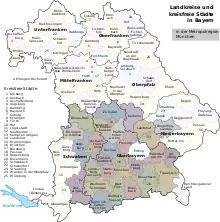 |
The metropolitan area in and around Munich has one of Germany's highest standard of living. Housing some of the countries largest car and machine companies, it is known for its economic strength mixed with the uniqueness of Bavarian culture, taking up almost the entirety of southern Bavaria. It is the closest metropolitan area to the Alps. | approx. 5.7 million | Turks, Croats, Italians, Poles, Greeks, Austrians, Romanians, Arabs, Africans and Serbs |
| Rhine-Main | 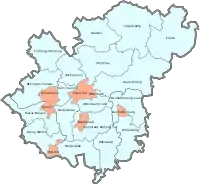 |
Frankfurt is the financial and commercial center both for Germany and continental Europe. Almost all of Germany's big banks and the ECB have their HQ located inside the city of Frankfurt. Despite not having a population of over a million, it is Germany's only city with a large, visible cluster of skyscrapers. The city is one of Europe's biggest transit hubs with Europe's 4th busiest airport (Frankfurt airport), Germany's second busiest railway stations and one of the EU's most heavily used interchanges. | approx. 5.5 million | Turks, Poles, Italians, African, Croats, Romanians, Greeks, Serbs, Spaniards, Americans, Chinese, Arabs and Indians |
| Hamburg | 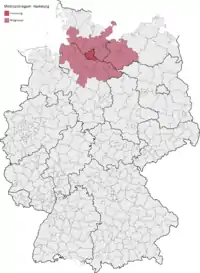 |
Hamburg is the country's second largest city and the biggest Hanseatic city in Europe. It is Europe's 3rd busiest container port with just under 9 million TEUs annually. The city is proud of its diverse nightlife and music scene centered in and around the famous St. Pauli district. | approx. 5.3 million | Turks, Poles, African, Portuguese, Romanians, Russians, Italians and Spaniards |
| Stuttgart | 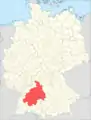 |
Stuttgart has a reputation for research, inventions and industry. The German headquarters of many international enterprises are in Stuttgart. This contrasts with the strong rural, down-to-earth attitude of the Stuttgarters throughout the classes. A popular slogan is "We are good at everything. Except speaking High (standard) German." | approx. 5.2 million | Turks, Greeks, Dutch, Italians, Croats, Serbs, French, Chinese, Romanians, Americans and Spaniards. |
| Hannover–Braunschweig–Göttingen–Wolfsburg | 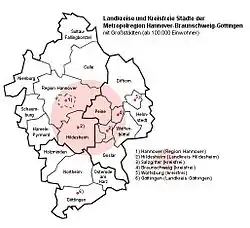 |
The relatively urban south of Lower Saxony, located on route between the Ruhr area and Berlin, and the route form Hamburg to the south, has been important for logistics, industry, but also developed a strong standing in the service industries. | approx. 3.7 million | Turks, Kurds (especially around Celle), Serbs, Ukrainians, Greeks, Russians, Italians (especially in Wolfsburg) and Spanish (Especially in Hanover). |
| Bremen/Oldenburg | 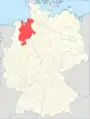 |
Located in the northwestern part of Germany, the main axis contains the cities of Bremen, Delmenhorst and Oldenburg, with the cities of Wilhelmshaven and Bremerhaven being the northern corners at the north sea. Major rural areas are covered in between these cities. There is a smooth transition to the Hamburg metropolitan area to the east. | approx. 2.7 million | Turks, Russians, Albanians, Serbs, Portuguese, Iranians, Dutch, Americans and Britons. |
| Central German Metropolitan Region |  |
The economic region stretches across three federal states. The major city is Leipzig in Saxony, other important cities are Halle/Saale, Gera and Jena. The region is known for its universities and research, for its trade fairs and conventions, as a central distribution hub (Leipzig-Halle-Airport), as center for chemical and industrial production, for the well preserved inner cities and the developed classical and alternative cultural scene. Leipzig is one of the fastest growing cities in Germany with a rising economy. | approx. 2.4 mil | Russians, Poles, Vietnamese, Italians, Romanians, Ukrainians, Chinese, Turks, Portuguese, people from Syria, from Kazakhstan and from Afghanistan.[64] |
Immigration
Germany had signed special visa agreements with several countries in times of severe labour shortages or when particular skills were deficient within the country. During the 1960s and 1970s, agreements were signed with the governments of Turkey, Yugoslavia, Italy and Spain to help Germany overcome its severe labour shortage.
As of 2012, the largest sources of net immigration to Germany are other European countries, most importantly Poland, Romania, Bulgaria, Hungary, Italy, Spain, and Greece; notably, in the case of Turkey, German Turks moving to Turkey slightly outnumber new immigrants.[65]
In 2015, there were 476,649 asylum applications.[66]
Education

Responsibility for educational oversight in Germany lies primarily with the individual federated states. Since the 1960s, a reform movement has attempted to unify secondary education into a Gesamtschule (comprehensive school); several West German states later simplified their school systems to two or three tiers. A system of apprenticeship called Duale Ausbildung ("dual education") allows pupils in vocational training to learn in a company as well as in a state-run vocational school.[67]
Optional kindergarten education is provided for all children between three and six years old, after which school attendance is compulsory for at least nine years, depending on the state. Primary education usually lasts for four years and public schools are not stratified at this stage.[67] In contrast, secondary education includes three traditional types of schools focused on different levels of academic ability: the Gymnasium enrols the most academically promising children and prepares students for university studies; the Realschule for intermediate students lasts six years; the Hauptschule prepares pupils for vocational education.[68]
In addition Germany has a comprehensive school known as the Gesamtschule. While some German schools such as the Gymnasium and the Realschule have rather strict entrance requirements, the Gesamtschule does not have such requirements. They offer college preparatory classes for the students who are doing well, general education classes for average students, and remedial courses for those who aren't doing that well. In most cases students attending a Gesamtschule may graduate with the Hauptschulabschluss, the Realschulabschluss or the Abitur depending on how well they did in school. The percentage of students attending a Gesamtschule varies by Bundesland. In 2007 the State of Brandenburg more than 50% of all students attended a Gesamtschule,[69] while in the State of Bavaria less than 1% did.
The general entrance requirement for university is Abitur, a qualification normally based on continuous assessment during the last few years at school and final examinations; however there are a number of exceptions, and precise requirements vary, depending on the state, the university and the subject. Germany's universities are recognised internationally; in the Academic Ranking of World Universities (ARWU) for 2008, six of the top 100 universities in the world are in Germany, and 18 of the top 200.[70] Nearly all German universities are public institutions, tuition fees in the range of €500 were introduced in some states after 2006, but quickly abolished again until 2014.
Percentage of jobholders holding Hauptschulabschluss, Realschulabschluss or Abitur in Germany[71]
| 1970 | 1982 | 1991 | 2000 | |
| Hauptschulabschluss | 87,7% | 79,3% | 66,5% | 54,9% |
| Realschulabschluss | 10,9% | 17,7% | 27% | 34,1% |
| Abitur | 1,4% | 3% | 6,5% | 11% |
Literacy
Over 99% of those of age 15 and above are estimated to be able to read and write. However, a growing number of inhabitants are functionally illiterate. The young are much more likely to be functionally illiterate than the old. According to a study done by the University of Bremen in cooperation with the "Bundesverband Alphabetisierung e.V.", 10% of youngsters living in Germany are functionally illiterate and one quarter are able to understand only basic level texts.[72] Illiteracy rates of youngsters vary by ethnic group and parents' socioeconomic class.
Health
The life expectancy in Germany is 81.1 years (78.7 years males, 83.6 years females, 2020 est.).[73] As of 2009, the principal cause of death was cardiovascular disease, at 42%, followed by malignant tumours, at 25%.[74] As of 2008, about 82,000 Germans had been infected with HIV/AIDS and 26,000 had died from the disease (cumulatively, since 1982).[75] According to a 2005 survey, 27% of German adults are smokers.[75] A 2009 study shows Germany is near the median in terms of overweight and obese people in Europe.[76]
Religion
The national constitutions of 1919 and 1949 guarantee freedom of faith and religion; earlier, these freedoms were mentioned only in state constitutions. The modern constitution of 1949 also states that no one may be discriminated against due to their faith or religious opinions. A state church does not exist in Germany (see Freedom of religion in Germany).[77]
According to a 1990s poll by Der Spiegel, 45% of Germans believe in God, and a quarter in Jesus Christ.[81] According to the Eurobarometer Poll 2010, 44% of German citizens responded that "they believe there is a God", 25% responded that "they believe there is some sort of spirit or life force" and 27% responded that "they don't believe there is any sort of spirit, God or life force". 4% gave no response.[82]
Christianity is the largest religion in Germany, comprising an estimated 55.1% of the country's population.[83][84]
Smaller religious groups (less than 1%) include Judaism, Buddhism and Hinduism.[85][83]
The two largest churches, the Roman Catholic Church and the Protestant Evangelical Church in Germany (EKD), have lost significant number of adherents. In 2019 the Catholic Church accounted for 27.2%[83][84][86] and the Evangelical Church for 24.9%[83][84][87] of the population. Orthodox Church has 1.9% and other Christian churches and groups summed up to 1.1% of the population.[83][85] Since the reunification of Germany, the number of non-religious people has grown and an estimated 38.8% of the country's population are not affiliated with any church or religion.[83][84][85]
The other religions make up to less than 1% of the population.[85] Buddhism has around 200,000 adherents (0.2%), Judaism has around 200,000 adherents (0.2%), Hinduism 90,000 (0.1%), Sikhism 75,000 (0.1%) and Yazidis religion (45,000-60,000).[88] All other religious communities in Germany have fewer than 50,000 (<0.1%) adherents.
Protestantism is concentrated in the north and east and Roman Catholicism is concentrated in the south and west. According to the last nationwide census, Protestantism is more widespread among the population with German citizenship; there are slightly more Catholics total because of the Catholic immigrant population (including such groups as Poles and Italians).[89] The former Pope, Benedict XVI, was born in Bavaria. Non-religious people, including atheists and agnostics, might make up as many as 55% of the total population, and are especially numerous in the former East Germany and major metropolitan areas.[90]
Of the roughly 4 million Muslims, most are Sunnis and Alevites from Turkey, but there are a small number of Shi'ites and other denominations.[91][92] 1.9% of the country's overall population declare themselves Orthodox Christians,[83] with Serbs, Greeks, Montenegrins, Ukrainians and Russians being the most numerous.[93] Germany has Europe's third-largest Jewish population (after France and the United Kingdom).[94] In 2004, twice as many Jews from former Soviet republics settled in Germany as in Israel, bringing the total Jewish population to more than 200,000, compared to 30,000 prior to German reunification. Large cities with significant Jewish populations include Berlin, Frankfurt and Munich.[95] Around 250,000 active Buddhists live in Germany; 50% of them are Asian immigrants.[96]
2011 Census
Census results were as follows:
- Roman Catholic Church: 24,740,380 or 30.8% of the German population;
- Evangelical Church: 24,328,100 or 30.3% of the German population;
- Other, atheist or not specified (including Protestants outside EKD): 31,151,210 or 38.9% of the German population.[89]
Religion (2011 German Census)
 Evangelical population according to the 2011 Census
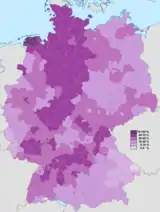
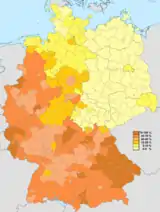 Catholic population according to the 2011 Census
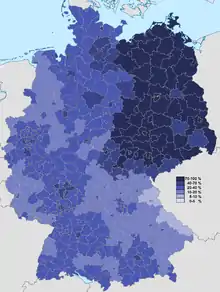 Non-Christian population according to the 2011 Census (including other religions and not specified)
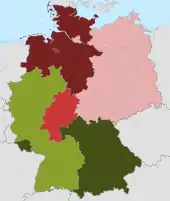
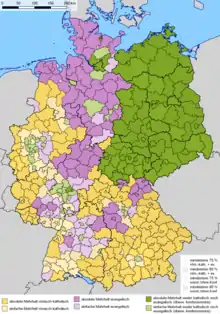 Predominant religious group according to the 2011 Census – Catholics are dominant in the south and west, the non-religious (including other religions and not specified) dominate in the east and the large cities and Protestants dominate in north and central parts of Germany
Languages
German is the only official and most widely spoken language. Standard German is understood throughout the country.
Minority languages
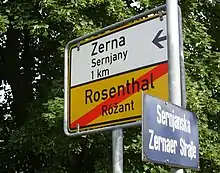
Danish, Low German, Low Rhenish, the Sorbian languages (Lower Sorbian and Upper Sorbian), and the two Frisian languages, Saterfrisian and North Frisian, are officially recognized and protected as minority languages by the European Charter for Regional or Minority Languages in their respective regions. With speakers of Romany living in all parts of Germany, the federal government has promised to take action to protect the language. Until now, only Hesse has followed Berlin's announcement, and agreed on implementing concrete measures to support Romany speakers.
Implementation of the Charter is poor. The monitoring reports on charter implementation in Germany show many provisions unfulfilled.
| Language | States |
|---|---|
| Danish | Schleswig-Holstein |
| North Frisian | Schleswig-Holstein |
| Saterland Frisian | Lower Saxony |
| Low German | Brandenburg, Bremen, Hamburg, Mecklenburg-Vorpommern, Lower Saxony, Saxony-Anhalt, Schleswig-Holstein, North Rhine-Westphalia |
| Low Rhenish | North Rhine-Westphalia |
| Upper Sorbian | Saxony |
| Lower Sorbian | Brandenburg |
| Romany | Hesse de facto, de jure in all states (see text) |
High German dialects

German dialects – some quite distinct from the standard language – are used in everyday speech, especially in rural regions. Many dialects, for example the Upper German varieties, are to some degree cultivated as symbols of regional identity and have their own literature, theaters and some TV programming. While speaking a dialect outside its native region might be frowned upon, in their native regions some dialects can be spoken by all social classes. . Nevertheless, partly due to the prevalence of Standard German in media, the use of dialects has declined over the past century, especially in the younger population.
The social status of different German dialects can vary greatly. The Alemannic and Bavarian dialects of the south are positively valued by their speakers and can be used in almost all social circumstances. The Saxonian and Thuringian dialects have less prestige and are subject to derision. While Bavarian and Alemannic have kept much of their distinctiveness, the Middle German dialects, which are closer to Standard German, have lost some of their distinctive lexical and grammatical features and tend to be only pronunciation variants of Standard German.
Low Saxon dialects
Low Saxon is officially recognized as a language on its own, but despite this fact, there's little official action taken on fostering the language. Historically one third of Germany's territory and population was Low Saxon speaking. No data was ever collected on the actual number of speakers, but today the number of speakers ranges around 5 million persons. Despite this relatively high number of speakers there is very little coverage in the media (mostly on NDR TV, no regular programming) and very little education in or on the language. The language is not fixed as part of the school curriculum and Low Saxon is used as a medium of instruction in one school only in the whole Germany (as a "model project" in primary school sided by education in Standard German). As a consequence the younger generation refused to adopt the native language of their parents. Language prevalence dropped from more than 90% (depending on the exact region) in the 1930s to less than 5% today. This accounts for a massive intergenerational gap in language use. Older people regularly use the language and take private initiative to maintain the language, but the lack of innovative potential of the younger generation hinders language maintenance. The language too has an own literature (around 150 published books every year) and there are many theatres (mostly lay stages, but some professional ones, like for example Ohnsorg-Theater).
Use of Low Saxon is mainly restricted to use among acquaintances, like family members, neighbours and friends. A meeting of a village council can be held almost completely in Low Saxon if all participants know each other (as long as written protocols are written in Standard German), but a single foreigner can make the whole switching to Standard German.
The Low Saxon dialects are different in their status too. There's a north–south gradient in language maintenance. The Southern dialects of Westfalian, Eastfalian and Brandenburgish have had much stronger speaker losses, than the northern coastal dialects of Northern Low Saxon. While Eastfalian has lost speakers to Standard German, Westfalian has lost speakers to Standard German and Standard German based regiolect of the Rhine-Ruhr area. Brandenburgish speakers mostly switched to the Standard German-based regiolect of Berlin. Brandenburgish is almost completely replaced by the Berlin regiolect. Northern Low Saxon speakers switched mostly to pure Standard German.
Foreign languages
English is the most common foreign language and almost universally taught by the secondary level; it is also taught at elementary level in some states. Other commonly-taught languages are French, Italian, Spanish, Portuguese, and Russian. Dutch is taught in states bordering the Netherlands, and Polish in the eastern states bordering Poland. Latin and Ancient Greek are part of the classical education syllabus offered in many secondary schools.
According to a 2004 survey, two-thirds of Germany's citizens have at least basic knowledge of English. About 20% consider themselves to be competent speakers of French, followed by speakers of Russian (7%), Italian (6.1%), and Spanish (5.6%). The relatively high number of Russian speakers is a result of immigration from the former Soviet Union to Germany for almost 10 consecutive years, plus its having been learned in school by many older former East Germans as compulsory first foreign language.
See also
Notes
- In fertility rates, 2.1 and above is a stable population and have been marked blue, 2 and below leads to an aging population and a reducing population.
References
- "The World Factbook". cia.gov. Retrieved 23 October 2015.
- "Bevölkerungsstand". Retrieved 8 November 2020.
- "Lebendgeborene und Gestorbene". Retrieved 13 September 2019.
- "Zusammengefasste Geburtenziffer nach Kalenderjahren". Retrieved 13 September 2019.
- "Zensus 2011" (PDF). Destatis.de. Retrieved 24 August 2017.
- Statistisches Bundesamt. Mikrozensus 2008. Neue Daten zur Kinderlosigkeit in Deutschland. p. 27ff
- Bundesintitut für Bevölkerungsforschung 2012. Talsohle bei Akademikerinnen durchschritten? Kinderzahl und Kinderlosigkeit in Deutschland nach Bildungs- und Berufsgruppen. Expertise für das Bundesministerium für Familie, Senioren, Frauen und Jugend. p. 14
- Michael Blume; Carsten Ramsel; Sven Graupner (June 2006). "Religiosität als demografischer Faktor – Ein unterschätzter Zusammenhang?" (PDF). Marburg Journal of Religion. 11.
- Michael Blume (2008) Homo religiosus, Gehirn und Geist 04/2009. S. 32–41.
- "International Migration Report 2017 - Highlights" (PDF). UN Department of Economic and Social Affairs. Retrieved 9 June 2016.
- Bundeszentrale für politische Bildung: "Die soziale Situation in Deutschland: Bevölkerung mit Migrationshintergrund I
- "Important Economic Indicators". 15 January 2019.
- "Sozialhilfe: Kinderarmut nimmt zu". Focus. 15 November 2007
- Max Roser (2014), "Total Fertility Rate around the world over the last centuries", Our World In Data, Gapminder Foundation, archived from the original on 7 August 2018, retrieved 7 August 2018
- "Life expectancy". Our World in Data. Retrieved 28 August 2018.
- "World Population Prospects – Population Division – United Nations". Archived from the original on 19 September 2016. Retrieved 15 July 2017.
- "Startseite - Statistisches Bundesamt (Destatis)". destatis.de. Retrieved 23 October 2015.
- "Development of births". Federal Statistical Office of Germany.
- "Germany". World Bank.
- "World Factbook EUROPE : GERMANY", The World Factbook, 12 July 2018
- "2020 voraussichtlich kein Bevölkerungswachstum". DESTATIS. Retrieved 12 January 2021.
- "Monthly Birth and Death Statistics". Federal Statistical Office Germany - GENESIS. Retrieved 13 November 2020.
- "Sterbefallzahlen im November 2020: 11 % über dem Durchschnitt der Vorjahre". DESTATIS. Retrieved 30 December 2020.
- Holger Wunderlich. Springer VS. Familienpolitik vor Ort - Strukturen, Akteure und Interaktionen auf kommunaler Ebene. p. 52
- "Berlin-Institut für Bevölkerung und Entwicklung: Ostdeutschland". Berlin-institut.org. Archived from the original on 13 August 2017. Retrieved 24 August 2017.
- Michaela Kreyenfeld; Kryštof Zeman; Marion Burkimsher; Ina Jaschinski, "Fertility data for German-speaking countries What is the potential? Where are the pitfalls?" (PDF), Max Planck Institute for Demographic Research
- Kulish, Nicholas (19 June 2009). "In East Germany, a Decline as Stark as a Wall". The New York Times. Retrieved 11 October 2009.
- "Lack of Women in Eastern Germany Feeds Neo-Nazis". Spiegel Online. Spiegel International. 31 May 2007. Retrieved 11 October 2009.
- "Zusammengefasste Geburtenziffer nach Kalenderjahren". Destatis.de. Retrieved 13 April 2018.
- "East Germany overtakes West Germany: recent trends in order-specific fertility dynamics". Demogr.mpg.de. Archived from the original on 23 September 2015. Retrieved 24 August 2017.
- "State & society - Births - Average number of children per woman - Federal Statistical Office (Destatis)". Destatis.de. Retrieved 13 April 2018.
- Christoph Butterwegge, Michael Klundt, Matthias Zeng: Kinderarmut in Ost- und Westdeutschland. 2., erweiterte und aktualisierte Auflage. VS Verlag für Sozialwissenschaften, 2008, ISBN 978-3-531-15915-7, p. 99–100
- § 10 Abs. 5 BEEG, BGBl. I, S. 1885, 1896
- Bujard, Martin (Hrsg.) (2013): Elterngeld und Elternzeit in Deutschland: Ziele, Diskurse und Wirkungen. Schwerpunktheft der Zeitschrift für Familienforschung, 25. Jg., Band 2, Leverkusen: Verlag Barbara Budrich
- Bundesintitut für Bevölkerungsforschung 2012. Talsohle bei Akademikerinnen durchschritten? Kinderzahl und Kinderlosigkeit in Deutschland nach Bildungs- und Berufsgruppen. Expertise für das Bundesministerium für Familie, Senioren, Frauen und Jugend. p. 15
- "The Growth of Germany's Muslim Population", Pew Research Center, 29 November 2017
- "Prognose: Wohlstand in Deutschland wird sinken". Handelsblatt (in German). 12 December 2019. Retrieved 31 January 2020.
- "Germany Population 2018", World Population Review
- Handelsblatt (12 August 2011): "Familienplanung: Uneheliche Babys im Vormarsch"
- Statistisches Bundesamt. Mikrozensus 2008. Neue Daten zur Kinderlosigkeit in Deutschland. p.29
- Nicole Auferkorte-Michaelis, Sigrid Metz-Göckel, Jutta Wergen, Annette Klein. 2005: "Junge Elternschaft und Wissenschaftskarriere - Wie kinderfreundlich sind Deutschlands Universitäten". Hochschuldidaktisches Zentrum HDZ
- "Publikation - STATmagazin - Population - Families with a migrant background: traditional values count - Federal Statistical Office (Destatis)". destatis.de. 27 August 2012. Retrieved 23 October 2015.
- "Bevölkerung mit Migrations - hintergrund auf Rekordniveau". Statistisches Bundesamt.
- Bundeszentrale für politische Bildung: "Die soziale Situation in Deutschland — Bevölkerung mit Migrationshintergrund I"
- Statistisches Bundesamt Deutschland: "Leichter Anstieg der Bevölkerung mit Migrationshintergrund". Pressemitteilung Nr.105 vom 11 March 2008
- "2017 International Migration Report" UN Department of Economic and Social Affairs. Retrieved 18 March 2011.
- This number represents the number of people without "immigrant background", meaning people with two parents of mostly or full German ancestry. It does not represent the number of people who view themselves as German. This number does not include people with a German forebear, who came to modern Germany after 1955 (including Aussiedler and Spätaussiedler) and descendants of that person.
- "Bevölkerung mit Migrationshintergrund – Ergebnisse des Mikrozensus 2017" (PDF). Destatis.de. Retrieved 1 August 2018.
- Lilo Locher (22 February 2002). "Determining the shape of a migration wave" (PDF). Archived from the original (PDF) on 21 March 2004.
- J. Otto Pohl. "The Deportation and Destruction of the German Minority in the USSR" (PDF). Odessa3.org. Retrieved 24 August 2017.
- "Jewish Population of the World - Jewish Virtual Library". jewishvirtuallibrary.org. Retrieved 23 October 2015.
- Nina Zimnik: Nicht jeder Deutsche ist automatisch weiß Hamburger Abendblatt" vom 15. August 2000
- Archived 20 June 2009 at the Wayback Machine
- "Germany: Immigration in Transition". migrationpolicy.org. July 2004. Retrieved 23 October 2015.
- Stephan Lanz: "Berlin aufgemischt — abendländisch — multikulturell — kosmopolitisch? Die politische Konstruktion einer Einwanderungsstadt". 2007. Bielefeld: transcript Verlag; p. 113
- Karin Weiss: "Die Einbindung ehemaliger vietnamesischer Vertragsarbeiterinnen und Vertragsarbeiter in Strukturen der Selbstorganisation", In: Almut Zwengel: "Die "Gastarbeiter der DDR — politischer Kontext und Lebenswelt". Studien zur DDR Gesellschaft; p. 264
- "Pressemitteilungen - Bevölkerung mit Migrationshintergrund um 8,5 % gestiegen - Statistisches Bundesamt (Destatis)". Destatis.de. Retrieved 24 August 2017.
- https://www.destatis.de/DE/Themen/Gesellschaft-Umwelt/Bevoelkerung/Migration-Integration/Publikationen/Downloads-Migration/auslaend-bevoelkerung-2010200197004.pdf?__blob=publicationFile
- "Y Haplogroups of the World" (PDF). Scs.illinois.edu. Retrieved 24 August 2017.
- "State & society - Current population - Federal Statistical Office (Destatis)". destatis.de. Retrieved 23 October 2015.
- The individual denomination is either Land [state], Freistaat [free state] or Freie (und) Hansestadt [free (and) Hanseatic city].
"The Federal States". Bundesrat.de. Bundesrat of Germany. Retrieved 17 July 2011.
"Amtliche Bezeichnung der Bundesländer" [Official denomination of federated states] (PDF). Auswaertiges-amt.de (in German). Federal Foreign Office. Retrieved 22 October 2011. - "Kreisfreie Städte und Landkreise nach Fläche und Bevölkerung 31.12.2009" (XLS) (in German). Statistisches Bundesamt Deutschland. October 2010. Retrieved 26 September 2011.
- "Gebiet und Bevölkerung – Fläche und Bevölkerung" (in German). Statistisches Bundesamt Deutschland. Retrieved 1 July 2020.
- Website of the City of Leipzig: https://www.leipzig.de/fileadmin/mediendatenbank/leipzig-de/Stadt/02.1_Dez1_Allgemeine_Verwaltung/12_Statistik_und_Wahlen/Statistik/Leipzig_fb_Migranten.pdf
- "See page 21 of this report" (PDF). Bamf.de. Archived from the original (PDF) on 25 October 2017. Retrieved 24 August 2017.
- "2015: Mehr Asylanträge in Deutschland als jemals zuvor". Bundesministerium des Innern. Retrieved 24 August 2017.
- "Country profile: Germany" (PDF). Library of Congress. April 2008. Retrieved 28 March 2011.
- "The Educational System in Germany". Cuesta College. 31 August 2002. Archived from the original on 13 May 2011. Retrieved 16 May 2011.
- Prof Dr. Valentin Merkelbach. "Gesamtschulen und Grundschulen sind das Beste in unserem Schulsystem". Bildungsklick.de. Retrieved 24 August 2017.
- "Top 100 World Universities". Academic Ranking of World Universities. Archived from the original on 22 August 2008. Retrieved 28 March 2011.
- Frietsch, Rainer (November 2003). ""Intensivierung" von Bildungsabschlüssen zwischen 1970 - 2000" (PDF). Studien zum Deutschen Innovationssystem (5–2004). ISSN 1613-4338. Archived from the original (PDF) on 7 October 2007. Retrieved 21 November 2009.
- Teachers News: "Funktionaler Analphabetismus"
- The World Factbook
- "Statistisches Bundesamt Deutschland – Herz-/Kreislauferkrankungen nach wie vor häufigste Todesursache" (in German). Destatis.de. Archived from the original on 6 June 2011. Retrieved 7 June 2011.
- "Country Profile Germany" (PDF). Library of Congress Federal Research Division. April 2008. Retrieved 7 May 2011.
This article may incorporate text from this source, which is in the public domain. - "Statistics Explained". europa.eu. Retrieved 23 October 2015.
- Basic Law Art. 140
- "Bevölkerung und Kirchenzugehörigkeit nach Bundesländern Table 1.1 shows 63.4 % of the German population to be Christians of which 2.2% outside the Evangelische Landeskirchen (EKD) and the Roman Catholic Church. Table 1.3 shows overview by German state of membership of the Evangelische Landeskirchen (EKD) and the Roman Catholic Church" (PDF). Webcitation.org. Archived from the original (PDF) on 20 February 2011. Retrieved 24 August 2017.
- "Religion in Sachsen Anhalt « Sachsen-Anhalt". Archived from the original on 15 October 2015.
- "religion by Bundesland showing non religious being the majority in Eastern Germany" (PDF).
- "By Location". Adherents.com. Retrieved 23 January 2016.
- "Special Eurobarometer, biotechnology, page 204" (PDF). Fieldwork: Jan-Feb 2010. Retrieved 10 September 2017.
- "Religionszugehörigkeiten in Deutschland 2019" (in German). Forschungruppe Weltanschauungen in Deutschland. Retrieved 18 August 2020.
- "Zahlen und Fakten zum kirchlichen Leben" (PDF) (in German). Evangelische Kirche in Deutschland. Retrieved 18 August 2020.
- REMID Data of "Religionswissenschaftlicher Medien- und Informationsdienst" retrieved 16 January 2015
- Official church statistics of the Roman Catholic Church in Germany 2015, Dbk.de, retrieved 25 January 2016
- Official press release of the Evangelical Church in Germany on 2014 membership data, Ekd.de, retrieved 25. January 2016
- "Die Yeziden in Deutschland - Religion und Leben". 23 February 2014. Archived from the original on 23 February 2014. Retrieved 24 August 2017.
- "Zensus 2011 : Bevölkerung und Haushalte Bundesrepublik Deutschland". Ergebnisse.zensus2011.de. 9 May 2011. Retrieved 24 August 2017.
- (in German) Religionen in Deutschland: Mitgliederzahlen Religionswissenschaftlicher Medien- und Informationsdienst; 31 October 2009. Retrieved 19 November 2009.
- "Chapter 2: Wie viele Muslime leben in Deutschland?" [How many Muslims live in Germany?]. Muslimisches Leben in Deutschland [Muslim Life in Germany] (in German). Nuremberg: Federal Office for Migration and Refugees (German: Bundesamt für Migration und Flüchtlinge), an agency of the Federal Ministry of the Interior (Germany). June 2009. p. 80. ISBN 978-3-9812115-1-1. Archived from the original (PDF) on 30 April 2011. Retrieved 9 September 2010.
Demnach leben in Deutschland zwischen 3,8 und4,3 Millionen Muslime [. . .] beträgt der Anteil der Muslime an der Gesamtbevölkerungzwischen 4,6 und 5,2 Prozent. Rund 45 Prozent der in Deutschland lebenden Muslime sind deutsche Staatsangehörige,rund 55 Prozent haben eine ausländische Staatsangehörigkeit.
- "Chapter 2: Wie viele Muslime leben in Deutschland?" [How many Muslims live in Germany?]. Muslimisches Leben in Deutschland [Muslim Life in Germany] (in German). Nuremberg: Federal Office for Migration and Refugees (German: Bundesamt für Migration und Flüchtlinge), an agency of the Federal Ministry of the Interior (Germany). June 2009. p. 97. ISBN 978-3-9812115-1-1. Archived from the original (PDF) on 30 April 2011. Retrieved 9 September 2010.
Der Anteil der Sunniten unter den in den Haushalten lebenden Muslimen beträgt 74 Prozent
- "EKD-Statistik: Christen in Deutschland 2007" (in German). Evangelische Kirche in Deutschland. Archived from the original on 30 April 2011. Retrieved 13 February 2010.
- Blake, Mariah. In Nazi cradle, Germany marks Jewish renaissance The Christian Science Monitor. 10 November 2006. Retrieved 30 November 2006.
- The Jewish Community of Germany European Jewish Congress. Retrieved 30 November 2006.
- (in German) Die Zeit 12/07, page 13
- Including Protestants outside EKD.
External links
| Wikimedia Commons has media related to Demographie Deutschlands. |
- Homepage of the Federal Statistical Office Germany (in English)
- German demographics in Online-Databank HISTAT (in German, Registration needed)
- Dossier "The Aging Society" of the Goethe-Institut
- Demographic Profile Germany: United in Decline Allianz Knowledge