Demographics of Montenegro
This article is about the demographic features of the population of Montenegro, including population density, ethnicity, education level, health of the populace, economic status, religious affiliations and other aspects of the population.
Total population
Population censuses in 1921–2011[1]
| census date | population | population density (per km2) |
|---|---|---|
| 1921 | 311,341 | 22.5 |
| 1931 | 360,044 | 26.1 |
| 1948 | 377,189 | 27.3 |
| 1953 | 419,873 | 30.4 |
| 1961 | 471,894 | 34.2 |
| 1971 | 529,604 | 38.3 |
| 1981 | 584,310 | 42.3 |
| 1991 | 615,035 | 44.5 |
| 2003 | 620,145 | 44.9 |
| 2011 | 620,029 | 44.9 |
The 2003 census was undertaken by Montenegro, which, together with Serbia, constituted Serbia and Montenegro. The census population was 620,145 (including diaspora 672,656).
- According to a 2005 estimate made by the Statistical Office of Montenegro, Montenegro has about 623,000 inhabitants.
- According to a 2006 estimate made by the Statistical Office of Montenegro, Montenegro has about 624,000 inhabitants.
- According to a 2007 estimate made by the Statistical Office of Montenegro, Montenegro has about 625,000 inhabitants.
- According to a 2008 estimate made by the Statistical Office of Montenegro, Montenegro has 627,478 inhabitants.
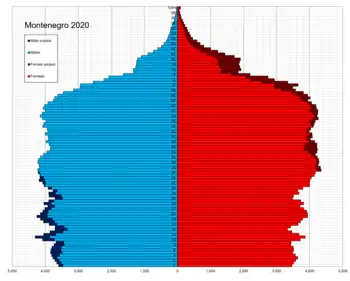
Age structure
| census date | 0–14 years | 15–64 years | 65 years or older |
|---|---|---|---|
| 1921 | 37.7% | 56.3% | 6.0% |
| 1931 | 36.5% | 57.2% | 6.3% |
| 1948 | 38.3% | 54.4% | 7.4% |
| 1953 | 35.5% | 57.1% | 7.4% |
| 1961 | 36.4% | 56.5% | 7.1% |
| 1971 | 31.9% | 60.4% | 7.6% |
| 1981 | 27.5% | 64.3% | 8.2% |
| 1991 | 25.3% | 66.5% | 8.2% |
| 2003 | 20.6% | 67.5% | 12.0% |
| 2011 | 19.2% | 68.1% | 12.8% |
Vital statistics[2][3]
| Average population | Live births | Deaths | Natural change | Crude birth rate (per 1000) | Crude death rate (per 1000) | Natural change (per 1000) | Total fertility rate | Female fertile population (15-49 years) | |
|---|---|---|---|---|---|---|---|---|---|
| 1950 | 397,001 | 11,904 | 3,682 | 8,222 | 30.0 | 9.3 | 20.7 | 4.25 | 96,666 |
| 1951 | 407,001 | 12,898 | 4,416 | 8,482 | 31.7 | 10.9 | 20.8 | 4.52 | 98,818 |
| 1952 | 415,998 | 13,308 | 3,859 | 9,449 | 32.0 | 9.3 | 22.7 | 4.55 | 100,970 |
| 1953 | 422,037 | 13,880 | 4,775 | 9,105 | 32.9 | 11.3 | 21.6 | 4.50 | 103,122 |
| 1954 | 428,001 | 14,428 | 3,862 | 10,566 | 33.7 | 9.0 | 24.7 | 4.48 | 106,325 |
| 1955 | 435,003 | 13,550 | 3,935 | 9,615 | 31.1 | 9.0 | 22.1 | 4.05 | 109,526 |
| 1956 | 440,998 | 13,654 | 3,871 | 9,783 | 31.0 | 8.8 | 22.2 | 3.90 | 112,728 |
| 1957 | 446,999 | 13,751 | 4,172 | 9,579 | 30.8 | 9.3 | 21.4 | 3.80 | 114,825 |
| 1958 | 453,001 | 13,684 | 3,537 | 10,147 | 30.2 | 7.8 | 22.4 | 3.68 | 116,170 |
| 1959 | 460,001 | 12,614 | 3,469 | 9,145 | 27.4 | 7.5 | 19.9 | 3.43 | 113,294 |
| 1960 | 467,002 | 13,127 | 3,583 | 9,544 | 28.1 | 7.7 | 20.4 | 3.58 | 112,441 |
| 1961 | 473,409 | 12,994 | 3,335 | 9,659 | 27.4 | 7.0 | 20.4 | 3.54 | 111,590 |
| 1962 | 482,758 | 13,006 | 3,747 | 9,259 | 26.9 | 7.8 | 19.2 | 3.33 | 116,271 |
| 1963 | 492,113 | 12,982 | 3,454 | 9,528 | 26.4 | 7.0 | 19.4 | 3.26 | 118,519 |
| 1964 | 501,379 | 12,599 | 3,550 | 9,049 | 25.1 | 7.1 | 18.0 | 3.15 | 121,230 |
| 1965 | 510,260 | 12,333 | 3,431 | 8,902 | 24.2 | 6.7 | 17.4 | 3.12 | 122,378 |
| 1966 | 520,000 | 12,209 | 3,199 | 9,010 | 23.5 | 6.2 | 17.3 | 3.06 | 125,718 |
| 1967 | 527,507 | 11,486 | 3,385 | 8,101 | 21.8 | 6.4 | 15.4 | 2.83 | 129,437 |
| 1968 | 534,792 | 11,027 | 3,429 | 7,598 | 20.6 | 6.4 | 14.2 | 2.65 | 134,670 |
| 1969 | 520,484 | 11,259 | 3,325 | 7,934 | 21.6 | 6.4 | 15.2 | 2.67 | 137,450 |
| 1970 | 525,002 | 10,636 | 3,516 | 7,120 | 20.3 | 6.7 | 13.6 | 2.47 | 140,852 |
| 1971 | 530,854 | 10,866 | 3,264 | 7,602 | 20.5 | 6.1 | 14.3 | 2.71 | 134,967 |
| 1972 | 538,997 | 10,938 | 3,512 | 7,426 | 20.3 | 6.5 | 13.8 | 2.61 | 139,772 |
| 1973 | 545,254 | 10,665 | 3,304 | 7,361 | 19.6 | 6.1 | 13.5 | 2.49 | 142,576 |
| 1974 | 551,996 | 10,551 | 3,199 | 7,352 | 19.1 | 5.8 | 13.3 | 2.40 | 145,104 |
| 1975 | 557,995 | 10,557 | 3,279 | 7,278 | 18.9 | 5.9 | 13.0 | 2.34 | 147,571 |
| 1976 | 567,996 | 10,711 | 3,465 | 7,246 | 18.9 | 6.1 | 12.8 | 2.30 | 150,832 |
| 1977 | 575,269 | 10,738 | 3,559 | 7,179 | 18.7 | 6.2 | 12.5 | 2.26 | 153,702 |
| 1978 | 581,958 | 10,584 | 3,660 | 6,924 | 18.2 | 6.3 | 11.9 | 2.18 | 155,604 |
| 1979 | 588,997 | 10,365 | 3,826 | 6,539 | 17.6 | 6.5 | 11.1 | 2.12 | 155,338 |
| 1980 | 579,382 | 10,542 | 3,703 | 6,839 | 18.2 | 6.4 | 11.8 | 2.15 | 155,072 |
| 1981 | 586,029 | 10,335 | 3,680 | 6,655 | 17.6 | 6.3 | 11.4 | 2.24 | 151,056 |
| 1982 | 592,900 | 10,579 | 3,618 | 6,961 | 17.8 | 6.1 | 11.7 | 2.23 | 153,072 |
| 1983 | 599,358 | 10,657 | 4,194 | 6,463 | 17.8 | 7.0 | 10.8 | 2.16 | 155,008 |
| 1984 | 605,924 | 10,521 | 3,915 | 6,606 | 17.4 | 6.5 | 10.9 | 2.10 | 155,795 |
| 1985 | 606,839 | 10,724 | 3,926 | 6,798 | 17.7 | 6.5 | 11.2 | 2.12 | 156,436 |
| 1986 | 607,711 | 10,455 | 3,922 | 6,533 | 17.2 | 6.5 | 10.8 | 2.04 | 158,026 |
| 1987 | 608,144 | 10,567 | 3,990 | 6,577 | 17.4 | 6.6 | 10.8 | 2.04 | 159,914 |
| 1988 | 605,000 | 10,190 | 3,661 | 6,529 | 16.8 | 6.1 | 10.8 | 1.95 | 163,892 |
| 1989 | 601,000 | 9,634 | 3,833 | 5,801 | 16.0 | 6.4 | 9.7 | 1.85 | 162,362 |
| 1990 | 597,000 | 9,380 | 3,936 | 5,444 | 15.7 | 6.6 | 9.1 | 1.79 | 164,450 |
| 1991 | 591,843 | 9,609 | 3,975 | 5,634 | 16.2 | 6.7 | 9.5 | 2.07 | 150,676 |
| 1992 | 594,000 | 9,524 | 4,393 | 5,131 | 16.0 | 7.4 | 8.6 | 2.07 | 150,859 |
| 1993 | 596,000 | 8,922 | 4,471 | 4,451 | 15.0 | 7.5 | 7.5 | 1.95 | 151,042 |
| 1994 | 599,000 | 8,887 | 4,660 | 4,227 | 14.8 | 7.8 | 7.1 | 1.96 | 151,226 |
| 1995 | 601,000 | 9,492 | 4,931 | 4,561 | 15.8 | 8.2 | 7.6 | 2.11 | 151,408 |
| 1996 | 604,464 | 9,094 | 4,982 | 4,112 | 15.0 | 8.2 | 6.8 | 2.04 | 151,592 |
| 1997 | 606,759 | 8,758 | 5,153 | 3,605 | 14.4 | 8.5 | 5.9 | 1.98 | 151,774 |
| 1998 | 609,054 | 9,211 | 5,312 | 3,899 | 15.1 | 8.7 | 6.4 | 2.10 | 151,958 |
| 1999 | 606,677 | 8,828 | 5,393 | 3,435 | 14.6 | 8.9 | 5.7 | 2.03 | 152,142 |
| 2000 | 604,950 | 9,184 | 5,412 | 3,772 | 15.2 | 8.9 | 6.2 | 2.13 | 152,325 |
| 2001 | 607,389 | 8,839 | 5,431 | 3,408 | 14.6 | 8.9 | 5.6 | 2.04 | 152,997 |
| 2002 | 609,828 | 8,499 | 5,513 | 2,986 | 13.9 | 9.0 | 4.9 | 1.95 | 153,623 |
| 2003 | 612,267 | 8,344 | 5,704 | 2,640 | 13.6 | 9.3 | 4.3 | 1.91 | 154,117 |
| 2004 | 613,353 | 7,849 | 5,707 | 2,142 | 12.8 | 9.3 | 3.5 | 1.80 | 154,048 |
| 2005 | 614,261 | 7,352 | 5,839 | 1,513 | 12.0 | 9.5 | 2.5 | 1.69 | 153,298 |
| 2006 | 615,025 | 7,531 | 5,968 | 1,563 | 12.2 | 9.7 | 2.5 | 1.73 | 152,881 |
| 2007 | 615,875 | 7,834 | 5,979 | 1,855 | 12.7 | 9.7 | 3.0 | 1.79 | 152,728 |
| 2008 | 616,969 | 8,258 | 5,708 | 2,550 | 13.4 | 9.3 | 4.1 | 1.88 | 152,163 |
| 2009 | 618,294 | 8,642 | 5,862 | 2,780 | 14.0 | 9.5 | 4.5 | 1.98 | 151,446 |
| 2010 | 619,428 | 7,418 | 5,633 | 1,785 | 12.0 | 9.1 | 2.9 | 1.70 | 150,802 |
| 2011 | 620,079 | 7,215 | 5,847 | 1,368 | 11.6 | 9.4 | 2.2 | 1.65 | 150,151 |
| 2012 | 620,601 | 7,459 | 5,922 | 1,537 | 12.0 | 9.5 | 2.5 | 1.72 | 149,382 |
| 2013 | 621,207 | 7,475 | 5,917 | 1,558 | 12.0 | 9.5 | 2.5 | 1.73 | 148,536 |
| 2014 | 621,810 | 7,529 | 6,014 | 1,515 | 12.1 | 9.7 | 2.4 | 1.75 | 147,669 |
| 2015 | 622,159 | 7,386 | 6,329 | 1,057 | 11.9 | 10.2 | 1.7 | 1.73 | 146,886 |
| 2016 | 622,303 | 7,569 | 6,464 | 1,105 | 12.2 | 10.4 | 1.8 | 1.79 | 146,207 |
| 2017 | 622,373 | 7,432 | 6,523 | 909 | 11.9 | 10.5 | 1.5 | 1.78 | 145,539 |
| 2018[4] | 622,227 | 7,264 | 6,504 | 760 | 11.7 | 10.5 | 1.2 | 1.76 | 144,894 |
| 2019[5][6] | 622,028 | 7,223 | 6,595 | 628 | 11.6 | 10.6 | 1.0 | 1.76 | 144,083 |
| Average population | Live births | Deaths | Natural change | Crude birth rate (per 1000) | Crude death rate (per 1000) | Natural change (per 1000) | Total fertility rate | Female fertile population (15-49 years) | |
| Total 1950-2019 | 715,515 | 313,119 | 402,396 | 1276.4 | 558.6 | 717.8 | |||
| Average 1950-2019 | 560,580 | 10,222 | 4,473 | 5,749 | 18.2 | 8.0 | 10.3 | 2.39 | 141,000 |
Current vital statistics[7]
Births
- from January - November 2019 = 6,602
- from January - November 2020 = 6,558
- Difference between number of births in 2019 and 2020 (January - November) =
 -44 (-0.67%)
Deaths
- from January - November 2019 = 6,005
- from January - November 2020 = 6,488
- Difference between number of deaths in 2019 and 2020 (January - November) =
 +483 (+8.04%)
Natural increase
- from January - November 2019 = +597
- from January - November 2020 = +70
- Difference between natural increase in 2019 and 2020 (January - November) = -527
Marriages and divorces[8]
| Average population | Marriages | Divorces | Crude marriage rate (per 1000) | Crude divorce rate (per 1000) | Divorces per 1000 marriages | |
|---|---|---|---|---|---|---|
| 1950 | 397,001 | 3,185 | 284 | 8.0 | 0.7 | 89.2 |
| 1951 | 407,001 | 3,284 | 187 | 8.1 | 0.5 | 56.9 |
| 1952 | 415,998 | 3,585 | 187 | 8.6 | 0.4 | 52.2 |
| 1953 | 422,037 | 3,867 | 250 | 9.2 | 0.6 | 64.6 |
| 1954 | 428,001 | 3,855 | 252 | 9.0 | 0.6 | 65.4 |
| 1955 | 435,003 | 3,420 | 192 | 7.9 | 0.4 | 56.1 |
| 1956 | 440,998 | 3,524 | 281 | 8.0 | 0.6 | 79.7 |
| 1957 | 446,999 | 3,785 | 311 | 8.5 | 0.7 | 82.2 |
| 1958 | 453,001 | 3,627 | 359 | 8.0 | 0.8 | 99.0 |
| 1959 | 460,001 | 3,376 | 349 | 7.3 | 0.8 | 103.4 |
| 1960 | 467,002 | 3,387 | 399 | 7.3 | 0.9 | 117.8 |
| 1961 | 473,409 | 3,510 | 382 | 7.4 | 0.8 | 108.8 |
| 1962 | 482,758 | 3,735 | 327 | 7.7 | 0.7 | 87.6 |
| 1963 | 492,113 | 3,581 | 346 | 7.3 | 0.7 | 96.6 |
| 1964 | 501,379 | 3,694 | 275 | 7.4 | 0.5 | 74.4 |
| 1965 | 510,260 | 3,788 | 412 | 7.4 | 0.8 | 108.8 |
| 1966 | 520,000 | 3,619 | 402 | 7.0 | 0.8 | 111.1 |
| 1967 | 527,507 | 3,489 | 328 | 6.6 | 0.6 | 94.0 |
| 1968 | 534,792 | 3,643 | 336 | 6.8 | 0.6 | 92.2 |
| 1969 | 520,484 | 3,805 | 274 | 7.3 | 0.5 | 72.0 |
| 1970 | 525,002 | 4,101 | 313 | 7.8 | 0.6 | 76.3 |
| 1971 | 530,854 | 4,155 | 275 | 7.8 | 0.5 | 66.2 |
| 1972 | 538,997 | 4,034 | 245 | 7.5 | 0.5 | 60.7 |
| 1973 | 545,254 | 3,937 | 377 | 7.2 | 0.7 | 95.8 |
| 1974 | 551,996 | 4,040 | 296 | 7.3 | 0.5 | 73.3 |
| 1975 | 557,995 | 4,276 | 268 | 7.7 | 0.5 | 62.7 |
| 1976 | 567,996 | 4,156 | 207 | 7.3 | 0.4 | 49.8 |
| 1977 | 575,269 | 4,475 | 406 | 7.8 | 0.7 | 90.7 |
| 1978 | 581,958 | 4,328 | 234 | 7.4 | 0.4 | 54.1 |
| 1979 | 588,997 | 4,410 | 205 | 7.5 | 0.3 | 46.5 |
| 1980 | 579,382 | 4,429 | 259 | 7.6 | 0.4 | 58.5 |
| 1981 | 586,029 | 4,595 | 283 | 7.8 | 0.5 | 61.6 |
| 1982 | 592,900 | 4,804 | 312 | 8.1 | 0.5 | 64.9 |
| 1983 | 599,358 | 4,288 | 303 | 7.2 | 0.5 | 70.7 |
| 1984 | 605,924 | 4,379 | 356 | 7.2 | 0.6 | 81.3 |
| 1985 | 606,839 | 4,405 | 388 | 7.3 | 0.6 | 88.1 |
| 1986 | 607,711 | 4,193 | 373 | 6.9 | 0.6 | 89.0 |
| 1987 | 608,144 | 4,358 | 289 | 7.2 | 0.5 | 66.3 |
| 1988 | 605,000 | 4,081 | 380 | 6.7 | 0.6 | 93.1 |
| 1989 | 601,000 | 4,022 | 413 | 6.7 | 0.7 | 102.7 |
| 1990 | 597,000 | 3,853 | 324 | 6.5 | 0.5 | 84.1 |
| 1991 | 591,843 | 3,817 | 388 | 6.4 | 0.7 | 101.7 |
| 1992 | 594,000 | 4,041 | 369 | 6.8 | 0.6 | 91.3 |
| 1993 | 596,000 | 3,873 | 354 | 6.5 | 0.6 | 91.4 |
| 1994 | 599,000 | 3,753 | 348 | 6.3 | 0.6 | 92.7 |
| 1995 | 601,000 | 3,791 | 393 | 6.3 | 0.7 | 103.7 |
| 1996 | 604,464 | 3,770 | 477 | 6.2 | 0.8 | 126.5 |
| 1997 | 606,759 | 3,993 | 569 | 6.6 | 0.9 | 142.5 |
| 1998 | 609,054 | 3,628 | 569 | 6.0 | 0.9 | 156.8 |
| 1999 | 606,677 | 3,912 | 462 | 6.4 | 0.8 | 118.1 |
| 2000 | 604,950 | 3,866 | 435 | 6.4 | 0.7 | 112.5 |
| 2001 | 607,389 | 3,893 | 492 | 6.4 | 0.8 | 126.4 |
| 2002 | 609,828 | 3,794 | 506 | 6.2 | 0.8 | 133.4 |
| 2003 | 612,267 | 4,050 | 494 | 6.6 | 0.8 | 122.0 |
| 2004 | 613,353 | 3,440 | 505 | 5.6 | 0.8 | 146.8 |
| 2005 | 614,261 | 3,291 | 499 | 5.4 | 0.8 | 151.6 |
| 2006 | 615,025 | 3,462 | 470 | 5.6 | 0.8 | 135.8 |
| 2007 | 615,875 | 4,005 | 463 | 6.5 | 0.8 | 115.6 |
| 2008 | 616,969 | 3,445 | 460 | 5.6 | 0.7 | 133.5 |
| 2009 | 618,294 | 3,829 | 456 | 6.2 | 0.7 | 119.1 |
| 2010 | 619,428 | 3,675 | 520 | 5.9 | 0.8 | 141.5 |
| 2011 | 620,079 | 3,528 | 471 | 5.7 | 0.8 | 133.5 |
| 2012 | 620,601 | 3,305 | 515 | 5.3 | 0.8 | 155.8 |
| 2013 | 621,207 | 3,847 | 499 | 6.2 | 0.8 | 129.7 |
| 2014 | 621,810 | 3,527 | 584 | 5.7 | 0.9 | 165.6 |
| 2015 | 622,159 | 3,837 | 577 | 6.2 | 0.9 | 150.4 |
| 2016 | 622,303 | 3,178 | 703 | 5.1 | 1.1 | 221.2 |
| 2017 | 622,373 | 3,272 | 765 | 5.3 | 1.2 | 233.8 |
| 2018 | 622,227 | 3,321 | 849 | 5.3 | 1.4 | 255.6 |
| 2019[9] | 622,028 | 3,523 | 841 | 5.7 | 1.4 | 238.7 |
| Average population | Marriages | Divorces | Crude marriage rate (per 1000) | Crude divorce rate (per 1000) | Divorces per 1000 marriages | |
| Total 1950-2019 | 267,744 | 27,672 | ||||
| Average 1950-2019 | 560,580 | 3,825 | 395 | 6.8 | 0.7 | 103.4 |
Vital statistics, marriages and divorces by decade
Vital statistics by decade |
1950-1959 | 1960-1969 | 1970-1979 | 1980-1989 | 1990-1999 | 2000-2009 | 2010-2019 |
|---|---|---|---|---|---|---|---|
| Average population | 430,604 | 502,970 | 556,432 | 599,229 | 600,580 | 612,821 | 621,422 |
| Live births | 13,367 | 12,302 | 10,661 | 10,420 | 9,171 | 8,233 | 7,397 |
| Deaths | 3,958 | 3,444 | 3,458 | 3,844 | 4,721 | 5,712 | 6,175 |
| Natural change | 9,409 | 8,858 | 7,203 | 6,576 | 4,450 | 2,521 | 1,222 |
| Crude birth rate (per 1000) | 31.0 | 24.5 | 19.2 | 17.4 | 15.3 | 13.4 | 11.9 |
| Crude death rate (per 1000) | 9.2 | 6.8 | 6.2 | 6.4 | 7.9 | 9.3 | 9.9 |
| Natural change (per 1000) | 21.9 | 17.6 | 12.9 | 11.0 | 7.4 | 4.1 | 2.0 |
| Total fertility rate | 4.10 | 3.10 | 2.38 | 2.08 | 2.01 | 1.89 | 1.74 |
| Female fertile population (15-49 years) | 107,244 | 122,970 | 146,632 | 157,063 | 152,713 | 152,963 | 147,415 |
Marriages and divorces by decade |
1950-1959 | 1960-1969 | 1970-1979 | 1980-1989 | 1990-1999 | 2000-2009 | 2010-2019 |
| Average population | 430,604 | 502,970 | 556,432 | 599,229 | 600,580 | 612,821 | 621,422 |
| Marriages | 3,551 | 3,625 | 4,191 | 4,355 | 3,843 | 3,708 | 3,501 |
| Divorces | 265 | 348 | 283 | 336 | 425 | 478 | 632 |
| Crude marriage rate (per 1000) | 8.2 | 7.2 | 7.5 | 7.3 | 6.4 | 6.0 | 5.6 |
| Crude divorce rate (per 1000) | 0.6 | 0.7 | 0.5 | 0.6 | 0.7 | 0.8 | 1.0 |
| Divorces per 1000 marriages | 74.7 | 96.0 | 67.4 | 77.1 | 110.7 | 128.9 | 180.6 |
Births and fertility rates[10][11]
Live births by age of mother |
Average 1950-2019 | 1950 | 1951 | 1952 | 1953 | 1954 | 1955 | 1956 | 1957 | 1958 | 1959 | 1960 | 1961 | 1962 | 1963 | 1964 | 1965 | 1966 | 1967 | 1968 | 1969 | 1970 | 1971 | 1972 | 1973 | 1974 | 1975 | 1976 | 1977 | 1978 | 1979 | 1980 | 1981 | 1982 | 1983 | 1984 | 1985 | 1986 | 1987 | 1988 | 1989 | 1990 | 1991 | 1992 | 1993 | 1994 | 1995 | 1996 | 1997 | 1998 | 1999 | 2000 | 2001 | 2002 | 2003 | 2004 | 2005 | 2006 | 2007 | 2008 | 2009 | 2010 | 2011 | 2012 | 2013 | 2014 | 2015 | 2016 | 2017 | 2018 | 2019 | Live births by age of mother |
|---|---|---|---|---|---|---|---|---|---|---|---|---|---|---|---|---|---|---|---|---|---|---|---|---|---|---|---|---|---|---|---|---|---|---|---|---|---|---|---|---|---|---|---|---|---|---|---|---|---|---|---|---|---|---|---|---|---|---|---|---|---|---|---|---|---|---|---|---|---|---|---|---|
Live births total |
10,222 | 11,904 | 12,898 | 13,308 | 13,880 | 14,428 | 13,550 | 13,654 | 13,751 | 13,684 | 12,614 | 13,127 | 12,994 | 13,006 | 12,982 | 12,599 | 12,333 | 12,209 | 11,486 | 11,027 | 11,259 | 10,636 | 10,866 | 10,938 | 10,665 | 10,551 | 10,557 | 10,711 | 10,738 | 10,584 | 10,365 | 10,542 | 10,335 | 10,579 | 10,657 | 10,521 | 10,724 | 10,455 | 10,567 | 10,190 | 9,634 | 9,380 | 9,609 | 9,524 | 8,922 | 8,887 | 9,492 | 9,094 | 8,758 | 9,211 | 8,828 | 9,184 | 8,839 | 8,499 | 8,344 | 7,849 | 7,352 | 7,531 | 7,834 | 8,258 | 8,642 | 7,418 | 7,215 | 7,459 | 7,475 | 7,529 | 7,386 | 7,569 | 7,432 | 7,264 | 7,223 | Live births total |
| Under 15 | 1 | 1 | 1 | 1 | 1 | 1 | 1 | 2 | 0 | 0 | 2 | 2 | 3 | 5 | 2 | 0 | 0 | 0 | 0 | 0 | 1 | 4 | 0 | 0 | 0 | 3 | 1 | 2 | 4 | 0 | 0 | 0 | 0 | 0 | 4 | 0 | 0 | 0 | 2 | 0 | 0 | 0 | 0 | 0 | 2 | 0 | 1 | 1 | 0 | 0 | 1 | 0 | 0 | 0 | 0 | 2 | 3 | 0 | 1 | 5 | 10 | 5 | 5 | 0 | 3 | 3 | 2 | 3 | 2 | 0 | 2 | Under 15 |
| 15-19 | 620 | 707 | 766 | 790 | 894 | 929 | 873 | 893 | 952 | 953 | 814 | 847 | 715 | 714 | 701 | 682 | 767 | 887 | 970 | 929 | 888 | 758 | 728 | 924 | 890 | 889 | 818 | 795 | 767 | 714 | 706 | 490 | 160 | 21 | 778 | 764 | 800 | 781 | 780 | 769 | 736 | 666 | 715 | 640 | 614 | 554 | 602 | 582 | 512 | 542 | 466 | 543 | 487 | 422 | 429 | 394 | 373 | 371 | 393 | 439 | 486 | 358 | 303 | 279 | 248 | 223 | 217 | 195 | 195 | 187 | 218 | 15-19 |
| 20-24 | 3,097 | 3,684 | 3,992 | 4,119 | 4,315 | 4,485 | 4,212 | 4,409 | 4,275 | 4,378 | 3,964 | 4,125 | 4,126 | 4,194 | 4,254 | 3,861 | 3,669 | 3,537 | 3,256 | 3,124 | 3,429 | 3,551 | 3,890 | 4,163 | 4,028 | 3,876 | 3,930 | 3,878 | 3,798 | 3,627 | 3,492 | 3,545 | 3,591 | 3,150 | 3,693 | 3,666 | 3,676 | 3,582 | 3,559 | 3,414 | 3,142 | 2,986 | 2,963 | 3,044 | 2,861 | 2,762 | 2,811 | 2,746 | 2,630 | 2,735 | 2,586 | 2,659 | 2,645 | 2,543 | 2,492 | 2,285 | 1,954 | 1,940 | 1,953 | 2,020 | 2,064 | 1,694 | 1,567 | 1,528 | 1,437 | 1,366 | 1,244 | 1,211 | 1,207 | 1,114 | 1,117 | 20-24 |
| 25-29 | 3,205 | 3,034 | 3,287 | 3,392 | 4,325 | 4,496 | 4,222 | 4,189 | 4,284 | 4,111 | 3,782 | 3,936 | 3,930 | 3,927 | 4,032 | 3,999 | 4,068 | 4,015 | 3,757 | 3,609 | 3,428 | 2,835 | 2,833 | 2,650 | 2,805 | 2,980 | 3,151 | 3,337 | 3,593 | 3,637 | 3,679 | 3,628 | 3,644 | 4,240 | 3,609 | 3,447 | 3,458 | 3,357 | 3,466 | 3,333 | 3,157 | 3,086 | 3,178 | 3,096 | 2,663 | 2,718 | 2,939 | 2,782 | 2,725 | 2,912 | 2,846 | 2,879 | 2,759 | 2,755 | 2,615 | 2,540 | 2,426 | 2,535 | 2,641 | 2,738 | 2,862 | 2,545 | 2,485 | 2,534 | 2,519 | 2,409 | 2,390 | 2,405 | 2,260 | 2,280 | 2,153 | 25-29 |
| 30-34 | 1,998 | 1,796 | 1,946 | 2,008 | 2,357 | 2,450 | 2,301 | 2,362 | 2,508 | 2,527 | 2,437 | 2,536 | 2,552 | 2,528 | 2,358 | 2,365 | 2,267 | 2,201 | 2,110 | 2,029 | 2,115 | 2,169 | 2,158 | 2,047 | 1,853 | 1,638 | 1,511 | 1,503 | 1,476 | 1,551 | 1,548 | 1,891 | 2,126 | 2,433 | 1,876 | 1,819 | 1,893 | 1,878 | 1,909 | 1,862 | 1,764 | 1,823 | 1,845 | 1,829 | 1,817 | 1,884 | 1,959 | 1,831 | 1,761 | 1,840 | 1,759 | 1,929 | 1,792 | 1,738 | 1,756 | 1,674 | 1,637 | 1,737 | 1,803 | 1,946 | 2,018 | 1,821 | 1,865 | 2,002 | 2,050 | 2,121 | 2,103 | 2,217 | 2,202 | 2,223 | 2,227 | 30-34 |
| 35-39 | 924 | 1,597 | 1,730 | 1,785 | 1,184 | 1,231 | 1,156 | 1,078 | 1,080 | 1,141 | 1,097 | 1,142 | 1,137 | 1,113 | 1,170 | 1,235 | 1,138 | 1,183 | 1,052 | 1,012 | 1,036 | 968 | 910 | 865 | 831 | 889 | 876 | 925 | 846 | 789 | 711 | 631 | 559 | 542 | 553 | 629 | 685 | 676 | 698 | 682 | 667 | 665 | 725 | 739 | 759 | 734 | 841 | 831 | 864 | 859 | 832 | 831 | 830 | 757 | 765 | 665 | 696 | 735 | 804 | 792 | 914 | 825 | 823 | 860 | 944 | 951 | 960 | 1,078 | 1,138 | 1,093 | 1,142 | 35-39 |
| 40-44 | 267 | 689 | 747 | 770 | 587 | 610 | 573 | 543 | 446 | 398 | 354 | 368 | 377 | 383 | 358 | 351 | 332 | 294 | 281 | 270 | 282 | 301 | 309 | 268 | 233 | 252 | 244 | 241 | 228 | 232 | 205 | 321 | 238 | 174 | 127 | 134 | 133 | 120 | 126 | 119 | 151 | 135 | 137 | 127 | 159 | 169 | 165 | 196 | 160 | 190 | 174 | 230 | 231 | 225 | 182 | 194 | 167 | 136 | 148 | 180 | 165 | 157 | 155 | 194 | 202 | 203 | 201 | 227 | 244 | 234 | 251 | 40-44 |
| 45-49 | 45 | 209 | 226 | 234 | 142 | 148 | 139 | 128 | 156 | 109 | 96 | 100 | 97 | 98 | 70 | 75 | 68 | 78 | 58 | 54 | 49 | 41 | 37 | 18 | 19 | 24 | 19 | 29 | 24 | 31 | 21 | 27 | 15 | 13 | 16 | 9 | 9 | 11 | 18 | 10 | 10 | 14 | 8 | 9 | 10 | 10 | 8 | 9 | 14 | 8 | 12 | 9 | 6 | 14 | 4 | 10 | 13 | 12 | 7 | 22 | 24 | 10 | 10 | 13 | 18 | 18 | 23 | 14 | 30 | 21 | 19 | 45-49 |
| 50 and over | 9 | 70 | 76 | 78 | 47 | 49 | 46 | 25 | 21 | 8 | 18 | 19 | 35 | 23 | 12 | 15 | 3 | 13 | 0 | 0 | 1 | 7 | 1 | 2 | 4 | 0 | 4 | 0 | 0 | 1 | 1 | 2 | 2 | 2 | 0 | 2 | 1 | 0 | 0 | 0 | 0 | 2 | 3 | 3 | 4 | 0 | 1 | 1 | 0 | 2 | 5 | 0 | 0 | 3 | 1 | 2 | 2 | 0 | 2 | 8 | 3 | 3 | 2 | 6 | 5 | 2 | 2 | 3 | 1 | 1 | 6 | 50 and over |
| Unknown | 55 | 117 | 127 | 131 | 28 | 29 | 27 | 25 | 29 | 59 | 50 | 52 | 22 | 21 | 25 | 16 | 21 | 1 | 2 | 0 | 30 | 2 | 0 | 1 | 2 | 0 | 3 | 1 | 2 | 2 | 2 | 7 | 0 | 4 | 1 | 51 | 69 | 50 | 9 | 1 | 7 | 3 | 35 | 37 | 33 | 56 | 165 | 115 | 92 | 123 | 147 | 104 | 89 | 42 | 100 | 83 | 81 | 65 | 82 | 108 | 96 | 0 | 0 | 43 | 49 | 233 | 244 | 216 | 153 | 111 | 88 | Unknown |
Female fertile population (15-49 years) by age group |
Average 1950-2019 | 1950 | 1951 | 1952 | 1953 | 1954 | 1955 | 1956 | 1957 | 1958 | 1959 | 1960 | 1961 | 1962 | 1963 | 1964 | 1965 | 1966 | 1967 | 1968 | 1969 | 1970 | 1971 | 1972 | 1973 | 1974 | 1975 | 1976 | 1977 | 1978 | 1979 | 1980 | 1981 | 1982 | 1983 | 1984 | 1985 | 1986 | 1987 | 1988 | 1989 | 1990 | 1991 | 1992 | 1993 | 1994 | 1995 | 1996 | 1997 | 1998 | 1999 | 2000 | 2001 | 2002 | 2003 | 2004 | 2005 | 2006 | 2007 | 2008 | 2009 | 2010 | 2011 | 2012 | 2013 | 2014 | 2015 | 2016 | 2017 | 2018 | 2019 | Female fertile population (15-49 years) by age group |
Total female 15-49 years |
141,000 | 96,666 | 98,818 | 100,970 | 103,122 | 106,325 | 109,526 | 112,728 | 114,825 | 116,170 | 113,294 | 112,441 | 111,590 | 116,271 | 118,519 | 121,230 | 122,378 | 125,718 | 129,437 | 134,670 | 137,450 | 140,852 | 134,967 | 139,772 | 142,576 | 145,104 | 147,571 | 150,832 | 153,702 | 155,604 | 155,338 | 155,072 | 151,056 | 153,072 | 155,008 | 155,795 | 156,436 | 158,026 | 159,914 | 163,892 | 162,362 | 164,450 | 150,676 | 150,859 | 151,042 | 151,226 | 151,408 | 151,592 | 151,774 | 151,958 | 152,142 | 152,325 | 152,997 | 153,623 | 154,117 | 154,048 | 153,298 | 152,881 | 152,728 | 152,163 | 151,446 | 150,802 | 150,151 | 149,382 | 148,536 | 147,669 | 146,886 | 146,207 | 145,539 | 144,894 | 144,083 | Total female 15-49 years |
| 10-14 | 23,255 | 22,222 | 22,618 | 23,015 | 23,411 | 22,274 | 21,137 | 20,000 | 24,100 | 23,252 | 20,000 | 22,663 | 25,326 | 25,000 | 20,000 | 20,000 | 20,000 | 25,000 | 25,000 | 25,000 | 25,000 | 40,000 | 28,007 | 29,000 | 29,000 | 30,000 | 30,303 | 20,000 | 20,000 | 28,000 | 27,500 | 27,000 | 25,721 | 26,000 | 20,000 | 26,000 | 25,000 | 25,000 | 20,000 | 25,000 | 25,000 | 26,434 | 25,351 | 24,953 | 24,555 | 24,157 | 23,758 | 23,360 | 22,962 | 22,564 | 22,166 | 21,768 | 21,864 | 21,920 | 22,026 | 21,977 | 21,761 | 21,574 | 21,312 | 21,047 | 20,769 | 20,324 | 19,959 | 19,796 | 19,590 | 19,313 | 18,934 | 18,423 | 17,981 | 17,808 | 17,917 | 10-14 |
| 15-19 | 23,941 | 21,889 | 22,315 | 22,741 | 23,167 | 23,555 | 23,944 | 24,332 | 23,860 | 22,964 | 20,872 | 19,937 | 19,003 | 18,740 | 19,691 | 21,115 | 23,528 | 25,127 | 26,005 | 26,695 | 27,492 | 27,868 | 27,797 | 28,607 | 28,710 | 28,494 | 28,207 | 28,292 | 27,993 | 27,891 | 27,407 | 26,923 | 27,822 | 26,250 | 27,203 | 26,528 | 25,974 | 25,607 | 25,574 | 25,633 | 25,645 | 25,729 | 24,885 | 24,675 | 24,465 | 24,255 | 24,044 | 23,834 | 23,624 | 23,414 | 23,204 | 22,994 | 23,095 | 23,190 | 23,266 | 23,354 | 23,253 | 23,023 | 22,621 | 22,015 | 21,578 | 21,329 | 21,241 | 21,088 | 20,850 | 20,617 | 20,247 | 19,942 | 19,787 | 19,573 | 19,295 | 15-19 |
| 20-24 | 22,855 | 18,663 | 19,283 | 19,903 | 20,523 | 21,062 | 21,601 | 22,140 | 22,715 | 23,018 | 22,651 | 22,545 | 22,438 | 22,536 | 21,815 | 20,658 | 19,747 | 19,057 | 19,346 | 20,051 | 21,418 | 23,439 | 23,028 | 24,260 | 25,478 | 26,603 | 27,216 | 28,061 | 28,535 | 28,627 | 28,064 | 27,502 | 26,228 | 26,740 | 27,214 | 27,481 | 27,618 | 27,682 | 27,611 | 27,117 | 26,537 | 26,129 | 23,278 | 23,101 | 22,923 | 22,746 | 22,569 | 22,392 | 22,214 | 22,037 | 21,860 | 21,683 | 21,779 | 22,005 | 21,937 | 21,596 | 21,291 | 21,226 | 21,310 | 21,369 | 21,262 | 20,999 | 20,612 | 20,164 | 19,746 | 19,544 | 19,636 | 19,753 | 19,641 | 19,516 | 19,354 | 20-24 |
| 25-29 | 21,790 | 13,949 | 14,912 | 15,875 | 16,838 | 17,763 | 18,688 | 19,612 | 20,000 | 20,311 | 19,958 | 19,686 | 19,415 | 21,412 | 21,866 | 22,403 | 22,085 | 22,146 | 21,919 | 21,342 | 20,700 | 19,606 | 16,709 | 17,230 | 18,004 | 19,301 | 21,162 | 23,030 | 24,179 | 25,416 | 25,978 | 26,540 | 23,790 | 24,795 | 25,220 | 25,402 | 25,710 | 26,145 | 26,641 | 27,164 | 27,500 | 27,750 | 23,332 | 23,184 | 23,037 | 22,889 | 22,741 | 22,594 | 22,446 | 22,298 | 22,151 | 22,003 | 22,101 | 22,139 | 22,262 | 22,425 | 22,444 | 22,381 | 22,373 | 22,405 | 22,390 | 22,445 | 22,464 | 22,315 | 22,015 | 21,529 | 20,876 | 20,212 | 19,646 | 19,134 | 18,909 | 25-29 |
| 30-34 | 20,153 | 9,584 | 10,120 | 10,655 | 11,191 | 12,316 | 13,440 | 14,565 | 15,843 | 16,869 | 17,210 | 17,428 | 17,646 | 18,810 | 19,265 | 19,708 | 19,099 | 19,634 | 20,386 | 20,746 | 21,450 | 21,887 | 20,464 | 20,088 | 19,526 | 18,571 | 17,368 | 16,888 | 17,163 | 17,951 | 19,286 | 20,622 | 20,648 | 21,512 | 22,360 | 22,996 | 23,428 | 23,985 | 24,728 | 25,162 | 25,455 | 25,804 | 23,171 | 22,911 | 22,650 | 22,390 | 22,129 | 21,869 | 21,608 | 21,348 | 21,087 | 20,827 | 20,918 | 20,978 | 21,072 | 21,213 | 21,462 | 21,828 | 22,086 | 22,197 | 22,301 | 22,365 | 22,382 | 22,477 | 22,679 | 22,770 | 22,739 | 22,686 | 22,612 | 22,299 | 21,765 | 30-34 |
| 35-39 | 18,522 | 12,238 | 11,462 | 10,687 | 9,911 | 9,867 | 9,822 | 9,778 | 10,385 | 11,275 | 11,834 | 12,416 | 12,998 | 14,900 | 15,984 | 16,964 | 16,985 | 17,500 | 17,922 | 20,119 | 18,700 | 18,906 | 17,927 | 18,886 | 19,236 | 19,756 | 20,231 | 20,330 | 20,000 | 19,481 | 18,199 | 16,917 | 15,758 | 16,083 | 16,557 | 17,521 | 19,081 | 20,485 | 21,411 | 22,288 | 23,000 | 23,489 | 21,780 | 21,674 | 21,569 | 21,463 | 21,358 | 21,252 | 21,147 | 21,041 | 20,936 | 20,830 | 20,921 | 21,000 | 21,074 | 20,948 | 20,680 | 20,537 | 20,553 | 20,723 | 20,901 | 21,168 | 21,459 | 21,611 | 21,692 | 21,756 | 21,973 | 22,114 | 22,165 | 22,387 | 22,513 | 35-39 |
| 40-44 | 17,471 | 10,971 | 11,441 | 11,910 | 12,380 | 12,210 | 12,039 | 11,869 | 10,799 | 9,755 | 8,917 | 9,033 | 9,150 | 9,770 | 10,687 | 11,661 | 12,434 | 13,184 | 14,192 | 14,917 | 16,023 | 16,722 | 16,468 | 16,855 | 17,007 | 17,379 | 17,554 | 18,120 | 18,689 | 19,016 | 19,355 | 19,693 | 19,653 | 19,121 | 18,676 | 17,867 | 16,625 | 15,789 | 15,949 | 16,528 | 17,558 | 19,108 | 19,821 | 20,068 | 20,315 | 20,563 | 20,810 | 21,057 | 21,304 | 21,552 | 21,799 | 22,046 | 22,145 | 22,211 | 22,306 | 22,355 | 22,113 | 21,808 | 21,612 | 21,241 | 20,852 | 20,587 | 20,444 | 20,468 | 20,695 | 20,908 | 21,047 | 21,261 | 21,425 | 21,494 | 21,554 | 40-44 |
| 45-49 | 16,269 | 9,372 | 9,285 | 9,199 | 9,112 | 9,552 | 9,992 | 10,432 | 11,223 | 11,978 | 11,852 | 11,396 | 10,940 | 10,103 | 9,211 | 8,721 | 8,500 | 9,070 | 9,667 | 10,800 | 11,667 | 12,424 | 12,574 | 13,846 | 14,615 | 15,000 | 15,833 | 16,111 | 17,143 | 17,222 | 17,049 | 16,875 | 17,157 | 18,571 | 17,778 | 18,000 | 18,000 | 18,333 | 18,000 | 20,000 | 16,667 | 16,441 | 14,409 | 15,246 | 16,083 | 16,920 | 17,757 | 18,594 | 19,431 | 20,268 | 21,105 | 21,942 | 22,038 | 22,100 | 22,200 | 22,157 | 22,055 | 22,078 | 22,173 | 22,213 | 22,162 | 21,909 | 21,549 | 21,259 | 20,859 | 20,545 | 20,368 | 20,239 | 20,263 | 20,491 | 20,693 | 45-49 |
| 50-54 | 16,005 | 8,750 | 8,958 | 9,167 | 9,375 | 9,164 | 8,953 | 8,741 | 8,750 | 8,889 | 9,000 | 9,785 | 10,570 | 17,692 | 10,909 | 11,538 | 10,000 | 10,833 | 10,000 | 10,000 | 10,000 | 8,750 | 8,815 | 10,000 | 10,000 | 14,000 | 13,333 | 16,000 | 17,000 | 10,000 | 15,000 | 20,000 | 15,991 | 20,000 | 17,000 | 20,000 | 10,000 | 18,000 | 18,000 | 21,000 | 16,000 | 19,094 | 18,615 | 18,822 | 19,030 | 19,237 | 19,444 | 19,652 | 19,859 | 20,066 | 20,274 | 20,481 | 20,571 | 20,614 | 20,721 | 21,026 | 21,298 | 21,527 | 21,810 | 21,957 | 21,940 | 21,827 | 21,824 | 21,913 | 21,933 | 21,891 | 21,674 | 21,324 | 21,020 | 20,636 | 20,332 | 50-54 |
General,specific and total fertility rates |
Average 1950-2019 | 1950 | 1951 | 1952 | 1953 | 1954 | 1955 | 1956 | 1957 | 1958 | 1959 | 1960 | 1961 | 1962 | 1963 | 1964 | 1965 | 1966 | 1967 | 1968 | 1969 | 1970 | 1971 | 1972 | 1973 | 1974 | 1975 | 1976 | 1977 | 1978 | 1979 | 1980 | 1981 | 1982 | 1983 | 1984 | 1985 | 1986 | 1987 | 1988 | 1989 | 1990 | 1991 | 1992 | 1993 | 1994 | 1995 | 1996 | 1997 | 1998 | 1999 | 2000 | 2001 | 2002 | 2003 | 2004 | 2005 | 2006 | 2007 | 2008 | 2009 | 2010 | 2011 | 2012 | 2013 | 2014 | 2015 | 2016 | 2017 | 2018 | 2019 | General,specific and total fertility rates |
General fertility rate |
72.49 | 123.15 | 130.52 | 131.80 | 134.60 | 135.70 | 123.71 | 121.12 | 119.76 | 117.79 | 111.34 | 116.75 | 116.44 | 111.86 | 109.54 | 103.93 | 100.78 | 97.11 | 88.74 | 81.88 | 81.91 | 75.51 | 80.51 | 78.26 | 74.80 | 72.71 | 71.54 | 71.01 | 69.86 | 68.02 | 66.73 | 67.98 | 68.42 | 69.11 | 68.75 | 67.53 | 68.55 | 66.16 | 66.08 | 62.18 | 59.34 | 57.04 | 63.77 | 63.13 | 59.07 | 58.77 | 62.69 | 59.99 | 57.70 | 60.62 | 58.02 | 60.29 | 57.77 | 55.32 | 54.14 | 50.95 | 47.96 | 49.26 | 51.29 | 54.27 | 57.06 | 49.19 | 48.05 | 49.93 | 50.32 | 50.99 | 50.28 | 51.77 | 51.07 | 50.13 | 50.13 | General fertility rate |
| Under 15 | 0.06 | 0.05 | 0.04 | 0.04 | 0.04 | 0.04 | 0.05 | 0.10 | 0.00 | 0.00 | 0.10 | 0.09 | 0.12 | 0.20 | 0.10 | 0.00 | 0.00 | 0.00 | 0.00 | 0.00 | 0.04 | 0.10 | 0.00 | 0.00 | 0.00 | 0.10 | 0.03 | 0.10 | 0.20 | 0.00 | 0.00 | 0.00 | 0.00 | 0.00 | 0.20 | 0.00 | 0.00 | 0.00 | 0.10 | 0.00 | 0.00 | 0.00 | 0.00 | 0.00 | 0.08 | 0.00 | 0.04 | 0.04 | 0.00 | 0.00 | 0.05 | 0.00 | 0.00 | 0.00 | 0.00 | 0.09 | 0.14 | 0.00 | 0.05 | 0.24 | 0.49 | 0.25 | 0.25 | 0.00 | 0.15 | 0.16 | 0.11 | 0.17 | 0.11 | 0.00 | 0.11 | Under 15 |
| 15-19 | 26.03 | 32.30 | 34.67 | 35.08 | 38.67 | 39.52 | 36.53 | 36.70 | 39.90 | 41.50 | 39.00 | 42.65 | 37.69 | 38.10 | 35.60 | 32.30 | 32.60 | 35.30 | 37.30 | 34.80 | 32.30 | 27.20 | 26.19 | 32.30 | 31.00 | 31.20 | 29.00 | 28.10 | 27.40 | 25.60 | 25.76 | 18.20 | 5.75 | 0.80 | 28.60 | 28.80 | 30.80 | 30.50 | 30.50 | 30.00 | 28.70 | 25.89 | 28.84 | 26.04 | 25.19 | 22.99 | 25.48 | 24.73 | 21.90 | 23.46 | 20.42 | 23.89 | 21.30 | 18.29 | 18.66 | 17.05 | 16.22 | 16.25 | 17.56 | 20.21 | 22.78 | 16.78 | 14.26 | 13.31 | 11.97 | 11.16 | 11.08 | 10.07 | 10.06 | 9.70 | 11.44 | 15-19 |
| 20-24 | 136.25 | 197.40 | 209.08 | 209.01 | 210.68 | 213.37 | 195.38 | 199.14 | 188.20 | 190.20 | 175.00 | 183.70 | 184.20 | 186.10 | 195.00 | 186.90 | 185.80 | 185.60 | 168.30 | 155.80 | 160.10 | 151.50 | 168.92 | 171.60 | 158.10 | 145.70 | 144.40 | 138.20 | 133.10 | 126.70 | 124.45 | 128.90 | 136.91 | 117.80 | 135.70 | 133.40 | 133.10 | 129.40 | 128.90 | 125.90 | 118.40 | 114.32 | 127.75 | 132.28 | 125.27 | 122.20 | 126.76 | 124.21 | 119.65 | 125.79 | 120.30 | 124.04 | 122.69 | 116.14 | 114.98 | 106.94 | 92.80 | 92.19 | 92.62 | 95.78 | 98.17 | 80.67 | 76.03 | 76.22 | 73.26 | 72.13 | 65.52 | 63.11 | 62.74 | 57.97 | 58.43 | 20-24 |
| 25-29 | 147.86 | 217.50 | 222.61 | 215.79 | 257.38 | 253.62 | 226.38 | 213.59 | 214.20 | 202.40 | 189.50 | 200.73 | 202.76 | 183.40 | 184.40 | 178.50 | 184.20 | 181.30 | 171.40 | 169.10 | 165.60 | 144.60 | 169.55 | 153.80 | 155.80 | 154.40 | 148.90 | 144.90 | 148.60 | 143.10 | 141.65 | 136.70 | 153.17 | 171.00 | 143.10 | 135.70 | 134.50 | 128.40 | 130.10 | 122.70 | 114.80 | 111.24 | 136.71 | 134.06 | 116.03 | 119.50 | 131.52 | 124.71 | 122.69 | 132.36 | 130.66 | 132.34 | 126.11 | 125.06 | 118.89 | 114.48 | 109.30 | 114.25 | 119.29 | 123.82 | 129.26 | 113.39 | 110.62 | 114.22 | 115.18 | 115.47 | 118.40 | 122.48 | 117.45 | 121.01 | 115.27 | 25-29 |
| 30-34 | 99.68 | 187.40 | 194.21 | 190.33 | 211.04 | 199.33 | 171.54 | 162.17 | 158.30 | 149.80 | 141.60 | 146.09 | 144.87 | 134.40 | 122.40 | 120.00 | 118.70 | 112.10 | 103.50 | 97.80 | 98.60 | 99.10 | 105.45 | 101.90 | 94.90 | 88.20 | 87.00 | 89.00 | 86.00 | 86.40 | 80.28 | 91.70 | 102.96 | 113.10 | 83.90 | 79.10 | 80.80 | 78.30 | 77.20 | 74.00 | 69.30 | 70.67 | 79.92 | 80.14 | 80.52 | 84.68 | 90.09 | 84.80 | 82.36 | 87.36 | 84.83 | 93.68 | 86.54 | 83.26 | 84.34 | 79.76 | 77.13 | 80.27 | 82.50 | 88.83 | 91.51 | 81.42 | 83.33 | 89.59 | 90.99 | 96.13 | 95.64 | 100.59 | 99.43 | 101.24 | 103.58 | 30-34 |
| 35-39 | 50.15 | 130.50 | 152.43 | 168.69 | 119.70 | 125.02 | 117.93 | 110.25 | 104.00 | 101.20 | 92.70 | 92.34 | 87.62 | 74.70 | 73.20 | 72.80 | 67.00 | 67.60 | 58.70 | 50.30 | 55.40 | 51.20 | 50.76 | 45.80 | 43.20 | 45.00 | 43.30 | 45.50 | 42.30 | 40.50 | 39.08 | 37.30 | 35.47 | 33.70 | 33.40 | 35.90 | 35.90 | 33.00 | 32.60 | 30.60 | 29.00 | 28.32 | 33.41 | 34.23 | 35.32 | 34.41 | 40.07 | 39.60 | 41.29 | 41.38 | 40.41 | 40.35 | 40.08 | 36.23 | 36.74 | 32.08 | 34.03 | 36.10 | 39.53 | 38.72 | 44.22 | 38.97 | 38.35 | 40.03 | 43.81 | 45.11 | 45.18 | 50.18 | 52.42 | 49.58 | 51.35 | 35-39 |
| 40-44 | 15.38 | 62.80 | 65.94 | 65.29 | 47.51 | 50.06 | 47.69 | 45.75 | 41.30 | 40.80 | 39.70 | 40.90 | 41.27 | 39.20 | 33.50 | 30.10 | 26.70 | 22.30 | 19.80 | 18.10 | 17.60 | 18.00 | 18.76 | 15.90 | 13.70 | 14.50 | 13.90 | 13.30 | 12.20 | 12.20 | 10.59 | 16.30 | 12.11 | 9.10 | 6.80 | 7.50 | 8.00 | 7.60 | 7.90 | 7.20 | 8.60 | 7.07 | 6.94 | 6.35 | 7.86 | 8.27 | 8.07 | 9.43 | 7.59 | 8.94 | 8.12 | 10.55 | 10.54 | 10.18 | 8.26 | 8.77 | 7.64 | 6.29 | 6.92 | 8.59 | 8.00 | 7.63 | 7.58 | 9.53 | 9.83 | 10.02 | 9.88 | 10.99 | 11.63 | 11.06 | 11.79 | 40-44 |
| 45-49 | 2.77 | 22.30 | 24.58 | 25.69 | 15.62 | 15.53 | 13.94 | 12.27 | 13.90 | 9.10 | 8.10 | 8.81 | 8.88 | 9.70 | 7.60 | 8.60 | 8.00 | 8.60 | 6.00 | 5.00 | 4.20 | 3.30 | 2.94 | 1.30 | 1.30 | 1.60 | 1.20 | 1.80 | 1.40 | 1.80 | 1.23 | 1.60 | 0.87 | 0.70 | 0.90 | 0.50 | 0.50 | 0.60 | 1.00 | 0.50 | 0.60 | 0.85 | 0.56 | 0.59 | 0.62 | 0.59 | 0.46 | 0.49 | 0.73 | 0.40 | 0.58 | 0.41 | 0.28 | 0.64 | 0.18 | 0.46 | 0.60 | 0.55 | 0.32 | 1.00 | 1.10 | 0.46 | 0.46 | 0.62 | 0.87 | 0.90 | 1.17 | 0.71 | 1.51 | 1.04 | 0.93 | 45-49 |
| 50 and over | 0.59 | 8.00 | 8.57 | 8.59 | 5.02 | 5.36 | 5.15 | 2.86 | 2.40 | 0.90 | 2.00 | 1.95 | 3.32 | 1.30 | 1.10 | 1.30 | 0.30 | 1.20 | 0.00 | 0.00 | 0.10 | 0.80 | 0.11 | 0.20 | 0.40 | 0.00 | 0.30 | 0.00 | 0.00 | 0.10 | 0.07 | 0.10 | 0.13 | 0.10 | 0.00 | 0.10 | 0.10 | 0.00 | 0.00 | 0.00 | 0.00 | 0.10 | 0.16 | 0.16 | 0.21 | 0.00 | 0.05 | 0.05 | 0.00 | 0.10 | 0.25 | 0.00 | 0.00 | 0.15 | 0.05 | 0.10 | 0.09 | 0.00 | 0.09 | 0.37 | 0.14 | 0.14 | 0.09 | 0.28 | 0.23 | 0.09 | 0.10 | 0.14 | 0.05 | 0.05 | 0.30 | 50 and over |
Total fertility rate (15–49) |
2.39 | 4.25 | 4.52 | 4.55 | 4.50 | 4.48 | 4.05 | 3.90 | 3.80 | 3.68 | 3.43 | 3.58 | 3.54 | 3.33 | 3.26 | 3.15 | 3.12 | 3.06 | 2.83 | 2.65 | 2.67 | 2.47 | 2.71 | 2.61 | 2.49 | 2.40 | 2.34 | 2.30 | 2.26 | 2.18 | 2.12 | 2.15 | 2.24 | 2.23 | 2.16 | 2.10 | 2.12 | 2.04 | 2.04 | 1.95 | 1.85 | 1.79 | 2.07 | 2.07 | 1.95 | 1.96 | 2.11 | 2.04 | 1.98 | 2.10 | 2.03 | 2.13 | 2.04 | 1.95 | 1.91 | 1.80 | 1.69 | 1.73 | 1.79 | 1.88 | 1.98 | 1.70 | 1.65 | 1.72 | 1.73 | 1.75 | 1.73 | 1.79 | 1.78 | 1.76 | 1.76 | Total fertility rate (15–49) |
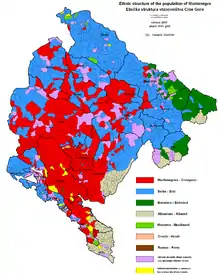
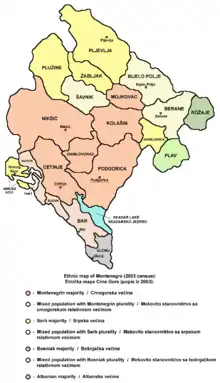
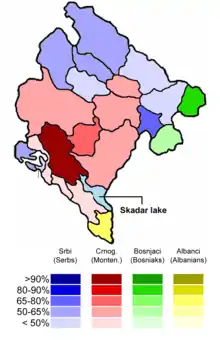
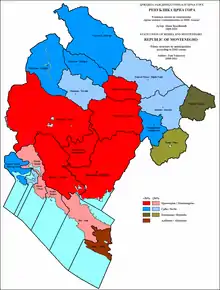
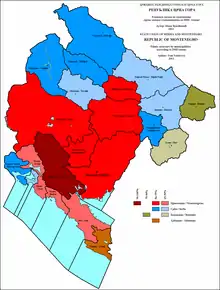
Nationality/Ethnicity
Ethnic population 1948–20111
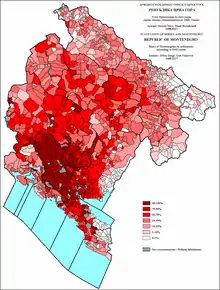
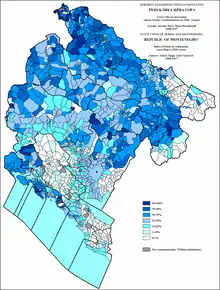
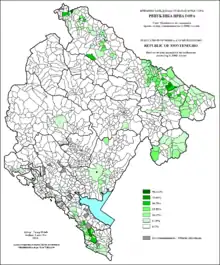
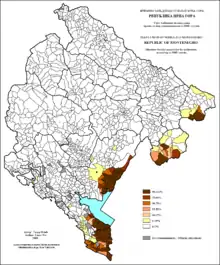
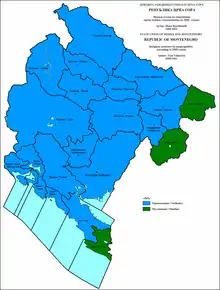
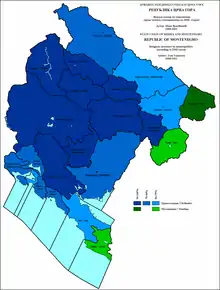
The vast majority (over 90%) of the population of Montenegro is of Slavic origin. Albanians make up 5 percent of the population (4.9% at the 2011 census), while there is also a small Romani and "Egyptians" minority (total 1,2% at the 2011 census). The Slavic population of Montenegro uses a large diversity in ethnic identities to describe their ethnicity. During the first decades after WW II most Slavic people identified themselves as Montenegrins, with less than 2% Serbs and less than 2% Croats in 1948. During the last decades of the existence of Yugoslavia up to 5% of the population declared themselves Yugoslavs (South-Slavs). During and after the Yugoslav Wars the ethnic identity of the Serbs (and in general the political influence of Serbia) became increasingly important in Montenegro and at the 2003 census almost one third of the population identified themselves as Serbs. The Serbs live mostly along the borders with Bosnia and Serbia, while the Montenegrins live in the center of the country. The Slavic population are in majority Eastern Orthodox Christians, but there is also a large Muslim minority, like in Bosnia and Herzegovina. Although most of the Slavic Muslims in Montenegro initially also identified themselves as Montenegrins, gradually over time more and more Slavic Muslims started to use the term Muslim as an ethnic designation, thus opting for a distinctive ethno-religious identity. After the Yugoslav Wars this changed again and at the 2003 and 2011 census most ethnic Muslims declared themselves Bosniaks, mainly because they had some historical relations with Bosniaks in Bosnia and Herzegovina and mostly live in the northeast of Montenegro.
| Ethnic group |
census 1948 | census 1953 | census 1961 | census 1971 | census 1981 | census 1991 | census 2003 | census 2011 | ||||||||
|---|---|---|---|---|---|---|---|---|---|---|---|---|---|---|---|---|
| Number | % | Number | % | Number | % | Number | % | Number | % | Number | % | Number | % | Number | % | |
| Montenegrins | 342,009 | 90.7 | 363,686 | 86.6 | 383,988 | 81.4 | 355,632 | 67.2 | 400,488 | 68.5 | 380,647 | 61.9 | 267,669 | 43.2 | 278,865 | 45.0 |
| Serbs | 6,707 | 1.8 | 13,864 | 3.3 | 14,087 | 3.0 | 39,512 | 7.5 | 19,407 | 3.3 | 57,453 | 9.3 | 198,414 | 32.0 | 178,110 | 28.7 |
| Croats | 6,808 | 1.8 | 9,814 | 2.3 | 10,664 | 2.3 | 9,192 | 1.7 | 6,904 | 1.2 | 6,244 | 1.0 | 6,811 | 1.1 | 6,021 | 0.9 |
| Yugoslavs | 1,559 | 0.3 | 10,943 | 2.1 | 31,243 | 5.3 | 26,159 | 4.3 | 1,860 | 0.3 | 1,154 | 0.2 | ||||
| Muslims | 387 | 0.1 | 6,424 | 1.5 | 30,665 | 6.5 | 70,236 | 13.3 | 78,080 | 13.4 | 89,614 | 14.6 | 24,625 | 4.0 | 20,537 | 3.3 |
| Bosniaks | 48,184 | 7.8 | 53,605 | 8.6 | ||||||||||||
| Albanians | 19,425 | 5.1 | 23,460 | 5.6 | 25,803 | 5.5 | 35,671 | 6.7 | 37,735 | 6.5 | 40,415 | 6.6 | 31,163 | 5.0 | 30,439 | 4.9 |
| Romani | 162 | 0.0 | 230 | 0.1 | 183 | 0.0 | 396 | 0.1 | 1,471 | 0.3 | 3,282 | 0.5 | 2,601 | 0.4 | 6,251 | 1.0 |
| Macedonians | 133 | 0.0 | 362 | 0.1 | 593 | 0.1 | 723 | 0.1 | 875 | 0.1 | 1,072 | 0.2 | 819 | 0.1 | 900 | 0.1 |
| Others/undeclared | 1,558 | 0.4 | 2,033 | 0.5 | 4,352 | 0.9 | 7,299 | 1.4 | 8,107 | 1.4 | 10,149 | 1.7 | 37,9992 | 6.1 | 44,5244 | 7.2 |
| Total | 377,189 | 419,873 | 471,894 | 529,604 | 584,310 | 615,035 | 620,1453 | 620,029 | ||||||||
| 1 Source: Statistical Office of Montenegro
2 including 415 Slovenes (0.07%), 362 Hungarians (0.06%), 240 Russians (0.03%), 225 Egyptians (0.04%), 127 Italians (0.02%), 118 Germans (0.02%), 2,180 others (0.31%), no response 26,906 (4.34%), Regional affiliation 1,258 (0.2%), Unknown 6,168 (0.99%) 3 The total population including diaspora was 672,656 (Montenegrins 273,366 or 40.64%, Serbs: 201,892 or 30.01%, Bosniaks: 63,272 or 9.41%, Albanians: 47,682 or 7.09%, Muslims: 28,714 or 4.27%, Croats: 7,062 or 1.05%) 4 including 354 Slovenes (0.05%), 337 Hungarians (0.05%), 946 Russians (0.15%), 2,054 Egyptians (0.33%), 135 Italians (0.02%), 131 Germans (0.02%), 197 Gorani (0.03%),104 Turkish (0.01%), 8,090 others (1,30%), Regional affiliation 1,202 (0.2%), Unknown 30,170 (4.8%) | ||||||||||||||||
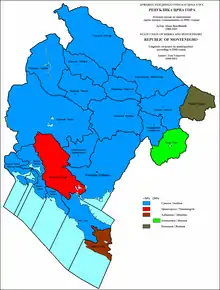
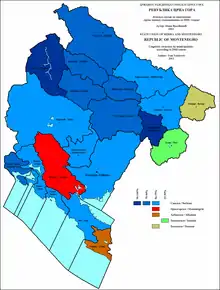
Ethnic structure by region
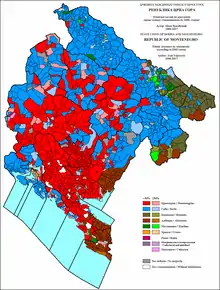
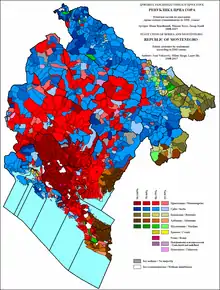
According to the 2003 census (November 2003 data)
Andrijevica total 6.384
- Montenegrins 1.475 or 23,10%
- Ethnic Muslims 8 or 0,13%
- Serbs 4.155 or 65,08%
- Albanians 0 or 0,00%
- Croats 2 or 0,03%
- Bosniaks 0 or 0,00%
- Romani 0 or 0,00%
- other 22 or 0,34%
not declared 234 or 3,67% no data 488 or 7,64%
Bar total 45.223
- Montenegrins 19.960 or 44,14%
- Ethnic Muslims 2.852 or 6,31%
- Serbs 11.218 or 24,81%
- Albanians 5.450 or 12,05%
- Croats 268 or 0,59%
- Bosniaks 1.026 or 2,27%
- Romani 50 or 0,11%
- other 722 or 1,60%
- not declared 1.771 or 3,92%
- no data 1.906 or 4,21%
Berane total 40.885
- Montenegrins 9282 or 22,70%
- Ethnic Muslims 2.994 or 7,32%
- Serbs 16.939 or 41,43%
- Albanians 41 or 0,10%
- Croats 50 or 0,12%
- Bosniaks 8.994 or 22,00%
- Romani 133 or 0,33%
- other 222 or 0,54%
- not declared 223 or 0,55%
- no data 837 or 2,05%
Bijelo Polje total 57.124
- Montenegrins 9.214 or 16,13%
- Ethnic Muslims 9.816 or 17,18%
- Serbs 20.743 or 36,31%
- Albanians 35 or 0,06%
- Croats 49 or 0,09%
- Bosniaks 14.409 or 25,22%
- Romani 146 or 0,26%
other 165 or 0,29% not declared 1.033 or 1,81% no data 1.514 or 2,65%
Budva total 16.095
- Montenegrins 7.333 or 45,56%
- Ethnic Muslims 205 or 1,27%
- Serbs 6.510 or 40,45%
- Albanians 60 or 0,37%
- Croats 177 or 1,10%
- Bosniaks 22 or 0,14%
- Romani 37 or 0,23%
- other 460 or 2,86%
- not declared 1.153 or 7,16%
- no data 138 or 0,86%
Cetinje total 18.749
- Montenegrins 16.927 or 90,28%
- Ethnic Muslims 21 or 0,11%
- Serbs 865 or 4,61%
- Albanians 46 or 0,25%
- Croats 47 or 0,25%
- Bosniaks 5 or 0,03%
- Romani 131 or 0,70%
- other 170 or 0,91%
- not declared 303 or 1,62%
- no data 234 or 1,25%
Danilovgrad total 16.400
- Montenegrins 11.141 or 67,93%
- Ethnic Muslims 53 or 0,32%
- Serbs 4.177 or 25,47%
- Albanians 8 or 0,05%
- Croats 42 or 0,26%
- Bosniaks 0 or 0,00%
- Romani 11 or 0,07%
- other 127 or 0,77%
- not declared 428 or 2,61%
- no data 413 or 2,52%
Herceg Novi total 33971
- Montenegrins 9.651 or 28,41%
- Ethnic Muslims 218 or 0,64%
- Serbs 17.818 or 52,45%
- Albanians 25 or 0,07%
- Croats 831 or 2,45%
- Bosniaks 89 or 0,26%
- Romani 290 or 0,85%
- other 1.350 or 3,97%
- not declared 2.800 or 8,24%
- no data 899 or 2,65%
Kolašin total 9.975
- Montenegrins 5.022 or 50,35%
- Ethnic Muslims 34 or 0,34%
- Serbs 4.449 or 44,60%
- Albanians 1 or 0,01%
- Croats 11 or 0,11%
- Bosniaks 1 or 0,01%
- Romani 0 or 0,00%
- other 74 or 0,74%
- not declared 337 or 3,38%
- no data 46 or 0,46%
Kotor total 23.481
- Montenegrins 11.002 or 46,85%
- Ethnic Muslims 109 or 0,46%
- Serbs 7.197 or 30,65%
- Albanians 63 or 0,27%
- Croats 1.842 or 7,84%
- Bosniaks 17 or 0,07%
- Romani 36 or 0,15%
- other 746 or 3,18%
- not declared 2.255 or 9,60%
- no data 214
Mojkovac total 10.274
- Montenegrins 5.627 or 54,77%
- Ethnic Muslims 18 or 0,18%
- Serbs 4.200 or 40,88%
- Albanians 1 or 0,01%
- Croats 3 or 0,03%
- Bosniaks9 or 0,09%
- Romani 0 or 0,00%
- other 53 or 0,52%
- not declared 332 or 3,23%
- no data 31 or 0,30%
Nikšić total 76.671
- Montenegrins 47.923 or 62,50%
- Ethnic Muslims 733 or 0,96%
- Serbs 20.433 or 26,65%
- Albanians 32 or 0,04%
- Croats 139 or 0,18%
- Bosniaks 177 or 0,23%
- Romani 346 or 0,45%
- other 743 or 0,97%
- not declared 5.483 or 7,15%
- no data 662 or 0,86%
Plav total 21.604
- Montenegrins 790 or 3,66%
- Ethnic Muslims 1.249 or 5,78%
- Serbs 2.731 or 12,64%
- Albanians 5.673 or 26,26%
- Croats 4 or 0,02%
- Bosniaks 10.960 or 50,73%
- Romani 0 or 0,00%
- other 78 or 0,36%
- not declared 73 or 0,34%
- no data 46 or 0,21%
Pljevlja total 36.918
- Montenegrins 7.750 or 20,99%
- Ethnic Muslims 3.088 or 8,36%
- Serbs 21.972 or 59,52%
- Albanians 11 or 0,03%
- Croats 17 or 0,05%
- Bosniaks 2.023 or 5,48%
- Romani 0 or 0,00%
- other 148 or 0,40%
- not declared 1.705 or 4,62%
- no data 204 or 0,55%
Plužine total 4.294
- Montenegrins 1.400 or 32,60%
- Ethnic Muslims 1 or 0,02%
- Serbs 2.601 or 60,57%
- Albanians 0 or 0,00%
- Croats 1 or 0,02%
- Bosniaks 0 or 0,00%
- Romani 0 or 0,00%
- other 12 or 0,28%
- not declared 260 or 6,05%
- no data 19 or 0,44%
Podgorica total 179.403
- Montenegrins 98.562 or 54,94%
- Ethnic Muslims 4.782 or 2,67%
- Serbs 44.992 or 25,08%
- Albanians 14.238 or 7,94%
- Croats 734 or 0,41%
- Bosniaks 2.672 or 1,49%
- Romani 1.542 or 0,86%
- other 2.184 or 1,22%
- not declared 7.506 or 4,18%
- no data 2.191 or 1,22%
Rožaje total 27.562
- Montenegrins 453 or 1,64%
- Ethnic Muslims 1.670 or 6,06%
- Serbs 916 or 3,32%
- Albanians 1.190 or 4,32%
- Croats 8 or 0,03%
- Bosniaks 22.512 or 81,68%
- Romani 15 or 0,05%
- other 405 or 1,47%
- not declared 73 or 0,26%
- no data 320 or 1,16%
Šavnik total 2.972
- Montenegrins 1.386 or 46,64%
- Ethnic Muslims 5 or 0,17%
- Serbs 1.416 or 47,64%
- Albanians 0 or 0,00%
- Croats 3 or 0,10%
- Bosniaks 0 or 0,00%
- Romani 0 or 0,00%
- other 25 or 0,84%
- not declared 130 or 4,37%
- no data 7 or 0,24%
Tivat total 13.991
- Montenegrins 4.126 or 29,49%
- Ethnic Muslims 165 or 1,18%
- Serbs 4.911 or 35,10%
- Albanians 144 or 1,03%
- Croats 2.761 or 19,73%
- Bosniaks 56 or 0,40%
- Romani 20 or 0,14%
- other 470 or 3,36%
- not declared 1.122 or 8,02%
- no data 216 or 1,54%
Ulcinj total 26.435
- Montenegrins 2.523 or 9,54%
- Ethnic Muslims 692 or 2,62%
- Serbs 1.520 or 5,75%
- Albanians 20.664 or 78,17%
- Croats 70 or 0,26%
- Bosniaks 300 or 1,13%
- Romani 118 or 0,45%
- Black Montenegrins 185 or 0,70%
- other 185 or 0,70%
- not declared 216 or 0,82%
- no data 147 or 0,56%
Žabljak total 4.245
- Montenegrins 1.819 or 42,85%
- Ethnic Muslims 1 or 0,02%
- Serbs 2.129 or 50,15%
- Albanians 0 or 0,00%
- Croats 3 or 0,07%
- Bosniaks 0 or 0,00%
- Romani 0 or 0,00%
- other 15 or 0,35%
- not declared 278 or 6,55%
This census witnessed the emerging of ethnic Bosniaks; although there are still people who declare themselves as ethnic Muslims. Also, there are very few people left who consider themselves Yugoslavs. Also a noticeable difference compared to 1991 census is the reemerging in the number of Serbs, from nearly 60,000 to 200,000 in a decade (compared to 1931s 90% strong Serb community).
Others include small ethnic groups of perceived non-European/Slavic origins: Romani, Balkan Egyptians and Black Montenegrins who are thought to be local Turks.
Linguistic structure
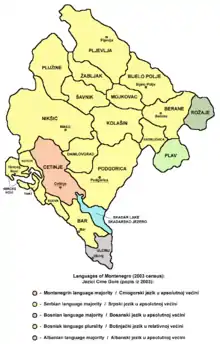
- Serbian: 393,740 (63.49%)
- Serbs - 197,684 (50.21%)
- Montenegrins - 156,374 (39.71%)
- Ethnic Muslims - 8,696 (2.21%)
- Bosniaks - 2,723 (0.69%)
- Croats - 2,529 (0.64%)
- Yugoslavs - 1,705 (0.43%)
- Albanians - 306 (0.08%)
- Romany - 157 (0.04%)
- others - 1,847 (0.47%)
- undeclared and undefined - 18,610 (4.73%)
- regional affiliation - 891 (0.23%)
- unknown - 2,218 (0.56%)
- Montenegrin: 136,208 (21.96%)
- Montenegrins - 106,214 (78%)
- Ethnic Muslims - 13,627 (10%)
- Bosniaks - 12,549 (9.21%)
- Croats - 1,375 (1.01%)
- Serbs - 349 (0.26%)
- Albanians - 330 (0.24%)
- Yugoslavs - 33 (0.02%)
- Romany - 8 (0.01%)
- others - 349 (0.26%)
- undeclared and undefined - 1,106 (0.81%)
- regionally declared - 80 (0.06%)
- unknown - 188 (0.14%)
- Albanian: 32,603 (5.26%)
- Albanians - 30,382 (93.19%)
- Montenegrins - 776 (2.38%)
- Ethnic Muslims - 414 (1.27%)
- Romany - 288 (0.88%)
- Bosniaks - 15 (0.05%)
- Serbs - 8 (0.02%)
- Yugoslavs - 8 (0.02%)
- Croats - 3 (0.01%)
- others - 361 (1.11%)
- undeclared and undefined - 168 (0.51%)
- regionally declared - 74 (0.23%)
- unknown - 106 (0.32%)
- Bosniak language: 19,906 (3.2%)
- Bosniaks - 18,662 (93.75%)
- Ethnic Muslims - 1,094 (5.5%)
- Albanians - 72 (0.36%)
- Montenegrins - 37 (0.19%)
- Croats - 2 (0.01%)
- Yugoslavs - 2 (0.01%)
- others - 15 (0.07%)
- undeclared and undefined - 11 (0.05%)
- regionally declared - 6 (0.03%)
- unknown - 5 (0.02%)
- Bosnian: 14,172 (2.29%)
- Bosniaks - 13,718 (96.8%)
- Ethnic Muslims - 282 (1.99%)
- Albanians - 38 (0.27%)
- Montenegrins - 24 (0.17%)
- Serbs - 6 (0.04%)
- Croats - 6 (0.04%)
- Yugoslavs - 1 (0.01%)
- others - 15 (0.11%)
- undeclared and undefined - 20 (0.14%)
- regionally declared - 60 (0.42%)
- unknown - 2 (0.01%)
- Croatian: 2,791 (0.45%)
- Croats - 2,438 (87.35%)
- Serbs - 92 (3.3%)
- Montenegrins - 82 (2.94%)
- Yugoslavs - 15 (0.54%)
- Ethnic Muslims - 11 (0.39%)
- Bosniaks - 5 (0.18%)
- Albanians - 4 (0.14%)
- others - 36 (1.29%)
- undeclared and undefined - 84 (3.01%)
- regionally declared - 14 (0.5%)
- unknown - 10 (0.36%)
- Roma: 2,602 (0.42%)
- Macedonian: 507 (0.08%)
- Hungarian: 255 (0.04%)
- Slovene: 232 (0.04%)
- German: 126 (0.02%)
- other: 3,101 (0.5%)
- nondeclared and unknown: 13,902 (2.2%)
Religious structure
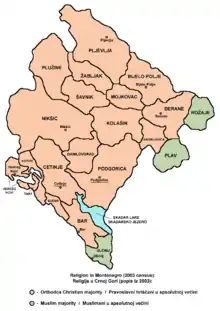
From 2003:
- Orthodox Christianity - 460,383 (74.24%)
- Montenegrins - 241,728 (52.51%)
- Serbs - 196,333 (42.65%)
- Yugoslavs - 1,286 (0.28%)
- Romany - 250 (0.05%)
- Croats - 107 (0.02%)
- Ethnic Muslims - 71 (0.01%)
- Bosniaks - 32 (0.01%)
- Albanians - 27 (0.01%)
- others - 2,191 (0.48%)
- undeclared and undefined - 15,853 (3.44%)
- regionally declared - 651 (0.14%)
- unknown - 1,854 (0.4%)
- Islam - 110,034 (17.74%)
- Bosniaks - 47,852 (43.49%)
- Ethnic Muslims - 24,111 (21.91%)
- Albanians - 22,834 (20.75%)
- Montenegrins - 11,710 (10.64%)
- Romany - 1,942 (1.77%)
- Yugoslavs - 38 (0.03%)
- Serbs - 33 (0.03%)
- Croats - 6 (0.01%)
- others - 486 (0.44%)
- undeclared and undefined - 766 (0.7%)
- regionally declared - 75 (0.07%)
- unknown - 181 (0.16%)
- Roman Catholic - 21,972 (3.54%)
- Albanians - 8,126 (36.98%)
- Croats - 6,262 (28.5%)
- Montenegrins - 5,000 (22.76%)
- Yugoslavs - 128 (0.58%)
- Serbs - 114 (0.52%)
- Romany - 11 (0.05%)
- Bosniaks - 4 (0.02%)
- Ethnic Muslims - 4 (0.02%)
- others - 1,112 (5.06%)
- undeclared and undefined - 689 (3.14%)
- regionally declared - 370 (1.68%)
- unknown - 152 (0.69%)
- Protestant - 383 (0.06%)
- Montenegrins - 144 (37.6%)
- Serbs - 51 (13.32%)
- Romany - 18 (4.7%)
- Bosniaks - 7 (1.83%)
- Croats - 7 (1.83%)
- Yugoslavs - 4 (1.04%)
- Albanians - 2 (0.52%)
- Ethnic Muslims - 1 (0.26%)
- others - 103 (26.89%)
- undeclared and undefined - 31 (8.09%)
- regionally declared - 7 (1.83%)
- unknown - 8 (2.09%)
- occult - 58 (0.01%)
- Montenegrins - 27 (46.55%)
- Serbs - 2 (3.45%)
- Bosniaks - 1 (1.72%)
- Ethnic Muslims - 1 (1.72%)
- Croats - 1 (1.72%)
- others - 3 (5.17%)
- undeclared and undefined - 2 (3.45%)
- unknown - 1 (1.72%)
- Judaism - 12
- Montenegrins - 2 (16.67%)
- Serbs - 2 (16.67%)
- others - 8 (66.66%)
- agnostics - 2,424 (0.39%)
- nondeclared - 13,867 (2.24%)
- none - 6,003 (0.97%)
- unknown - 5,009 (0.8%)
Refugees from Kosovo
- Montenegrins - 5,817
- Serbs - 4,495
- Romani - 3,105
- Ethnic Muslims - 1,823
- Egyptians - 1,539
- Albanians - 457
- Bosniaks - 333
- Gorani 83
- Ashkali - 79
- Yugoslavs - 72
- Croats - 27
- Macedonians - 23
- Slovenes 9
- other - 53
- nondeclared - 32
- Total - 17,947
See also
References
- Statistical yearbook 2011
- MONSTAT
- "Eurostat database".
- "Statistical yearbook 2019" (PDF).
- "Vital statistics in Montenegro 2019" (PDF).
- "The estimate of number of population and demographic indicators 2019" (PDF).
- "Monthly statistical review".
- "Marriages and divorces".
- "Marriages and divorces in Montenegro in 2019" (PDF).
- "Population estimations - Data".
- "Live births by age of mother".