Demographics of Greece
The Demographics of Greece refer to the demography of the population that inhabits the Greek peninsula. The population of Greece was estimated by the United Nations to be 10,522,246 in 2018 (including displaced refugees).
| Demographics of the Hellenic Republic | |
|---|---|
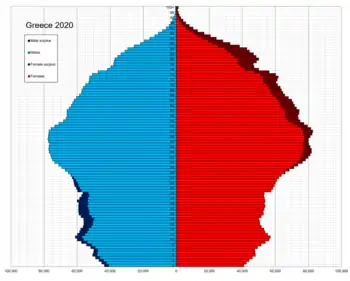 Greece population pyramid in 2020 | |
| Population | 10.718.565 |
| Growth rate | -1.01 people/1,000 population (2010 est.) |
| Birth rate | 9.45 births/1,000 population (2010 est.) |
| Death rate | 10.51 deaths/1,000 population (July 2010 est.) |
| Life expectancy | 79.66 years |
| • male | 77.11 years |
| • female | 82.37 years (2010 est.) |
| Fertility rate | 1.35 children born/woman (2018)[1] |
| Infant mortality rate | 3.47 deaths per 1,000 live births (2018 est) |
| Age structure | |
| 0–14 years | 14.4% |
| 15–64 years | 66.6% |
| 65 and over | 19.0% |
| Sex ratio | |
| At birth | 1.06 male(s)/female (2008 est.) |
| Under 15 | 1.06 male(s)/female |
| 15–64 years | 1.00 male(s)/female |
| 65 and over | 0.78 male(s)/female |
| Nationality | |
| Nationality | noun: Greek(s) adjective: Greek |
| Major ethnic | Greeks |
Historical overview
Greece was inhabited as early as the Paleolithic period. Prior to the 2nd millennium BC, the Greek peninsula was inhabited by various pre-Hellenic peoples, the most notable of which were the Pelasgians. The Greek language ultimately dominated the peninsula and Greece's mosaic of small city-states became culturally similar. The population estimates on the Greeks during the 4th century BC, is approximately 3.5 million on the Greek peninsula and 4 to 6.5 million in the rest of the entire Mediterranean Basin,[2] including all colonies such as those in Magna Graecia, Asia Minor and the shores of the Black Sea.
During the history of the Byzantine Empire, the Greek peninsula was occasionally invaded by the foreign peoples like Goths, Avars, Slavs, Normans, Franks and other Romance-speaking peoples who had betrayed the Crusades. The only group, however, that planned to establish permanent settlements in the region were the Slavs. They settled in isolated valleys of the Peloponnese and Thessaly, establishing segregated communities that were referred by the Byzantines as Sclaveni. Traces of Slavic culture in Greece are very rare and by the 9th century, the Sclaveni in Greece were largely assimilated. However, some Slavic communities managed to survive in rural Macedonia. At the same time a large Sephardi Jewish emigrant community from the Iberian peninsula established itself in Thessaloniki, while there were population movements of Arvanites and "Vlachs" (Aromanians and Megleno-Romanians), who established communities in several parts of the Greek peninsula. The Byzantine Empire ultimately fell to Ottoman Turks in the 15th century and as a result Ottoman colonies were established in the Balkans, notably in Macedonia, the Peloponnese and Crete. Many Greeks either fled to other European nations or to geographically isolated areas (i.e. mountains and heavily forested territories) in order to escape foreign rule. For those reasons, the population decreased in the plains, while increasing on the mountains. The population transfers with Bulgaria and Turkey that took place in the early 20th century, added in total some two million Greeks to the demography of the Greek Kingdom.
During the next decades, the population of Greece continued to increase, except during a large part of 1940s due to World War II and subsequent events. After 1940s the population of Greece continued to grow, though on a decreased pace after 1960s, due to a gradual decrase in fertility and emigration to various countries, such as West Germany, Australia, United Kingdom and many others. The birth rate decreased significantly in 1980s, while in 1987 the Greek population surpassed 10 million. At this time Greece had started to appear a positive migration rate, due to the return of Greek Civil War refugees and international immigration. During the nineties the population increased by close a million, as the collapse of the communist governments in Eastern Europe and the economic downturn resulted in a significant influx of Eastern European immigrants in Greece and especially from the Balkans, including many Greeks living in these countries. In 2000s the population continued to increase reaching 11 million, thanks to an increased birth rate, a stable influx of migrants from other countries and the return of Greeks from United States, Germany, Australia and other countries. In the 2010s, in the wake of the Greek financial crisis, the population started to decrase and birthrates plummeted, while death rates increased due to an aging population. Many Greeks emigrated abroad, while more recently the population decrease has been largely stabilised due to foreign immigration.
Urbanization
Population

| Year | Pop. | ±% |
|---|---|---|
| 1928 | 6,204,684 | — |
| 1940 | 7,344,860 | +18.4% |
| 1951 | 7,632,801 | +3.9% |
| 1961 | 8,398,050 | +10.0% |
| 1971 | 8,831,036 | +5.2% |
| 1981 | 9,729,350 | +10.2% |
| 1991 | 10,258,364 | +5.4% |
| 2001 | 10,964,020 | +6.9% |
| 2011 | 11,123,392 | +1.5% |
| 2017 | 10,768,477 | −3.2% |
| Source: Hellenic Statistical Authority | ||
According to the 2001 census the population of Greece was 10,964,020. Eurostat estimations as of January 2008 gave the number of 11,214,992 inhabitants in the Greek peninsula. According to the official 2011 census, which used sophisticated methodology, the population of Greece was 10,816,286.
| Census | Population | Change |
| 1971 | 8,768,372 | - |
| 1981 | 9,739,589 | 11.1% |
| 1991 | 10,259,900 | 5.3% |
| 2001 | 10,964,020 | 6.9% |
| 2011 | 10,816,286 | -0.88% |
By region
Greece is divided into nine geographic regions. The population of each region according to the 2001 census:
| Region | Population |
|---|---|
| Aegean Islands | 508,807 |
| Central Greece | 4,591,568 |
| Crete | 601,131 |
| Epirus | 353,822 |
| Ionian Islands | 212,984 |
| Macedonia | 2,424,765 |
| Peloponnese | 1,155,019 |
| Thessaly | 753,888 |
| Thrace | 362,038 |
| Total | 10,964,020 |
Fertility rate from 1850 to 1920
The total fertility rate is the number of children born per woman. It is based on fairly good data for the entire period. Sources: Our World In Data and Gapminder Foundation.[4]
| Years | 1850 | 1851 | 1852 | 1853 | 1854 | 1855 | 1856 | 1857 | 1858 | 1859 | 1860[4] |
|---|---|---|---|---|---|---|---|---|---|---|---|
| Total Fertility Rate in Greece | 6.03 | 5.81 | 5.59 | 5.36 | 5.14 | 4.92 | 4.7 | 4.47 | 4.25 | 4.03 | 3.81 |
| Years | 1861 | 1862 | 1863 | 1864 | 1865 | 1866 | 1867 | 1868 | 1869 | 1870[4] |
|---|---|---|---|---|---|---|---|---|---|---|
| Total Fertility Rate in Greece | 3.95 | 3.87 | 3.78 | 3.94 | 3.73 | 4.03 | 3.83 | 3.85 | 3.86 | 3.77 |
| Years | 1871 | 1872 | 1873 | 1874 | 1875 | 1876 | 1877 | 1878 | 1879 | 1880[4] |
|---|---|---|---|---|---|---|---|---|---|---|
| Total Fertility Rate in Greece | 3.81 | 3.83 | 3.7 | 3.91 | 3.78 | 3.97 | 3.82 | 3.64 | 3.32 | 3.27 |
| Years | 1881 | 1882 | 1883 | 1884 | 1885 | 1886 | 1887 | 1888 | 1889 | 1890[4] |
|---|---|---|---|---|---|---|---|---|---|---|
| Total Fertility Rate in Greece | 3.28 | 3.38 | 3.35 | 3.83 | 3.82 | 4.01 | 4.19 | 4.38 | 4.57 | 4.73 |
| Years | 1891 | 1892 | 1893 | 1894 | 1895 | 1896 | 1897 | 1898 | 1899 | 1900[4] |
|---|---|---|---|---|---|---|---|---|---|---|
| Total Fertility Rate in Greece | 4.8 | 4.88 | 4.95 | 5.03 | 5.1 | 5.18 | 5.25 | 5.32 | 5.4 | 5.47 |
| Years | 1901 | 1902 | 1903 | 1904 | 1905 | 1906 | 1907 | 1908 | 1909 | 1910[4] |
|---|---|---|---|---|---|---|---|---|---|---|
| Total Fertility Rate in Greece | 5.35 | 5.22 | 5.1 | 4.97 | 4.85 | 4.72 | 4.6 | 4.47 | 4.35 | 4.22 |
| Years | 1911 | 1912 | 1913 | 1914 | 1915 | 1916 | 1917 | 1918 | 1919 | 1920[4] |
|---|---|---|---|---|---|---|---|---|---|---|
| Total Fertility Rate in Greece | 4.09 | 3.97 | 3.84 | 3.72 | 3.59 | 3.47 | 3.34 | 3.22 | 3.09 | 2.97 |
Life expectancy from 1950 to 2015
| Period | Life expectancy in Years |
Period | Life expectancy in Years |
|---|---|---|---|
| 1950–1955 | 65.8 | 1985–1990 | 75.6 |
| 1955–1960 | 67.2 | 1990–1995 | 77.4 |
| 1960–1965 | 69.3 | 1995–2000 | 78.1 |
| 1965–1970 | 70.1 | 2000–2005 | 79.1 |
| 1970–1975 | 71.8 | 2005–2010 | 80.0 |
| 1975–1980 | 72.8 | 2010–2015 | 80.6 |
| 1980–1985 | 74.5 |
Source: UN World Population Prospects[5]
Vital statistics from 1921
Vital statistics for population change, 1921 to present:[6][7][8]
|
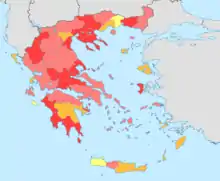
1.7 - 2.0
1.5 - 1.7
1.3 - 1.5
< 1.3 |
| Year | Average population | Live births[9] | Deaths | Natural change | Crude birth rate (per 1000) | Crude death rate (per 1000) | Natural change (per 1000) | Total fertility rates[fn 1][4][10][11] |
|---|---|---|---|---|---|---|---|---|
| 1921 | 5,050,000 | 107,000 | 69,000 | 38,000 | 21.2 | 13.7 | 7.5 | 2.84 |
| 1922 | 5,097,000 | 110,000 | 82,000 | 18,000 | 21.6 | 16.1 | 3.5 | 2.88 |
| 1923 | 6,010,000 | 113,926 | 102,042 | 11,884 | 19.0 | 17.0 | 2.0 | 2.55 |
| 1924 | 6,000,000 | 117,014 | 93,320 | 23,694 | 19.5 | 15.6 | 3.9 | 2.61 |
| 1925 | 5,958,000 | 156,367 | 88,633 | 67,734 | 26.2 | 14.9 | 11.4 | 3.52 |
| 1926 | 6,042,000 | 181,278 | 84,136 | 97,142 | 30.0 | 13.9 | 16.1 | 4.02 |
| 1927 | 6,127,000 | 176,527 | 100,020 | 76,507 | 28.8 | 16.3 | 12.5 | 3.86 |
| 1928 | 6,210,000 | 189,250 | 105,665 | 83,585 | 30.5 | 17.0 | 13.5 | 4.09 |
| 1929 | 6,286,000 | 181,870 | 115,561 | 66,309 | 28.9 | 18.4 | 10.5 | 3.87 |
| 1930 | 6,367,000 | 199,565 | 103,811 | 95,754 | 31.3 | 16.3 | 15.0 | 4.19 |
| 1931 | 6,463,000 | 199,243 | 114,369 | 84,874 | 30.8 | 17.7 | 13.1 | 3.83 |
| 1932 | 6,544,000 | 185,523 | 117,593 | 67,930 | 28.4 | 18.0 | 10.4 | 3.8 |
| 1933 | 6,625,000 | 189,583 | 111,447 | 78,136 | 28.6 | 16.8 | 11.8 | 3.84 |
| 1934 | 6,727,000 | 208,929 | 100,651 | 108,278 | 31.1 | 15.0 | 16.1 | 4.16 |
| 1935 | 6,837,000 | 192,511 | 101,416 | 91,095 | 28.2 | 14.8 | 13.3 | 3.77 |
| 1936 | 6,936,000 | 193,343 | 105,005 | 88,338 | 27.9 | 15.1 | 12.7 | 3.68 |
| 1937 | 7,029,000 | 183,878 | 105,674 | 78,204 | 26.2 | 15.0 | 11.1 | 3.51 |
| 1938 | 7,122,000 | 184,509 | 93,766 | 90,743 | 25.9 | 13.2 | 12.7 | 3.47 |
| 1939 | 7,222,000 | 178,852 | 100,459 | 78,393 | 24.8 | 13.9 | 10.9 | 3.32 |
| 1940 | 7,319,000 | 179,500 | 93,830 | 85,670 | 24.5 | 12.8 | 11.7 | 3.29 |
| 1941 | 7,370,000 | 134,760 | 125,710 | 9,050 | 18.3 | 17.1 | 1.2 | 3.19 |
| 1942 | 7,350,000 | 132,640 | 191,030 | -58,390 | 18.0 | 26.0 | -7.9 | 3.08 |
| 1943 | 7,280,000 | 122,170 | 111,320 | 10,850 | 16.8 | 15.3 | 1.5 | 2.98 |
| 1944 | 7,300,000 | 145,530 | 110,810 | 34,720 | 19.9 | 15.2 | 4.8 | 2.88 |
| 1945 | 7,310,000 | 183,470 | 85,540 | 97,930 | 25.1 | 11.7 | 13.4 | 2.78 |
| 1946 | 7,430,000 | 209,360 | 73,500 | 135,860 | 28.2 | 9.9 | 18.3 | 2.68 |
| 1947 | 7,520,000 | 206,400 | 70,340 | 136,060 | 27.4 | 9.4 | 18.1 | 2.58 |
| 1948 | 7,500,000 | 210,000 | 96,000 | 114,000 | 28.0 | 12.8 | 15.2 | 2.48 |
| 1949 | 7,480,000 | 139,108 | 59,450 | 79,658 | 18.6 | 7.9 | 10.6 | 2.37 |
| 1950 | 7,554,000 | 151,314 | 53,755 | 97,559 | 20.0 | 7.1 | 12.9 | 2.47 |
| 1951 | 7,646,000 | 155,422 | 57,508 | 97,914 | 20.3 | 7.5 | 12.8 | 2.47 |
| 1952 | 7,733,000 | 149,637 | 53,377 | 96,260 | 19.4 | 6.9 | 12.4 | 2.48 |
| 1953 | 7,817,000 | 143,765 | 56,680 | 87,085 | 18.4 | 7.3 | 11.1 | 2.49 |
| 1954 | 7,893,000 | 151,892 | 55,625 | 96,267 | 19.2 | 7.0 | 12.2 | 2.48 |
| 1955 | 7,966,000 | 154,263 | 54,781 | 99,482 | 19.4 | 6.9 | 12.5 | 2.47 |
| 1956 | 8,031,000 | 158,203 | 59,460 | 96,727 | 19.4 | 7.4 | 12.0 | 2.44 |
| 1957 | 8,096,000 | 155,940 | 61,664 | 93,528 | 19.2 | 7.6 | 11.6 | 2.42 |
| 1958 | 8,173,000 | 155,359 | 58,160 | 97,199 | 19.0 | 7.1 | 11.9 | 2.38 |
| 1959 | 8,258,000 | 160,199 | 60,852 | 99,347 | 19.4 | 7.4 | 12.0 | 2.36 |
| 1960 | 8,334,000 | 157,239 | 60,563 | 96,676 | 18.9 | 7.3 | 11.6 | 2.33 |
| 1961 | 8,398,000 | 150,716 | 63,955 | 86,761 | 17.9 | 7.6 | 10.3 | 2.32 |
| 1962 | 8,448,000 | 152,158 | 66,554 | 85,604 | 18.0 | 7.9 | 10.1 | 2.32 |
| 1963 | 8,480,000 | 148,249 | 66,813 | 81,436 | 17.5 | 7.9 | 9.6 | 2.34 |
| 1964 | 8,510,000 | 153,109 | 69,429 | 83,680 | 18.0 | 8.1 | 9.8 | 2.37 |
| 1965 | 8,551,000 | 151,448 | 67,269 | 84,179 | 17.7 | 7.8 | 9.8 | 2.41 |
| 1966 | 8,614,000 | 154,613 | 67,912 | 86,701 | 17.9 | 7.9 | 10.1 | 2.46 |
| 1967 | 8,686,000 | 162,839 | 71,975 | 90,864 | 18.7 | 8.3 | 10.4 | 2.51 |
| 1968 | 8,741,000 | 160,338 | 73,309 | 87,029 | 18.3 | 8.4 | 10.0 | 2.54 |
| 1969 | 8,773,000 | 154,077 | 71,825 | 82,252 | 17.6 | 8.2 | 9.4 | 2.56 |
| 1970 | 8,793,000 | 144,928 | 74,009 | 70,919 | 16.5 | 8.4 | 8.1 | 2.57 |
| 1971 | 8,831,000 | 141,126 | 73,819 | 67,307 | 16.0 | 8.4 | 7.6 | 2.57 |
| 1972 | 8,889,000 | 140,891 | 76,859 | 64,032 | 15.9 | 8.6 | 7.2 | 2.55 |
| 1973 | 8,929,000 | 137,526 | 77,648 | 59,878 | 15.4 | 8.7 | 6.7 | 2.54 |
| 1974 | 8,962,000 | 144,069 | 76,303 | 67,766 | 16.1 | 8.5 | 7.6 | 2.52 |
| 1975 | 9,047,000 | 142,273 | 80,077 | 62,196 | 15.7 | 8.9 | 6.9 | 2.33 |
| 1976 | 9,167,000 | 146,566 | 81,818 | 64,748 | 16.0 | 8.9 | 7.1 | 2.35 |
| 1977 | 9,269,000 | 143,739 | 83,750 | 59,989 | 15.4 | 9.0 | 6.4 | 2.28 |
| 1978 | 9,395,000 | 146,588 | 81,615 | 64,973 | 15.5 | 8.7 | 6.9 | 2.29 |
| 1979 | 9,534,000 | 147,965 | 82,338 | 65,627 | 15.5 | 8.6 | 6.9 | 2.26 |
| 1980 | 9,643,000 | 148,134 | 87,282 | 60,852 | 15.4 | 9.1 | 6.3 | 2.23 |
| 1981 | 9,729,000 | 140,953 | 86,261 | 54,692 | 14.5 | 8.9 | 5.6 | 2.10 |
| 1982 | 9,790,000 | 137,275 | 86,345 | 50,930 | 14.0 | 8.8 | 5.2 | 2.03 |
| 1983 | 9,847,000 | 132,608 | 90,586 | 42,022 | 13.5 | 9.2 | 4.3 | 1.94 |
| 1984 | 9,896,000 | 125,724 | 88,397 | 37,327 | 12.7 | 8.9 | 3.8 | 1.82 |
| 1985 | 9,934,000 | 116,481 | 92,886 | 23,595 | 11.7 | 9.4 | 2.4 | 1.68 |
| 1986 | 9,967,000 | 112,810 | 91,469 | 20,781 | 11.3 | 9.2 | 2.1 | 1.60 |
| 1987 | 10,001,000 | 106,392 | 95,232 | 10,667 | 10.6 | 9.5 | 1.1 | 1.50 |
| 1988 | 10,037,000 | 107,505 | 93,031 | 14,637 | 10.7 | 9.3 | 1.5 | 1.50 |
| 1989 | 10,090,000 | 101,657 | 92,717 | 8,432 | 10.0 | 9.2 | 0.8 | 1.40 |
| 1990 | 10,161,000 | 102,229 | 94,152 | 8,077 | 10.1 | 9.3 | 0.8 | 1.39 |
| 1991 | 10,257,000 | 102,620 | 95,498 | 7,122 | 10.0 | 9.3 | 0.7 | 1.37 |
| 1992 | 10,370,000 | 104,081 | 98,231 | 5,850 | 10.0 | 9.5 | 0.6 | 1.36 |
| 1993 | 10,466,000 | 101,799 | 97,419 | 4,380 | 9.7 | 9.3 | 0.4 | 1.32 |
| 1994 | 10,553,000 | 103,763 | 97,807 | 5,956 | 9.8 | 9.3 | 0.6 | 1.33 |
| 1995 | 10,635,000 | 101,495 | 100,158 | 1,337 | 9.5 | 9.4 | 0.1 | 1.28 |
| 1996 | 10,710,000 | 100,718 | 100,740 | -22 | 9.4 | 9.4 | -0.0 | 1.26 |
| 1997 | 10,777,000 | 102,038 | 99,738 | 2,300 | 9.5 | 9.3 | 0.2 | 1.27 |
| 1998 | 10,835,000 | 100,894 | 102,668 | -1,774 | 9.3 | 9.5 | -0.2 | 1.24 |
| 1999 | 10,883,000 | 100,643 | 103,304 | -2,661 | 9.2 | 9.5 | -0.3 | 1.23 |
| 2000 | 10,918,000 | 103,274 | 105,219 | -1,952 | 9.5 | 9.6 | -0.1 | 1.25 |
| 2001 | 10,862,146 | 102,282 | 102,559 | -277 | 9.4 | 9.4 | 0.0 | 1.25 |
| 2002 | 10,902,005 | 103,569 | 103,915 | -346 | 9.5 | 9.5 | 0.0 | 1.28 |
| 2003 | 10,928,091 | 104,420 | 105,529 | -1,109 | 9.6 | 9.7 | -0.1 | 1.29 |
| 2004 | 10,955,163 | 105,655 | 104,942 | 713 | 9.6 | 9.6 | 0.1 | 1.31 |
| 2005 | 10,987,352 | 107,545 | 105,091 | 2,454 | 9.8 | 9.6 | 0.2 | 1.34 |
| 2006 | 11,020,393 | 112,042 | 105,476 | 6,566 | 10.2 | 9.6 | 0.6 | 1.40 |
| 2007 | 11,048,499 | 111,926 | 109,895 | 2,031 | 10.1 | 9.9 | 0.2 | 1.41 |
| 2008 | 11,077,863 | 118,302 | 107,979 | 10,323 | 10.7 | 9.7 | 0.9 | 1.50 |
| 2009 | 11,107,024 | 117,933 | 108,316 | 9,617 | 10.6 | 9.8 | 0.9 | 1.50 |
| 2010 | 11,121,383 | 114,766 | 109,084 | 5,682 | 10.3 | 9.8 | 0.5 | 1.48 |
| 2011 | 11,104,995 | 106,428 | 111,099 | -4,671 | 9.6 | 10.0 | -0.4 | 1.40 |
| 2012[12] | 11,045,040 | 100,371 | 116,668 | -16,297 | 9.1 | 10.6 | -1.5 | 1.34 |
| 2013[13] | 10,965,241 | 94,134 | 111,794 | -17,660 | 8.6 | 10.2 | -1.6 | 1.29 |
| 2014[14] | 10,892,369 | 92,149 | 113,740 | -21,591 | 8.5 | 10.4 | -2.0 | 1.30 |
| 2015[15] | 10,820,964 | 91,847 | 121,183 | -29,336 | 8.5 | 11.2 | -2.7 | 1.33 |
| 2016[16] | 10,775,989 | 92,898 | 118,788 | -25,890 | 8.6 | 11.0 | -2.4 | 1.38 |
| 2017[17] | 10,754,701 | 88,553 | 124,495 | -35,942 | 8.2 | 11.6 | -3.3 | 1.35 |
| 2018[18] | 10,732,894 | 86,440 | 120,296 | -33,856 | 8.1 | 11.2 | -3.2 | 1.35 |
| 2019[19] | 10,717,169 | 83,763 | 124,965 | -41,202 | 7.8 | 11.7 | -3.8 | 1.30 |
| 2020p[20] | 10,718,565 | 85,605 | 131,839 | -46,234 | 7.9 | 12.3 | -4.4 | |
Other demographic statistics
Demographic statistics according to the World Population Review in 2019.[21]
- One birth every 6 minutes
- One death every 4 minutes
- Net loss of one person every 21 minutes
- One net migrant every 53 minutes
.svg.png.webp)
Demographic statistics according to the CIA World Factbook, unless otherwise indicated.[11]
- Population
- 10,761,523 (July 2018 est.)
- 10,768,477 (July 2017 est.)
- Age structure
- 0-14 years: 14.53% (male 794,918/female 745,909)
- 15-24 years: 10.34% (male 577,134/female 519,819)
- 25-54 years: 39.6% (male 2,080,443/female 2,119,995)
- 55-64 years: 13.1% (male 656,404/female 732,936)
- 65 years and over: 22.43% (male 1,057,317/female 1,322,176) (2020 est.)
- 0-14 years: 13.83% (male 767,245/female 722,313)
- 15-24 years: 9.67% (male 532,179/female 509,487)
- 25-54 years: 42.45% (male 2,275,984/female 2,295,082)
- 55-64 years: 13.13% (male 692,420/female 721,641)
- 65 years and over: 20.91% (male 986,816/female 1,265,310) (2017 est.)
- 0-14 years: 14.2% (male 787,143/female 741,356)
- 15-64 years: 66.2% (male 3,555,447/female 3,567,383)
- 65 years and over: 19.6% (male 923,177/female 1,185,630) (2011 est.)
- Median age
- total: 45.3 years. Country comparison to the world: 9th
- male: 43.7 years
- female: 46.8 years (2020 est.)
- total: 44.5 years
- male: 43.5 years
- female: 45.6 years (2017 est.)
- total: 42.5 years
- male: 41.4 years
- female: 43.6 years (2011 est.)
- Mother's mean age at first birth
- 29.9 years (2017 est.)
- Total fertility rate
- 1.39 children born/woman (2021 est.) Country comparison to the world: 225th
- Population growth rate
- -0.34% (2021 est.) Country comparison to the world: 221rd
- Birth rate
- 7.72 births/1,000 population (2021 est.) Country comparison to the world: 222th
- 8.4 births/1,000 population (2017 est.)
- Death rate
- 12.05 deaths/1,000 population (2021 est.) Country comparison to the world: 14st
- Net migration rate
- 0.97 migrant(s)/1,000 population (2021 est.) Country comparison to the world: 62th
- Life expectancy at birth
- total population: 81.28 years. Country comparison to the world: 41th
- male: 78.73 years
- female: 84 years (2021 est.)
- Infant mortality rate
- total: 3.61 deaths/1,000 live births. Country comparison to the world: 204th
- male: 4 deaths/1,000 live births
- female: 3.19 deaths/1,000 live births (2021 est.)
- Ethnic groups
population: Greek 91.6%, Albanian 4.4%, other 4% (2011) Note: data represent citizenship, since Greece does not collect data on ethnicity
- Dependency ratios
- total dependency ratio: 56.1
- youth dependency ratio: 21.3
- elderly dependency ratio: 34.8
- potential support ratio: 2.9 (2020 est.)
- Religions
Greek Orthodox (official) 81-90%, Muslim 2%, other 3%, none 4-15%, unspecified 1% (2015 est.)
- Urbanization
- urban population: 79.7% of total population (2020)
- rate of urbanization: 0.22% annual rate of change (2015-20 est.)
- Unemployment, youth ages 15–24
- total: 39.9%. Country comparison to the world: 11th
- male: 36.4%
- female: 43.9% (2018 est.)
- School life expectancy (primary to tertiary education)
- total: 20 years
- male: 20 years
- female: 20 years (2018)
Immigration
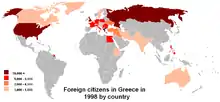
Greece has received a large number of immigrants since the early 1990s. The majority of them come from the neighbouring countries. As of 2011, the number of foreigners in an enumerated total of 10,815,197 people was 911,299.
Foreign-born by country (Eurostat):[22]
| 2010 | 2014 | |
|---|---|---|
| Total | 828,400 | 727,500 |
| 384,600 | 337,700 | |
| 62,600 | 45,100 | |
| 55,700 | 43,000 | |
| 45,700 | 40,900 | |
| 32,400 | 27,200 | |
| 29,300 | 25,700 | |
| 20,100 | 18,000 | |
| 10,800 | 16,600 | |
| 9,500 | 12,500 | |
| 10,200 | 10,900 | |
| 5,200 | 10,700 | |
| 13,300 | 10,700 | |
| 10,200 | 9,800 | |
| 14,200 | 8,400 | |
| 7,500 | 8,300 | |
| others | 117,100 | 102,000 |
Illegal immigration
Greece has received many illegal immigrants beginning in the 1990s and continuing during the 2000s and 2010s. Migrants make use of the many islands in the Aegean Sea, directly west of Turkey. A spokesman for the European Union's border control agency said that the Greek-Albanian border is "one of Europe's worst-affected external land borders." Migrants across the Evros region bordering Turkey face land-mines. Principal illegal immigrants include Albanians, Indians, Kurds, Afghans, Iraqis and Somalis.[23][24]
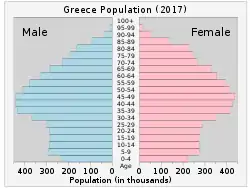
Age structure
Being part of the phenomenon of the aging of Europe, the Greek population shows a rapid increase of the percentage of the elderly people. Greece's population census of 1961 found that 10.9% of the total population was above the age of 65, while the percentage of this group age increased to 19.0% in 2011. In contrast, the percentage of the population of the ages 0–14 had a total decrease of 10.2% between 1961 and 2011.
| Age group | 1971 | 1981 | 1991 | 2001 | 2011 | |||||
|---|---|---|---|---|---|---|---|---|---|---|
| Population | % | Population | % | Population | % | Population | % | Population | % | |
| 0–14 | 2,223,904 | 25.4 | 2,307,297 | 23.7 | 1,974,867 | 19.2 | 1,664,085 | 15.2 | 1,576,500 | 14.4 |
| 15–64 | 5,587,352 | 63.7 | 6,192,751 | 63.6 | 6,880,681 | 67.1 | 7,468,395 | 68.1 | 7,122,830 | 66.6 |
| 65+ | 957,116 | 10.9 | 1,239,541 | 12.7 | 1,404,352 | 13.7 | 1,831,540 | 16.7 | 2,108,807 | 19.0 |
| Total | 8,768,372 | 9,739,589 | 10,259,900 | 10,964,020 | 10,816,286 | |||||
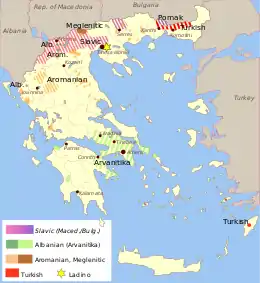
Ethnic groups, languages and religion
The population of northern Greece has primarily been ethnically, religiously and linguistically diverse.[25] The Muslim minority of Greece is the only explicitly recognized minority in Greece by the government. The officials define it as a group of Greek Muslims numbering 98,000 people, consisting of Turks (50%), Pomaks (35%) and Romani (15%). No other minorities are officially acknowledged by the government.[26][27][28] There is no official information for the size of the ethnic, linguistic and religious minorities because asking the population questions pertaining to the topic have been abolished since 1951.[29]
Religion in Greece for the period 2006-2015 according to Swiss Metadatabse of Religious Affiliation in Europe[30]
Minorities in Greece according to Minority Rights Group International:[31]
- Roma/Gypsies: 160,000-250,000
- Vlachs (Aromanians and Megleno-Romanians): 200,000
- Slavs: 100,000-200,000
- Arvanites: 95,000
- Turks: 90,000
- Pomaks: 35,000
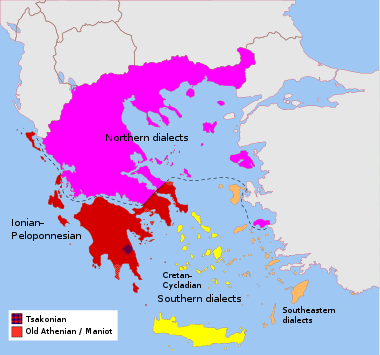
The official language of Greece is Greek, spoken by almost all as a second language at least. Additionally, there are a number of linguistic minority groups that are bilingual in a variety of non-Greek languages, and parts of these groups identify ethnically as Greeks.
| Language (and religion) | census 1879[32][33] | estimate 1913[34] | census 1928[35][26][36] | census 1940[35][36][37] | census 1951[35][38] | census 1986[39] | ||||||||
|---|---|---|---|---|---|---|---|---|---|---|---|---|---|---|
| Number | % | Number | % | Number | % | Number | % | Number | % | Number | % | |||
| Greek | 5,759,523 | 92.8 | 6,902,339 | 92.5 | 7,297,878 | 95.6 | ||||||||
| Turkish (altogether) | 191,254 | 3.1 | 229,075 | 3.8 | 179,895 | 2.4 | ||||||||
| Turkish (and Orthodox Christian) | 103,642 | 1.7 | ||||||||||||
| Turkish (and Muslim) | 86,506 | 1.4 | ||||||||||||
| Slavic3 | 300,000- 500,000 | 6.3- 10.6 | 81,9842 | 1.3 | 86,086 | 1.2 | 41,017 | 0.5 | 180,180 | |||||
| Bulgarian (and Muslim) | 16,775 | 0.3 | ||||||||||||
| Pomak | 18,086 | 0.2 | 18,671 | 0.2 | ||||||||||
| "Koutsovlach" | 19,703 | 0.3 | 53,997 | 0.7 | 39,855 | 0.5 | ||||||||
| Albanian | 49,632 | 0.7 | 22,7364 | 0.3 | ||||||||||
| Albanian/Arvanitika | 225,000 | |||||||||||||
| Albanian (and Muslim) | 18,598 | 0.3 | ||||||||||||
| Armenian | 33,634 | 0.5 | 26,827 | 0.4 | 8,990 | 0.1 | ||||||||
| Gypsy | 4,998 | 0.1 | 8,141 | 0.1 | 7,429 | 0.1 | ||||||||
| Russian | 3,295 | 0.1 | 8,126 | 0.1 | 3,815 | 0.1 | ||||||||
| French | 4,518 | 0.1 | 2,101 | 0.0 | ||||||||||
| Romanian | 2,901 | 0.0 | 2,082 | 0.0 | ||||||||||
| English | 2,098 | 0.0 | 3,529 | 0.0 | 1,456 | 0.0 | ||||||||
| Spanish | 63,200 | 1.0 | 53,125 | 0.7 | 1,339 | 0.0 | ||||||||
| German | 3,401 | 0.0 | 1,301 | 0.0 | ||||||||||
| Italian | 3,199 | 0.1 | 4,426 | 0.1 | 894 | 0.0 | ||||||||
| Hebrew or Yiddish | 34 | 0.0 | 853 | 0.0 | ||||||||||
| Others | 6,248 | 0.1 | 5,694 | 0.1 | 2,489 | 0.1 | ||||||||
| Total | 1,679,775 | 4,734,990 | 6,204,684 | 7,344,860 | 7,632,801 | |||||||||
| Notes: 1 Census figures are considered "unreliable".[40] 2The 1928 census figure (81,984) of the Slavic speakers does not reflect their actual strength due to either an official policy or reluctance of the concerned, and perhaps represents a number of speakers, who are lacking Greek national consciousness, while contemporary Greek reports estimate at least 200,000 Bulgarian-speaking inhabitants in the country.[41] | ||||||||||||||
Languages spoken in Greece:
| Language | Classification | Speakering population | Spoken by | Ethnic population | Region | Notes |
|---|---|---|---|---|---|---|
| Greek classification | ||||||
| Cappadocian[43] | IE, Greek, Attic | 2,800 (2015 M. Janse) | Cappadocians | Mandra, Neo Agioneri and Xirochori | More distinct from standard Greek than Pontic Greek | |
| Cretan | 600,000 | Cretans | Crete | |||
| Greek[43] | IE, Greek, Attic | 10,700,000 (2012 European Commission ) | national | scattered | Lexical similarity: 84%–93% with Greek in Cyprus | |
| Greek, Ancient[43] | IE, Greek, Attic | no known L1 speakers | scattered | religious language | ||
| Pontic[43][44] | IE, Greek, Attic | 200,000 (2001 Johnstone and Mandryk)- 400,000 (2009 Z. Diakonikolaou) | Pontians | Macedonia and Epirus(Kilkis, Pella, and Serres; Thessaloniki, Drama and Imathia) | Greek and Pontic speakers reportedly do not understand each other and Pontians do not speak standard Greek | |
| Romano-Greek[43] | mixed Greek-Romani | 30 (2000) | Romani | Thessaly, Central Greece | Structured on Greek with heavy Romani lexicon | |
| Sarakatsani | IE, Greek, Doric | 80,000 | Sarakatsani | Central Greece, Thessaly, Epirus | ||
| Tsakonian[43][45] | IE, Greek, Doric | 200 (2007 Salminen)-1,500 (2010 M. Kisilier) | Tsakonians | Agios Andreas, Leonidio, Prastos, Kastanitsa, Melana, Pramatefti, Sapounakeika, Sitena, and Tyros | Not inherently intelligible with modern Greek. Lexical similarity with standard Greek: 70% or less. | |
| Other languages | ||||||
| Albanian, Arvanitika[43][42] | IE, Albanian, Tosk | 50,000 (1993 Lunden, 2007 Salminen) | Arvanites | 150,000 | southern Euboea, Salamis, Boeotia, Attica, Peloponnese, Western Greece and the Ionian Islands, Thessaly and Central Greece, Thrace | Heavily influenced by Greek. Christian |
| Albanian, Tosk[43] | IE, Albanian, Tosk | 10,000 (2002) | Tosk Albanians | Epirus and Western Macedonia(Central Florina, into Kastoria, Lehovo) | Cham Tosk | |
| Arabic[46] | Afro-Asiatic, Semitic, Central, South | 28,000 | Arabs | |||
| Assyrian Neo-Aramaic[46] | Afro-Asiatic, Semitic, Central, Aramaic, Eastern, Central, Northeastern | 2,000 | Assyrians | |||
| Armenian, Western[43] | IE, Armenian | 20,000 (2007) | Armenians | scattered, Attica, Thessaly and Central Greece | ||
| Aromanian[47][43] | IE, Italic, Romance, Eastern | 50,000 (1999 Salminen)- 200,000 (1995 Greek Monitor of Human and Minority Rights) | Aromanians | 700,000 (Association of French Aromanians) | Pindus Mountains, around Trikala, Epirus, Thessaly, Macedonia | Christian |
| Bulgarian[48][42] | IE, Balto-Slavic, Slavic, South, Eastern | 56,200 (2014), 10–40,000 (Trudgill) | Pomaks, Bulgarians | Macedonia and Thrace | Pomak, Muslim | |
| English[44] | IE, Germanic, West | 8,000 | ||||
| Farsi, Western[46] | IE, Indo-Iranian, Iranian, Western, Southwestern, Persian | 10,000 | Persians | |||
| German[43] | IE, Germanic, West | L1 users: 10,800 (2011 census), L2 users: 541,000 (2012 European Commission) | L1 users based on nationality | |||
| Greek sign language[43] | Sign language | 5,000 (2014 EUD)- 62,500 (2014 IMB) | national | scattered | ||
| Judeo-Italian[48] | IE, Italic, Romance, Italo-Western, Italo-Dalmatian | 50 (2007 Salminen) | Jews | Peloponnese, Western Greece and the Ionian Islands | ||
| Kurdish, Northern[44] | IE, Indo-European, Indo-Iranian, Iranian, Western, Northwestern, Kurdish | 22,500 | Kurds | |||
| Ladino[44] | IE, Italic, Romance, Italo-Western, Western, Gallo-Iberian, Ibero-Romance, West Iberian, Castilian | 2,000 | Jews | |||
| Megleno-Romanian[48][46] | IE, Italic, Romance, Eastern | 3,000 (2002)- 12,000 (1995) | Megleno-Romanians | Moglena | ||
| Romani, Balkan[43] | IE, Indo-Iranian, Indo-Aryan, Intermediate Divisions, Western, Romani | 40,000 (1996 B. Igla) | Romani | Attica; Macedonia, Peloponnese, Western Greece and the Ionian Islands, Epirus | Christian, Muslim | |
| Romani, Vlax | IE, Indo-Iranian, Indo-Aryan, Intermediate Divisions, Western, Romani | 1,000 | Romani | Attica, Thessaly, Central Greece, Epirus, Western Macedonia | Christian | |
| Russian[44] | IE, Balto-Slavic, Slavic, East | Russians | ||||
| Serbian[44] | IE, Balto-Slavic, Slavic, South, Western | Serbs | ||||
| Slavic[44][42][43] | IE, Balto-Slavic, Slavic, South, Eastern | 60–90,000 (Trudgill), 250,000 (2007 Boskov) | Slavic-speakers of Greek Macedonia | Macedonia (mainly Florina, Pella and Thessaloniki; Kastoria, Kozani, Kilkis, Imathia, Serres), Epirus (Ioannina) | Christian | |
| Turkish[43] | Turkic, Southern | 40,000 (L1: 9,700, L2: 30,300, 2014) | Turks, Karamanlides, Pomaks | Macedonia and Thrace, Aegean | Muslim, Christian | |
| Turkish, Balkan Gagauz[46] | Turkic, Southern | Gagauzes | ||||
| Urum[44] | Turkic | Urums | ||||
| Orthodox | 7,472,559 (97.9%) |
| Muslim | 112,665 (1.4%) |
| Catholic | 28,430 (0.4%) |
| Protestant and other Christian | 12,677 (0.2%) |
| Jewish | 6,325 (0.1%) |
| Total | 7,632,801 |
|---|
According to the Greek constitution, Eastern Orthodox Christianity is recognized as the "prevailing religion" in Greece. During the centuries that Greece was part of the Ottoman Empire, besides its spiritual mandate, the Orthodox Church, based in Constantinople (present-day Istanbul), also functioned as an official representative of the Christian population of the empire. The Church is often credited with the preservation of the Greek language, values, and national identity during Ottoman times. The Church was also an important rallying point in the war for independence against the Ottoman Empire, although the official Church in Constantinople initially condemned the breakout of the armed struggle in fear of retaliation from the Ottoman side. The Church of Greece was established shortly after the formation of a Greek national state. Its authority to this day extends only to the areas included in the independent Greek state before the Balkan Wars of 1912–1913. There is a Muslim minority concentrated in Thrace and officially protected by the Treaty of Lausanne (1923). Besides Pomaks (Muslim Bulgarian[49] speakers) and Roma, it consists mainly of ethnic Turks, who speak Turkish and receive instruction in Turkish at special government-funded schools. There are also a number of Jews in Greece, most of whom live in Thessaloniki. There are also some Greeks who adhere to a reconstruction of the ancient Greek religion.[50] A place of worship has been recognized as such by court.[51]
Education
Greek education is free and compulsory for children between the ages of 5 and 15. English study is compulsory from first grade through high school. University education, including books, is also free, contingent upon the student's ability to meet stiff entrance requirements. A high percentage of the student population seeks higher education. More than 100,000 students are registered at Greek universities, and 15% of the population currently holds a university degree. Admission in a university is determined by state-administered exams, the candidate's grade-point average from high school, and his/her priority choices of major. About one in four candidates gains admission to Greek universities.
Greek law does not currently offer official recognition to the graduates of private universities that operate in the country, except for those that offer a degree valid in another European Union country, which is automatically recognized by reciprocity. As a result, a large and growing number of students are pursuing higher education abroad. The Greek Government decides through an evaluation procedure whether to recognize degrees from specific foreign universities as qualification for public sector hiring. Other students attend private, post-secondary educational institutions in Greece that are not recognized by the Greek Government. At the moment extensive public talk is made for the reform of the Constitution in order to recognize private higher education in Greece as equal with public and to place common regulations for both.
The number of Greek students studying at European institutions is increasing along with EU support for educational exchange. In addition, nearly 5,000 Greeks are studying in the United States, about half of whom are in graduate school. Greek per capita student representation in the US (one every 2,200) is among the highest in Europe.
See also
Notes
- In fertility rates, 2.1 and above is a stable population and has been marked blue, 2 and below leads to an aging population and the result is that the population decreases.
References
- "Hellenic Statistical Authority Demographic indicators / 2018". Retrieved 7 August 2020.
- Mogens Herman Hansen, The Shotgun Method: The Demography of the Ancient Greek City-State Culture, University of Missouri Press, 2006. Book review
- Official Final Census Results, 2011. "Announcement on the Publication of Revised 2011 Census Tables". statistics.gr. Hellenic Statistical Authority.CS1 maint: numeric names: authors list (link)
- Max Roser (2014), "Total Fertility Rate around the world over the last centuries", Our World In Data, Gapminder Foundation
- "World Population Prospects – Population Division – United Nations". Retrieved 15 July 2017.
- B.R. Mitchell. European historical statistics, 1750-1975.
- Demographic Yearbook 1948 (PDF). Statistical Office of the United Nations. United Nations in collaboration with the Department of Social Affairs. 1949. Retrieved 6 February 2017.
- "Population and Social Conditions: Demography". Hellenic Statistical Authority. Retrieved 6 January 2017.
- 1932–1940 and 1955–2017: "Statistics - ELSTAT - 01. Births - Absolute numbers and rates (1932 - 2017)". www.statistics.gr. Retrieved 20 July 2019. Web page contains link to data in XLS spreadsheet format.
- Chrysopoulos, Philip. "Greek Women Have Fewer Children than EU Average | GreekReporter.com".
- "Europe: Greece". The World Factbook. Central Intelligence Agency. Retrieved 28 November 2019.
- "Data on Vital Statistics: 2012".
- "Data on Vital Statistics: 2013".
- "Data on Vital Statistics: 2014".
- "Data on Vital Statistics: 2015".
- "Data on Vital Statistics: 2016".
- "Data on Vital Statistics: 2017".
- "Data on Vital Statistics: 2018".
- "Data on Vital Statistics: 2019".
- "Data on Vital Statistics: 2020".
- "Greece Population 2018", World Population Review
- International Migration Outlook 2016. International Migration Outlook. Paris, France: OECD Publishing. 19 September 2016. p. 371. doi:10.1787/1999124x. ISBN 9789264258440. ISSN 1999-124X. Retrieved 6 February 2017.
- "Destabilization Through Illegal Immigration in Greece". Research Institute for European and American Analysis. 2010. Archived from the original on 21 July 2011.
- Kitsantonis, Niki (4 October 2007). "Greece struggles to curb influx of illegal immigrants". The New York Times. Retrieved 6 February 2017.
- "Greece: People: Ethnic groups". Britannica online. Retrieved 6 February 2017.
- "Greek Helsinki Monitor". Retrieved 14 August 2015.
- Μουσουλμανικη Μειονοτητα Θρακησ [Muslim Minority of Thrace] (in Greek). Athens, Greece: Ministry of Foreign Affairs, Hellenic Resources Network. June 1999. Retrieved 6 January 2016.
Στοιχεια Απο Την Προσφατη Απογραφη Του Πληθυσμου [Figures from the recent Population Census] (in Greek). Water Info. 2001. Archived from the original on 21 July 2011. Retrieved 6 January 2016. - Newsweek Staff (25 March 2008). "Macedonia Fights for Its Name". Newsweek. Retrieved 30 January 2019.
'Greece is one of the rare countries of the EU that does not recognize the phrase 'minority rights.' They still have a concept of a pure nation—one state, one nation, one religion, one culture, everything Greek. And they do not want to recognize that in Greece there is a big Turkish minority, a big Albanian minority and one small Macedonian minority.'
- Fassmann, Heinz; Reeger, Ursula; Sievers, Wiebke (2009). Statistics and Reality: Concepts and Measurements of Migration in Europe. Amsterdam University Press. p. 237. ISBN 978-90-8964-052-9. Retrieved 27 March 2016.
- "SMRE". www.smre-data.ch.
- "MRG Directroy:Greece". Greece Overview. MRG. Retrieved 14 August 2015.
- Zervas (8 December 2016). Formal and informal education during the rise of Greek nationalism : learning to be Greek. Springer. p. 52. ISBN 9781137484154.
An 1879 Greek census found that, in the Peloponnese, Central Greece, Euboea and the island of Andros, there were nearly 225,000 Albanian/ Arvanitic speakers
- Martin, Frederick (1924). The statesman's year-book statistical and historical annual of the states of the civilised world for the year 1882. Oxford University. p. 288.
Greece, at the last census, taken June 1879, had a total population of 1,679,775
- Peter Trudgill & Daniel Schreier, "Greece and Cyprus", in: Sociolinguistics (HSK 3.3), 2nd ed., Berlin & New York: de Gruyter, p. 1881-1889, esp. p. 1885
- Angelopoulos, Ath. "Population Distribution of Greece Today According to Language, National Consciousness, and Religion". Balkan Studies. Thessaloniki. 43: 126–131. ISSN 2241-1674.
- Mavrogordatos, George Th. (2003). Οι εθνικές μειονότητες [The National Minorities] (in Greek). academia.edu. Retrieved 7 February 2017.
- Shea, John (1997). Macedonia and Greece: The Struggle to Define a New Balkan Nation. McFarland. p. 129. ISBN 978-0-7864-0228-1. Retrieved 7 February 2017.
- Clogg, Richard (2002). "Introduction". Minorities in Greece: Aspects of a Plural Society. C. Hurst & Co. Publishers. p. xi. ISBN 978-1-85065-705-7. Retrieved 7 February 2017.
- "Gordon, Raymond G., Jr. (ed.), 2005. Ethnologue: Languages of the World, Fifteenth edition. Dallas, Texas: SIL International".
- Clogg (January 2002). Minorities in Greece : aspects of a plural society. Hurst & Co. p. 112. ISBN 9781850657064.
Census figures are unreliable, and Greece has long since ceased to include linguistic minorities in its census
- Mavrogordatos, George (January 1983). Stillborn republic : social coalitions and party strategies in Greece, 1922-1936. University of California Press. p. 247. ISBN 9780520043589.
In any event, those of the 1928 Census for the Slavo-Macedonian-speaking population as a whole clearly do not reflect its actual strength, as a result of either official policy, or reluctance on the part of those concerned, or both. Contemporary Greek reports estimate as many as 200,000 "Bulgarian"-speaking inhabitants in Macedonia, of whom no more than 80,000-90,000 are considered to be lacking a Greek national consciousness – a number equivalent to that of the census, perhaps not accidentally. (49. See the reports of P. Demetriades to the Association for the Dissemination of Greek Letters, 13 August 1927 and 23 December 1927, VA File 373. Given the confidential nature and policy orientation of these reports, they should be rated as more reliable than public statements. On the actual number of Slavomacedonians, see also Christidès, pp. 64-65.)
- Trudgill, Peter; Schreier, Daniel (2006). "Greece and Cyprus". In Ulrich Ammon; Norbert Dittmar; Klaus J. Mattheier; Peter Trudgill (eds.). Sociolinguistics: An International Handbook of the Science of Language and Society. 3 (2nd ed.). Walter de Gruyter. pp. 1881–1889, esp. p. 1883. ISBN 978-3-11-018418-1. Retrieved 7 February 2017.
- "Simons, Gary F. and Charles D. Fennig (eds.). 2018. Ethnologue: Languages of the World, Twenty-first edition. Dallas, Texas: SIL International".
- "Lewis, M. Paul (ed.), 2009. Ethnologue: Languages of the World, Sixteenth edition. Dallas, Texas: SIL International".
- "Lewis, M. Paul, Gary F. Simons, and Charles D. Fennig (eds.). 2016. Ethnologue: Languages of the World, Nineteenth edition. Dallas, Texas: SIL International". Ethnologue.
- "Grimes, Barbara F. (ed.), 2000. Ethnologue: Languages of the World, Fourteenth edition. Dallas, Texas: SIL International". www.ethnologue.com.
- "Gordon, Raymond G., Jr. (ed.), 2005. Ethnologue: Languages of the World, Fifteenth edition. Dallas, Texas: SIL International".
- "Simons, Gary F. and Charles D. Fennig (eds.). 2017. Ethnologue: Languages of the World, Twentieth edition. Dallas, Texas: SIL International". Ethnologue.
- Gordon, Raymond G. Jr, ed. (2005). "Bulgarian". Ethnologue: Languages of the World (15th ed.). Dallas, Texas: SIL International. Archived from the original on 16 January 2009. Retrieved 3 January 2017.
- Brabant, Malcolm (21 January 2007). "Ancient Greek gods' new believers". BBC News. Retrieved 7 February 2017.
- Smith, Helena (4 May 2006). "Greek gods prepare for comeback". The Guardian. London. Archived from the original on 30 August 2013. Retrieved 24 August 2008.
External links
- General Secretariat of National Statistical Service of Greece (in Greek and English)
- The World Factbook